May 18, 2026
The Structural Forces Reshaping Gold's Role in the Global Financial System
Precious metals bull markets rarely announce themselves loudly. They build quietly across years, driven by forces that most mainstream commentary ignores until price action becomes impossible to overlook. The current gold cycle is a textbook example of this dynamic. For much of 2024, gold's sustained climb received minimal mainstream financial coverage, even as the underlying macro architecture supporting higher prices was already deeply entrenched. By the time headlines began consistently featuring gold above $4,300 per ounce, the move had already been underway for well over a year, rewarding those who recognised the structural signals early.
Understanding why gold to $6,000 an ounce is now the institutional consensus, not the fringe view, requires examining five interlocking forces that are simultaneously at work in the global economy.
When big ASX news breaks, our subscribers know first
Where Gold Has Been and Where the Institutional Consensus Points
The trajectory of gold prices over the past two years represents one of the most sustained precious metals rallies in modern financial history. The move from approximately $2,041 per ounce in January 2024 to levels above $5,000 reflects a compounding of macro pressures rather than any single catalyst.
| Period | Approximate Gold Price | Primary Driver |
|---|---|---|
| January 2024 | ~$2,041/oz | Early safe-haven accumulation |
| Late 2024 | ~$2,600 to $3,000/oz | Central bank demand surge |
| Early 2025 | ~$3,300/oz | Geopolitical escalation, USD softening |
| Early 2026 | ~$5,100 to $5,400/oz | Safe-haven inflows, sovereign asset diversification |
| Target (End of 2026) | $6,000/oz | Institutional consensus forecast |
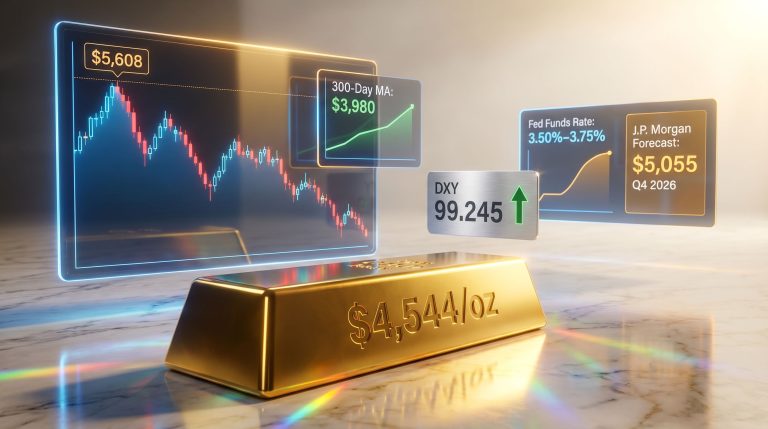
What makes this rally structurally distinct from previous cycles is that it persisted through a period of elevated interest rates, challenging one of the most commonly repeated assumptions about gold pricing. Rates remained around 3.75% throughout much of the move, while during gold's 1970s bull run, rates were running above 10%. The data from this cycle strongly suggests that when systemic risk factors dominate, the conventional interest rate sensitivity model for gold breaks down entirely. The gold price forecast for 2025 and beyond reflects this fundamental shift in how institutional investors are reading the macro environment.
The Five Structural Forces Driving Gold to $6,000
1. The Sovereign Debt Crisis: The Number Behind the Number
The U.S. national debt figure frequently cited in financial media, currently approaching $40 trillion, substantially understates the full scope of fiscal obligations. When unfunded liabilities including Social Security, Medicare, and pension obligations are incorporated, some fiscal analyses place total U.S. debt exposure above $140 trillion. This distinction matters enormously for gold investors because the price of gold has historically tracked not just current debt levels but the perceived trajectory of fiscal credibility over time.
Debt servicing costs alone have exceeded $1 trillion annually, consuming an increasing share of federal revenues and compressing the government's fiscal flexibility. Historically, every major sovereign debt crisis of the past century has been preceded by or coincided with a sustained precious metals bull market as investors sought assets outside the fiat monetary system.
The current situation arguably exceeds the structural severity of the 2008 Global Financial Crisis in terms of the depth of fiscal imbalance involved, given that the tools used to address 2008 — quantitative easing, near-zero rates, expanded government spending — have themselves contributed to the current debt load.
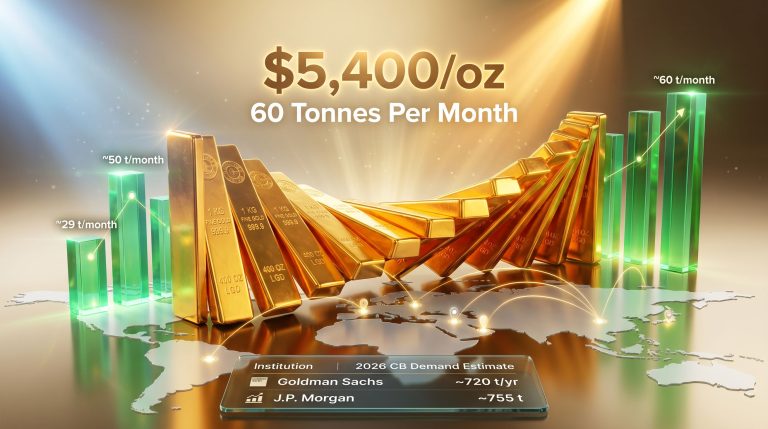
2. Central Bank Accumulation: The Institutional Signal Most Retail Investors Overlook
Central bank gold demand represents one of the most significant structural demand signals in the current market cycle, yet it receives far less attention than retail and ETF demand in mainstream financial coverage. The quarterly demand picture, when viewed comprehensively, illustrates the breadth of institutional conviction.
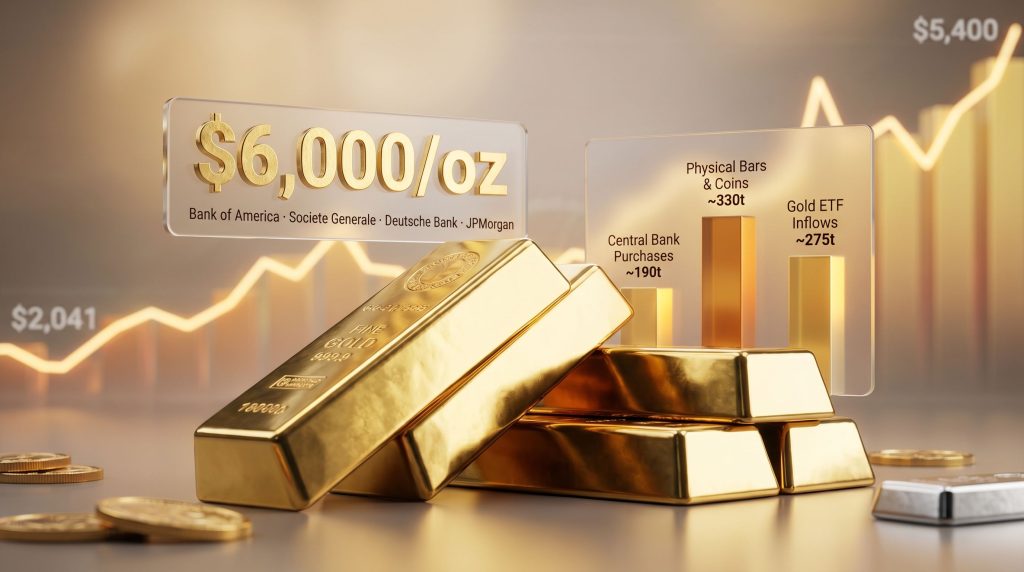
| Demand Category | Estimated Quarterly Volume |
|---|---|
| Central Bank Purchases | ~190 tonnes |
| Physical Bars and Coins | ~330 tonnes |
| Gold ETF Inflows | ~275 tonnes |
| Total Estimated | ~795 tonnes |
Emerging market central banks have been particularly active in diversifying away from U.S. Treasury holdings, a trend that reflects not just opportunistic diversification but a structural reassessment of reserve asset composition. ETF inflows have remained positive for eight consecutive weeks as of recent reporting periods, indicating that institutional participation extends well beyond central banks into managed funds and sovereign wealth vehicles.
JPMorgan's analysis suggests that a reallocation of just 0.5% of foreign-held U.S. assets into gold could generate 18% annualised returns given the constrained nature of new gold supply growth. Physical gold supply cannot be printed, expanded by policy decision, or created in response to demand surges. This supply inelasticity is a fundamental characteristic that differentiates gold from every fiat currency asset class.
3. Geopolitical Risk Premiums and the 1970s Template
There is a well-documented historical pattern in precious metals markets: sustained geopolitical instability drives more durable gold appreciation than short-term crisis events. The brief price spike during a single conflict event tends to reverse quickly. It is when geopolitical instability becomes a structural feature of the global environment, as was true during the late 1970s Iranian crisis and oil supply disruption period, that gold reprices at a fundamentally higher level.
The parallel to the late 1970s is not accidental. The Iranian geopolitical upheaval of that era, combined with oil supply disruption, created a template that many experienced trend analysts argue is repeating now. The intersection of Middle Eastern conflict, energy market disruption, and broader emerging market economic stress mirrors the structural conditions that launched gold's first major modern bull run, when prices rose from approximately $160 to $170 per ounce in the late 1970s to over $800 by January 1980.
Trend forecasting experience from that era demonstrated that the Iranian conflict created simultaneous upward pressure on both gold and oil, a pattern that has repeated in the current environment. Furthermore, the economic disruption from sustained conflict is now being characterised by multiple analysts as structurally more damaging than the 2008 Global Financial Crisis.
4. Dollar Weakness and the De-Dollarisation Dynamic
The U.S. dollar's movement to multi-year lows functions as a structural tailwind for gold pricing due to the longstanding inverse relationship between dollar confidence and gold demand. When the dollar weakens, gold becomes relatively cheaper for non-dollar buyers, expanding the effective global demand base. This reinforces gold's safe-haven appeal as investors worldwide seek assets that preserve purchasing power outside the fiat system.
An important nuance frequently missed in mainstream analysis involves distinguishing between different types of gold selling. Countries including Russia and Turkey have been liquidating portions of their gold reserves, not because gold has lost its appeal, but because their domestic currencies are weakening and gold provides the most liquid hard asset available to defend those currencies. This type of selling represents systemic economic pressure, not a bearish signal for gold's fundamental value.
Deutsche Bank's scenario analysis projects that non-dollar asset reallocation could push gold to between $6,000 and $6,900 per ounce, depending on the pace at which sovereign and institutional holders diversify away from U.S. dollar-denominated assets. The de-dollarisation trend is not a single event but a multi-year structural shift that provides ongoing demand support.
5. Equity Market Fragility and Institutional Deleveraging
The concentration of equity ownership in modern markets creates a systemic fragility that directly affects gold price dynamics in counterintuitive ways. Data indicates that three major asset managers — Vanguard, BlackRock, and State Street — collectively control approximately 25% of the S&P 500 by share count, and when broader corporate cross-holdings are analysed, the effective wealth concentration within those holdings approaches 88% of S&P 500 wealth. Additionally, the top 1% of wealth holders own approximately 54% of all equity market assets, with the top 10% controlling around 93%.
This extreme concentration creates a specific mechanism that temporarily suppresses gold prices during equity corrections. When hedge funds and private equity groups face redemption pressure as equity markets decline, leveraged positions across multiple asset classes including gold and silver are liquidated to cover losses. This was clearly observable in early 2025 when NASDAQ entered correction territory and precious metals experienced short-term price pressure despite no deterioration in underlying demand fundamentals.
Critically, these institutional deleveraging events have historically created accumulation opportunities rather than structural ceiling effects for gold prices. The price dislocations they produce tend to be temporary, followed by stronger recoveries once the forced selling cycle is complete. Support levels in the $5,250 to $5,300 range are currently identified by technical analysts as the key zone to watch during any correction periods.
What Major Financial Institutions Are Forecasting
The $6,000 per ounce target for gold is not a fringe or speculative projection. It represents the consensus view of multiple major global financial institutions, each arriving at the figure through distinct analytical methodologies. According to Yahoo Finance's expert analysis, this figure is increasingly treated as a base case rather than an optimistic outlier.
| Institution | Gold Price Target | Timeline | Primary Driver Cited |
|---|---|---|---|
| Bank of America | $6,000/oz | Spring 2026 | Sticky inflation, Fed rate cut expectations |
| Societe Generale | $6,000/oz (conservative case) | End of 2026 | Central bank buying, USD weakness |
| Deutsche Bank | $6,000 to $6,900/oz | 2026 | Non-dollar asset reallocation |
| JPMorgan | $6,000/oz | 2029 | Foreign asset diversification, supply constraints |
| Ed Yardeni (Yardeni Research) | $6,000/oz then $10,000/oz | 2026 then end of decade | Gold as monetary hedge, Bitcoin competition |
| India Bullion and Jewellers Association | Up to $6,000/oz | 2026 | U.S. debt trajectory, corrections of 12 to 15% en route |
The move from approximately $5,400 to $6,000 represents roughly an 11% gain from recent levels, a target that analysts characterise as achievable under sustained geopolitical stress and ongoing fiscal pressure rather than requiring any extraordinary acceleration of current trends.
The Legal Record on Precious Metals Market Manipulation
Any serious analysis of gold and silver markets must address the documented history of market intervention. JP Morgan reached a regulatory settlement exceeding $900 million related to precious metals market manipulation, a matter of verified public record. The strategies involved, including spoofing and layering in futures markets, create artificial price suppression windows that distort short-term price discovery.
The COMEX physical delivery mechanism has become an increasing subject of scrutiny among market participants, with growing debate about whether outstanding paper gold and silver contracts accurately reflect the physical metal available for delivery. This structural question carries significant implications for the long-term relationship between paper pricing and physical metal valuation.
For long-term gold investors, the practical implication of documented manipulation is that short-term price suppression episodes should be understood as characteristics of the market structure rather than signals of deteriorating fundamentals. Historical patterns consistently show that manipulation-driven price suppressions have created accumulation windows followed by stronger recoveries once artificial pressure is removed.
The Interest Rate Myth: What the Current Cycle Reveals
Conventional financial theory holds that rising interest rates suppress gold by increasing the opportunity cost of holding a non-yielding asset. This relationship dominated gold market analysis for decades. However, the current cycle has provided substantial evidence that this model is context-dependent and breaks down under specific macro conditions.
Gold's rise from $2,041 to above $5,000 occurred while U.S. interest rates remained around 3.75%, dramatically below the 10%+ rates that prevailed during the 1970s gold bull run. If the interest rate theory were robust, the current rate environment should have provided a significant headwind. Instead, gold outperformed.
The explanation lies in the hierarchy of market variables. When geopolitical instability and sovereign fiscal risk become the dominant forces shaping investor decision-making, gold's safe-haven premium overrides traditional interest rate sensitivity entirely. This is not an anomaly but a predictable outcome of systemic risk conditions that are structurally different from normal economic cycles.
The next major ASX story will hit our subscribers first
Silver's Position in the Precious Metals Cycle
Silver occupies a unique position as both a monetary metal and an industrial input, creating demand dynamics that are more complex than gold alone. Solar panel manufacturing, EV battery systems, and advanced electronics all require silver, providing an industrial demand floor that gold lacks.
The gold-silver ratio is widely used by experienced precious metals investors as a relative valuation tool. Historically, silver dramatically outperforms gold in the later stages of a bull cycle, catching up to and sometimes exceeding gold's percentage gains from trough to peak.
Key considerations for silver investors include:
- Physical silver versus ETF exposure involves meaningful differences in liquidity and counterparty risk
- COMEX silver inventory levels and the physical delivery debate may become increasingly significant as institutional demand grows
- Industrial demand from clean energy applications provides structural support that did not exist in previous precious metals cycles
- Silver's higher volatility relative to gold means it tends to correct more sharply during deleveraging events while also recovering more aggressively
Could Gold Reach $10,000 an Ounce by 2030?
The near-term institutional consensus around $6,000 per ounce is not the ceiling of the analytical conversation. Ed Yardeni of Yardeni Research has published a longer-term framework projecting gold at $10,000 per ounce by the end of the decade, contingent on continued U.S. fiscal deterioration and the expansion of gold's investor base as it increasingly competes with Bitcoin and other alternative stores of value.
The structural logic is straightforward. If the fiscal trajectory of major sovereign economies continues without meaningful consolidation, the case for gold to $6,000 an ounce — and beyond — strengthens progressively. Each year of additional unfunded liability accumulation, each additional trillion in debt servicing costs, and each further erosion of dollar confidence incrementally expands the pool of investors who turn to gold as a portfolio anchor. Furthermore, gold's evolving role in the monetary system suggests the structural tailwinds are unlikely to dissipate in the near term.
Scenarios that could derail or significantly moderate the bull thesis include:
- Meaningful geopolitical de-escalation reducing safe-haven premiums substantially
- Unexpected interest rate increases that significantly firm real yields
- Coordinated central bank gold selling at scale across multiple major holders
- A credible U.S. fiscal consolidation programme that restores meaningful confidence in dollar-denominated assets
Most analysts currently characterise these scenarios as low-probability in the near to medium term given the structural depth of the fiscal and geopolitical conditions in place.
Strategic Frameworks for Precious Metals Investors
Understanding the macro thesis is distinct from knowing how to position around it. Several investment frameworks have emerged from the current cycle that deserve careful consideration.
Physical gold and silver ownership remains the most direct expression of the store-of-value thesis, providing exposure to gold's monetary function without counterparty risk. Experienced investors including those who have held gold since prices were below $200 per ounce have demonstrated the power of long-term conviction through multiple volatility cycles.
Gold yield products represent an emerging innovation in the precious metals space. Structures now exist that allow gold holders to earn a yield denominated in physical gold rather than fiat currency, with some products offering up to 4% annual returns measured in physical ounces. This development addresses the traditional critique that gold produces no income, whilst keeping the holder's exposure in metal rather than paper promises.
Real assets broadly, including historically significant or supply-constrained real estate, function as complementary hard asset allocations. Locations with genuine historical scarcity of supply, rather than simply fashionable markets, tend to provide the most durable long-term value preservation characteristics.
Avoiding concentration risk within any thesis, even a structurally compelling one, remains essential. Bull markets in any asset class produce volatility and temporary corrections. The psychological durability to hold through those periods is as important as the initial analytical conviction.
Long-term wealth preservation strategies require more than financial positioning. They demand the psychological resilience to distinguish between temporary institutional deleveraging events and genuine fundamental deterioration, and to avoid reactive decision-making during periods of artificially suppressed prices.
Frequently Asked Questions: Gold Price Forecast to $6,000
What is the current gold price forecast for 2026?
Multiple major financial institutions, including Bank of America, Societe Generale, and Deutsche Bank, have published price targets of $6,000 per ounce by end of 2026, with Deutsche Bank projecting up to $6,900 under accelerated de-dollarisation scenarios.
Why is gold rising so rapidly in 2025 and 2026?
The primary drivers are central bank accumulation at historically elevated rates, U.S. dollar weakness, geopolitical risk premiums, sustained ETF inflows, and mounting concern about the long-term trajectory of U.S. fiscal obligations and total debt exposure.
Is gold a better investment than stocks currently?
This is entirely dependent on individual risk tolerance and time horizon. Gold has significantly outperformed major equity indices over the 2024 to 2026 period. However, asset allocation decisions should be made in consultation with a licensed financial adviser, as personal circumstances vary considerably.
Could gold go higher than $6,000?
Analysts including Ed Yardeni have published targets of $10,000 per ounce by end of decade, contingent on continued U.S. fiscal deterioration, sustained de-dollarisation, and gold's expanding role as an alternative monetary store of value.
Does interest rate policy still control gold prices?
Evidence from the current cycle strongly suggests that when systemic risk factors dominate — including geopolitical instability and sovereign debt concerns — gold's safe-haven premium overrides traditional interest rate sensitivity. Gold rose substantially during a period of elevated rates, directly challenging the conventional model.
What could cause gold prices to fall from current levels?
Potential headwinds include geopolitical de-escalation, unexpected fiscal consolidation, coordinated central bank selling, or a significant strengthening of the U.S. dollar. Most analysts currently view these as lower-probability scenarios given current structural conditions.
Disclaimer: This article is intended for informational and educational purposes only. It does not constitute financial advice. Past performance of any asset class is not indicative of future results. Readers should consult a licensed financial adviser before making any investment decisions. Price forecasts and institutional targets referenced reflect published analyst views and are subject to change based on evolving market conditions.
Ready to Capitalise on the Next Major ASX Mineral Discovery?
Discovery Alert's proprietary Discovery IQ model delivers real-time alerts on significant ASX mineral discoveries, instantly transforming complex data across 30+ commodities into actionable insights — giving subscribers a critical edge whether gold is the focus or any other resource sector. Explore Discovery Alert's dedicated discoveries page to understand how historic mineral discoveries have generated substantial market returns, and begin your 14-day free trial today to position yourself ahead of the broader market.