July 18, 2026

When Macro Logic Fails: Understanding the Gold Price Forecast Bottoming Process in Mid-2026
Precious metals markets have a well-documented tendency to confound investors at precisely the moments when the directional case appears most obvious. History is full of examples where gold rallied during periods of apparent calm and sold off during episodes of intense macro stress. What makes the current environment particularly instructive is not the direction of the price move itself, but the reason it is failing to respond as textbook analysis would predict.
Understanding the gold price forecast bottoming process underway in mid-2026 requires separating two distinct forces: the fundamentals, which remain broadly constructive, and the non-fundamental suppression dynamics that are currently overriding them. The gold price forecast for this period, furthermore, presents a uniquely complex picture that rewards careful structural analysis.
When big ASX news breaks, our subscribers know first
The Paradox at the Core of the Current Gold Market
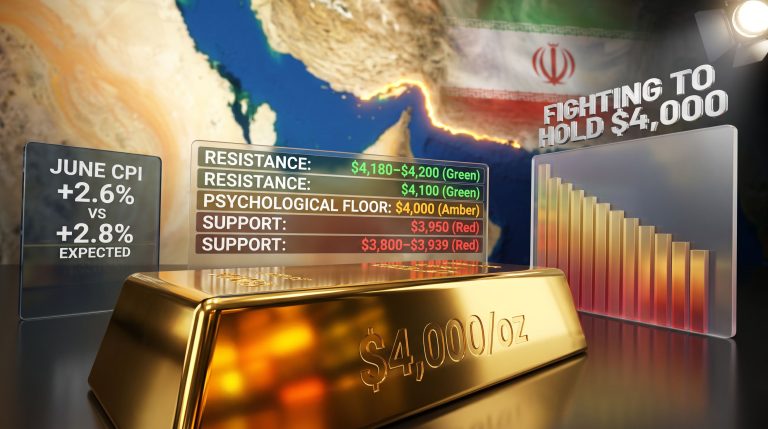
By almost every classical measure, the macro backdrop entering the second half of 2026 should be accelerating gold higher. The U.S. Dollar Index has been retesting key support near 100.35, and the June Consumer Price Index printed at -0.4%, a significant downside surprise that would historically be expected to push gold comfortably above $4,100 per ounce.
That move did not materialise. And the failure of gold to respond to those catalysts is analytically more important than the catalysts themselves.
When a historically bullish catalyst fails to produce an expected price response, it is often a signal that an external suppression force is temporarily overriding macro logic. Identifying that force, rather than assuming the fundamentals are wrong, is the critical first step in forecasting the timing of a reversal.
The most widely cited explanation for this disconnect is a renewed geopolitical risk premium associated with escalating Iran-related tensions. Geopolitical risk typically functions as a floor for gold prices. When it operates as a ceiling instead, it usually means that speculative positioning is unwinding even as long-term investors remain sidelined, creating a temporary but powerful downward force that macro data alone cannot offset.
This is the central paradox that defines the current gold price forecast bottoming process: deeply oversold conditions coexisting with continued downside pressure, despite a fundamentally supportive macro environment. In addition, the gold safe-haven dynamics that investors typically rely upon are behaving in ways that defy conventional expectations.
What Cycle Indicators Are Revealing About Gold's Positioning
The Significance of a Reading of 16
Cycle indicators in precious metals markets measure the degree to which price momentum has deviated from its long-term trend, providing a statistical gauge of how extreme selling or buying pressure has become relative to historical norms.
The Gold Cycle Indicator is currently reading 16, which represents the most deeply oversold condition recorded since late 2022. That context matters enormously for investors trying to assess where the gold price forecast bottoming process stands today.
What does a deeply oversold Gold Cycle Indicator mean? A reading at a multi-year extreme suggests that selling pressure has reached a statistically unusual level. Historically, such readings have preceded significant price recoveries, though the precise timing of the reversal requires confirmation from price structure, momentum signals, and volume behaviour.
The late 2022 cycle low is the most relevant historical comparator. At that point, gold was trading in the $1,620 to $1,680 range, the Dollar Index was elevated near 110 to 114, and the Federal Reserve was in the middle of one of its most aggressive tightening cycles in decades. Despite all of that bearish pressure, gold went on to rally more than 30% within 12 months of that oversold extreme.
The current setup is structurally different in one important way: the macro backdrop is already more constructive, yet prices are lower on a sentiment basis. That divergence between fundamentals and sentiment extremes is precisely what characterises the final stage of a corrective phase. According to JP Morgan's gold price analysis, structural demand drivers remain firmly intact despite near-term volatility.
Comparing Cycle Lows: 2022 vs. 2026
| Metric | Late 2022 Cycle Low | Mid-2026 Correction |
|---|---|---|
| Cycle Indicator Reading | ~15 to 18 | ~16 |
| USD Index Level | ~110 to 114 | ~100.35 to 100.50 |
| CPI Environment | Elevated / Hawkish Fed | Cooling / -0.4% print |
| Gold Price at Low | ~$1,620 to $1,680 | ~$3,900 (key support) |
| Subsequent Rally | +30% within 12 months | Scenario dependent |
A secondary technical signal reinforcing the cycle indicator reading is the emergence of MACD positive divergence across gold mining equity indices. This condition, where price continues to make new lows while momentum indicators stop following, is one of the most reliable early warnings that a trend is approaching exhaustion. Its appearance in senior miner indices like the GDX is particularly significant because mining equities have historically led the physical metal at major cycle turning points.
The $3,900 Level and the Three-Scenario Framework
Why This Price Level Functions as a Strategic Dividing Line
The $3,900 per ounce level is not simply a round number. It represents the structural boundary between the primary bottoming scenario and a more extended corrective sequence. Technical analysis of the current correction, which began in early 2026, suggests the decline is approximately 95% complete based on cycle modelling. However, that final 5% carries binary implications.
Three distinct scenarios emerge from this framework, each with different trigger conditions, targets, and probability assessments.
Scenario A: Base Case Bottom Near $3,850 to $3,900
This remains the primary scenario. For it to remain valid, gold must hold the $3,900 level on a closing basis for more than three consecutive trading sessions. A confirmed base in this zone opens a technical recovery pathway toward $4,100 to $4,180 resistance. Cycle analysis points to a low forming in the late July to early August 2026 window. Confirmation signals to watch include reversal candlestick patterns, volume expansion on up-days, and a turn higher in the cycle indicator from its current reading.
Scenario B: Extended Correction Toward $3,500 to $3,600
This scenario is activated by a sustained close below $3,900 for more than three trading days. Intermediate support within this scenario sits near $3,700, with the final target zone at $3,500 to $3,600. Macro catalysts capable of accelerating this decline include a USD stabilisation above 101.20, broader equity market risk-off selling, or a further escalation of geopolitical tension redirecting safe-haven flows away from gold. Under this scenario, silver could be temporarily pulled toward $45.00. Despite current weakness, this remains the minority probability outcome.
Scenario C: Immediate Reversal and Bull Continuation
This aspirational scenario requires a sustained USD breakdown below 100.35, a meaningful unwinding of the geopolitical risk premium, and a cycle indicator reversal from current lows. Near-term targets under this scenario include a challenge of $4,180, with institutional price forecasts for year-end 2026 pointing toward $4,900 to $6,300.
Scenario Summary
| Scenario | Trigger Condition | Near-Term Target | Probability Assessment |
|---|---|---|---|
| A: Base Case Bottom | Holds $3,900 for 3+ days | $4,100 to $4,180 | Primary |
| B: Extended Correction | Closes below $3,900 for 3+ days | $3,500 to $3,600 | Secondary |
| C: Immediate Bull Reversal | USD breaks 100.35, geopolitical de-escalation | $4,900+ | Aspirational |
Dollar Dynamics and the CPI Disconnect
How the USD Functions as a Gating Mechanism for Gold Recovery
The inverse relationship between the U.S. Dollar and gold is well established, but it is not mechanical. There are periods, particularly during geopolitically driven corrections, where dollar weakness alone is insufficient to unlock gold's upside potential.
Two key USD thresholds define the current environment:
- 100.35: The recent intraday low. A sustained breakdown below this level would remove a structural headwind for gold and likely accelerate the bottoming process.
- 101.20: Short-term trendline resistance. A breakout above this level would add meaningful downward pressure on the entire precious metals complex.
The analytical significance of the June CPI print cannot be overstated. A -0.4% monthly CPI reading represents a substantial downside surprise by historical standards. Under normal cycle conditions, such a print combined with dollar weakness would be expected to generate a gold rally of 1 to 2% or more. The fact that gold failed to sustain a move above $4,100 despite these conditions points directly to the presence of an overriding suppression force.
Three structural explanations account for this disconnect:
- Geopolitical risk premium compression: Iran-related tensions are redirecting safe-haven flows in ways that temporarily suppress gold's traditional inflation-hedge response.
- Positioning overhang: Speculative long positions accumulated during the first half of 2026 are being unwound, creating selling pressure that fundamental data alone cannot reverse.
- Cycle timing: The market structure may require one final flush toward or below $3,900 before institutional buyers re-engage at scale.
Cross-Asset Analysis: What the Full Precious Metals Complex Is Signalling
Silver: Approaching Structural Support With Asymmetric Risk
Silver is posting fresh July lows and testing the lower boundary of its technical target zone. Three support levels define the risk landscape:
- $54.00: Immediate support. A decisive close below this level triggers a retest of $50.00.
- $49.50: The major long-term breakout retest zone. This area represents a historically significant structural level where long-term investors have previously re-entered the market.
- $45.00: Worst-case scenario, aligned with gold's alternate $3,500 to $3,600 downside target.
The gold-silver ratio is also sending notable signals during this corrective phase, providing additional context for assessing relative value across the precious metals complex.
For long-term precious metals investors, a silver price near $49.50 to $50.00, should it be reached, would represent a retest of a major multi-year breakout level. Historically, such retests offer asymmetric upside potential relative to downside risk. The expectation based on structural analysis is that prices would not remain below $50.00 for more than a few days.
Platinum: The Relative Strength Signal
Platinum is holding up noticeably better than both gold and silver during the current corrective phase. This relative outperformance carries informational value: it suggests that industrial demand considerations are providing a partial floor that pure financial sentiment is not offering to the other metals.
- $1,700: A series of progressive closes above this level would provide meaningful confirmation that a bottom is forming.
- $1,500: Major structural support if broader precious metals weakness deepens.
Gold Mining Equities: Leading Indicators at Cycle Turns
Mining equities are among the most sensitive leading indicators available in the precious metals complex. They typically price in directional changes in gold before the physical metal itself moves, making their current technical setup particularly relevant. The relationship between gold and mining equities at cycle turning points is consequently one of the most closely watched dynamics by institutional analysts.
Senior Miners (GDX)
- Posted fresh lows below the lower end of the target zone
- Next major support: $68.00
- MACD positive divergence is present, a condition historically associated with trend exhaustion at cycle lows
Junior Miners (GDXJ)
- Approaching the lower boundary of the ideal target zone
- Final support: $85.00 if the decline extends further
- Key confirmation signal: a reversal candle (hammer or bullish engulfing) on elevated volume
Silver Junior Miners (SILJ)
- Trading within the target zone while approaching the end of the expected timing window
- Final major support: $21.00
- The convergence of price support and cycle timing creates a well-defined risk window
Cross-Asset Comparison
| Asset | Current Status | Key Support Level | Confirmation Signal |
|---|---|---|---|
| Gold | Testing $3,900 | $3,900 / $3,500 to $3,600 | Hold above $3,900 for 3+ days |
| Silver | Fresh July lows | $54.00 / $49.50 | Hold above $54.00 |
| Platinum | Relative outperformer | $1,500 | Progressive closes above $1,700 |
| GDX (Senior Miners) | Below target zone | $68.00 | MACD divergence + reversal candle |
| GDXJ (Junior Miners) | Near lower target | $85.00 | Reversal candle on volume |
| SILJ (Silver Juniors) | Within target zone | $21.00 | Cycle timing window confluence |
The next major ASX story will hit our subscribers first
Institutional Forecasts and the Multi-Year Bull Market Context
Separating Short-Term Tactical Risk From Structural Opportunity
The current corrective phase must be assessed within the broader context of a multi-year structural bull market that technical analysis suggests extends well beyond 2026. The correction that began in early 2026 is estimated to be approximately 95% complete based on cycle modelling, which means the bulk of the downside risk has already been absorbed.
Furthermore, central bank demand continues to provide a powerful structural floor, with sovereign reserve diversification accelerating across multiple emerging market economies. Institutional forecasters maintain firmly bullish structural views on gold for the remainder of 2026 and beyond:
| Institution | 2026 Year-End Gold Target | Primary Driver |
|---|---|---|
| Goldman Sachs | ~$4,900 | Central bank reserve diversification |
| J.P. Morgan | $6,000 to $6,300 | Structural bull market continuation |
| TD Securities | Brief dip below $3,900, then recovery | Corrective phase completion |
| Long-Term Technical View | $10,000+ (toward 2030) | Multi-year bull cycle |
The structural anchor for these long-term projections is the accelerating trend of central bank diversification away from USD-denominated reserves. As more sovereign entities rotate a portion of their reserve holdings into physical gold, the demand base becomes less sensitive to short-term speculative positioning swings. This dynamic underpins the long-term scenario of gold eventually surpassing $10,000 and silver exceeding $300 within a multi-year timeframe extending toward 2030. The World Gold Council's 2026 outlook similarly highlights structural demand forces as the primary driver of sustained price appreciation.
Disclaimer: Long-term price projections from institutional forecasters and technical analysts involve significant uncertainty and should not be interpreted as guaranteed outcomes. All forecasts are speculative in nature and subject to revision based on changing macro, geopolitical, and market conditions.
Extreme Bearish Sentiment as a Contrarian Indicator
The Market Psychology of Cycle Lows
One of the most consistently misunderstood dynamics in commodity markets is the relationship between sentiment extremes and price turning points. The natural human tendency is to extrapolate recent trends indefinitely, which means that bearish sentiment typically reaches its greatest intensity precisely when a cycle low is approaching, not when it has already passed.
The distinction between fundamental bearishness (where underlying macro conditions are genuinely deteriorating) and sentiment bearishness (where fear-driven selling at cycle lows temporarily overwhelms structural demand) is critical. The current environment exhibits the hallmarks of the latter: oversold cycle indicators, MACD divergence in leading indicators, macro conditions that would historically be bullish, and institutional price targets that remain far above current trading levels.
A Step-by-Step Framework for Identifying the Gold Price Bottom
Investors seeking a systematic approach to confirming the end of the current corrective phase should monitor the following sequence:
- Track the $3,900 support level on a closing basis across multiple consecutive sessions.
- Monitor USD price action for a sustained breakdown below 100.35, which would remove a primary headwind.
- Observe the Gold Cycle Indicator direction for a turn higher from the current reading of 16.
- Watch for MACD divergence confirmation in GDX, as mining equities historically lead the physical metal at cycle turns.
- Look for reversal candle patterns in GDXJ and SILJ with volume confirmation.
- Track geopolitical risk headlines related to Iran, as a meaningful de-escalation could rapidly remove the current suppression force.
- Assess silver's $54.00 level for a confirmed hold, which would signal broad precious metals support remains structurally intact.
Frequently Asked Questions: Gold Price Forecast and the Bottoming Process
What does the gold price forecast bottoming process mean in technical analysis?
A bottoming process refers to the transitional period during which a declining asset shifts from an established downtrend into base-building behaviour before a new uptrend begins. It typically involves multiple support tests, extreme sentiment readings, and technical divergences that precede a confirmed directional reversal.
How long does a gold bottoming process typically take?
Historical precedents vary considerably, ranging from several weeks to multiple months depending on the depth of the preceding correction and the macro environment. Cycle analysis applied to the current correction points to a resolution window in late July to early August 2026.
Why did gold fail to rally on the weak June CPI data?
The failure of gold to respond to a -0.4% CPI print and simultaneous dollar weakness is interpreted as evidence of a non-fundamental suppression force, most likely geopolitical risk premium associated with Iran-related tensions, that is temporarily overriding macro tailwinds.
What is the most critical support level for gold right now?
$3,900 per ounce is the primary near-term support. A sustained close below this level for more than three consecutive trading sessions would activate the alternate downside scenario targeting $3,500 to $3,600.
Is silver presenting a long-term opportunity during the current correction?
Silver's proximity to major structural support near $49.50 to $54.00 creates a defined risk-to-reward setup for long-term investors. However, confirmation that gold has completed its corrective phase is advisable before assuming silver has also established its final low.
Positioning for What Comes After the Bottom
Patience as a Strategic Asset in the Final Phase of a Major Correction
The three-scenario framework outlined above converges on a consistent conclusion: the structural bull market in gold remains intact, the corrective phase is approaching its terminal stage, and the conditions most consistent with a high-value entry point are those that feel most uncomfortable to investors navigating them in real time.
Cycle indicators at multi-year extremes, MACD divergence in leading mining equity indices, maximum bearish sentiment, and macro conditions that are already supportive but not yet reflected in price: these are the conditions that historically precede the most rewarding phases of a bull market, not the conditions that precede prolonged bear markets.
The $3,900 support level remains the near-term tactical dividing line. For investors focused on the multi-year trajectory toward institutional targets of $4,900 to $6,300 by year-end 2026 and the longer-term technical case for gold above $10,000, the current gold price forecast bottoming process is best understood as a pause within a larger structural advance, not a fundamental reversal of trend.
Markets characteristically bottom when fear reaches its peak, not when confidence begins to return. The current data suggests that peak may be close.
This article is for informational purposes only and does not constitute financial advice. All price targets, cycle analysis, and institutional forecasts involve uncertainty and should not be relied upon as the sole basis for investment decisions. Past performance of technical indicators is not a guarantee of future results.
Want to Capitalise on the Next Major Mineral Discovery Before the Broader Market Reacts?
While gold's structural bull market continues to unfold, Discovery Alert's proprietary Discovery IQ model delivers real-time alerts on significant ASX mineral discoveries — instantly translating complex data into actionable opportunities for investors at every level. Explore historic discoveries and the exceptional returns they generated, then begin your 14-day free trial at Discovery Alert to position yourself ahead of the market.