July 17, 2026
The Machinery Behind Gold's Price: Understanding What Institutional Models Are Actually Telling Us
Commodity markets have a well-documented tendency to punish investors who mistake short-term price signals for long-term structural shifts. In few markets is this tension more acute than in gold, where cyclical corrections driven by macro variables regularly obscure the deeper demand architecture that underpins the metal's role as a global monetary anchor. The current environment in mid-2026 is a textbook example of this phenomenon: headlines point to a notable price pullback, yet institutional desks are refining, rather than abandoning, their bullish gold price forecast frameworks.
Understanding why requires moving beyond spot price movements and into the mechanics of what actually drives gold over multi-year cycles, where monetary policy transmission, central bank reserve strategy, geopolitical risk premiums, and investor positioning interact in ways that rarely resolve quickly or cleanly.
When big ASX news breaks, our subscribers know first
Where Gold Stands Right Now: Reading the Current Market Configuration
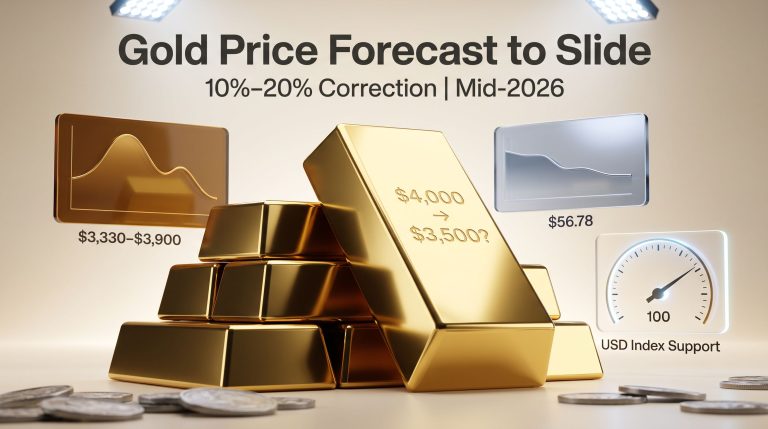
As of mid-May 2026, gold futures on the micro contract are trading near $4,713 per ounce, with spot gold approximating $4,550/oz. These figures represent a meaningful retreat from earlier 2026 highs, with the metal having declined roughly 14% since late February, when the onset of the US-Iran conflict on February 28 introduced a set of macro forces that have proven more disruptive to gold pricing than the initial safe-haven narrative suggested.
The reasons for this are interconnected and worth unpacking in detail:
- Rising crude oil prices, with Brent now trading near $104 per barrel, have amplified inflation expectations across markets.
- Elevated inflation expectations have reinforced Federal Reserve hawkishness, keeping rate cut expectations subdued.
- A stronger US dollar, partially driven by safe-haven capital flows of its own, has reduced gold's relative attractiveness to international buyers.
- Non-yielding assets like gold face higher opportunity costs when real yields remain elevated.
What makes the current configuration technically interesting is that the near-term resistance level sits at approximately $4,698/oz, with the bullish breakout scenario pointing toward $5,107/oz if buying momentum re-emerges. The divergence between where gold is trading and where major institutional models project it to be by year-end defines the central tension in the current gold price forecast debate.
| Metric | Level |
|---|---|
| Gold Futures (Micro) | ~$4,713/oz |
| Spot Gold (approximate) | ~$4,550/oz |
| Decline since Feb 28 conflict onset | ~14% |
| Near-term technical resistance | ~$4,698/oz |
| Bullish technical upside target | ~$5,107/oz |
What Major Banks Are Projecting: A Cross-Institutional View
JPMorgan's Revised Outlook
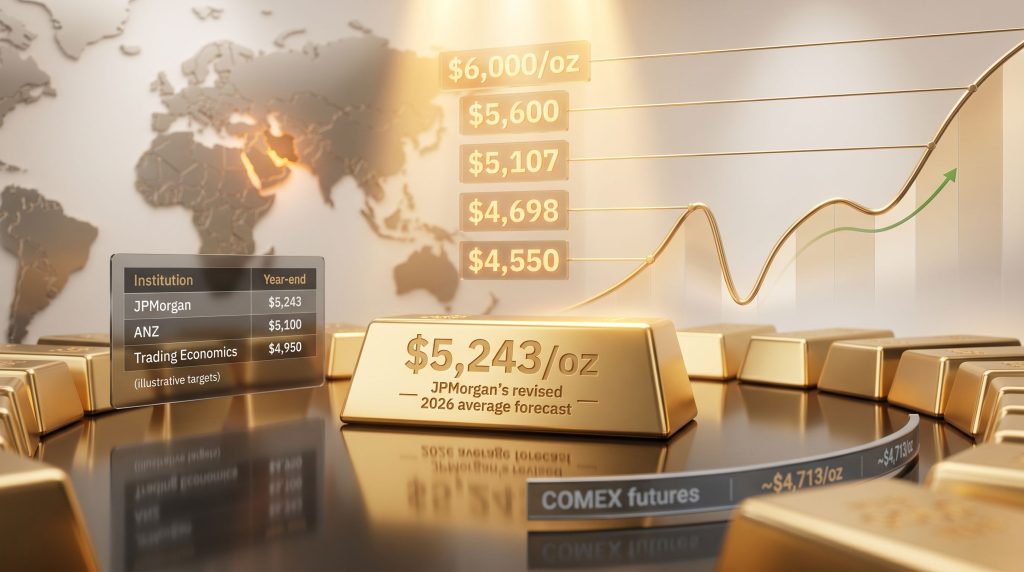
JPMorgan made a significant revision to its gold price forecast, cutting its 2026 annual average estimate to $5,243 per ounce from a prior projection of $5,708. The bank's Q4 2026 target was revised to approximately $5,055/oz, with an end-2027 projection near $5,400/oz.
The revision was not a withdrawal of conviction but rather an acknowledgment of near-term demand fatigue. The bank's analysts noted that COMEX aggregate gold futures open interest and trading volume have remained depressed, net Managed Money futures positioning has stagnated at low levels, and ETF flows have reduced to minimal activity. In plain terms, the institutional and retail investors who drove gold's earlier rally have stepped back, and that absence is showing up directly in price momentum indicators.
Despite the downgrade, JPMorgan maintained that once the current wave of energy and inflation uncertainty clears, investor and central bank demand is expected to re-intensify through the second half of 2026, with a medium-term price target extending toward the $6,000/oz level by year-end.
ANZ and Other Institutional Perspectives
ANZ revised its year-end 2026 gold target to $5,600/oz, citing inflation expectations, elevated bond yields, and dollar resilience as the primary near-term headwinds. Furthermore, the gold market outlook from Trading Economics' model-based framework produces more conservative estimates: a quarter-end projection of $4,596/oz and a 12-month forward estimate of $4,949/oz.
| Institution | Near-Term Stance | Year-End 2026 Target |
|---|---|---|
| JPMorgan | Soft demand, H2 recovery expected | ~$5,055 to $6,000/oz |
| ANZ | Yield and dollar headwinds | ~$5,600/oz |
| Trading Economics | Model-driven conservative | ~$4,950/oz |
| CoinCodex | Bearish momentum | ~$3,995/oz |
| LiteFinance | Range-bound, volatile | $4,698 to $5,107/oz |
The breadth of institutional forecasts across a range spanning nearly $2,000 per ounce is itself an important data point. It reflects genuine macro uncertainty rather than analytical disagreement, and signals that the gold price forecast outcome in 2026 will be highly sensitive to a small number of critical macro variables, particularly Federal Reserve rate decisions and the evolution of the US-Iran conflict.
The Mechanics of the Current Correction: Why Gold Fell When It Should Have Risen
One of the more counterintuitive dynamics in the current gold market is that a geopolitical conflict, traditionally a safe-haven gold demand catalyst, has actually coincided with a meaningful price decline. Understanding why requires a more granular look at the transmission channels involved.
The US-Iran conflict that began in late February 2026 triggered a sharp rise in crude oil prices. That energy price spike fed directly into global inflation expectations, prompting bond markets to reprice the Federal Reserve's rate path upward. Higher expected rates translate into higher real yields, and higher real yields increase the opportunity cost of holding gold, which generates no income.
Simultaneously, dollar strength driven by both safe-haven flows and rate differentials made gold more expensive for non-dollar buyers, compressing demand from emerging market purchasers. The net result: the inflationary channel dominated the safe-haven channel in the short term, a dynamic that historical precedent suggests is typically temporary.
Lessons From Past Geopolitical Shocks
This is not the first time gold has fallen in the immediate aftermath of a geopolitical escalation:
- Gulf War (1990–91): Gold spiked initially on the Iraqi invasion of Kuwait, then corrected sharply as US dollar strength and eventual conflict resolution reduced the risk premium.
- Post-September 11 (2001): Gold rallied briefly before a multi-month consolidation period, then began a sustained bull market as the macroeconomic consequences of the conflict became clear.
- Russia-Ukraine conflict (2022): Gold surged to near-record levels in March 2022, then retreated significantly as the Federal Reserve's aggressive rate hiking cycle dominated price dynamics.
The consistent pattern across these episodes is that when rate and dollar forces dominate, gold underperforms safe-haven expectations in the short term. When those rate pressures eventually ease, gold tends to recover with considerable momentum. This historical context forms the backbone of the institutional argument that the current correction is cyclical, not structural.
The Long-Term Demand Architecture: Why Structural Bulls Remain Unconvinced by the Dip
Central Bank Accumulation as a Persistent Demand Floor
One of the most significant, and often underappreciated, structural forces in the gold market is the sustained accumulation programme being conducted by central banks, particularly across emerging market economies. Unlike retail or institutional investor demand, which can evaporate quickly in response to rate or dollar moves, central bank gold demand is driven by reserve diversification strategy and operates on multi-year mandates.
Several dynamics make this structural demand particularly resilient:
- Central banks in countries such as China, India, Turkey, and across Southeast Asia have been systematically reducing their US dollar reserve exposure and substituting gold as a neutral, non-sanctionable reserve asset.
- This de-dollarisation trend was significantly accelerated by the 2022 freezing of Russian central bank reserves, which demonstrated to non-Western central banks the geopolitical risk embedded in dollar-denominated reserve holdings.
- Gold's property as a reserve asset that carries no counterparty risk makes it uniquely valuable in a multipolar geopolitical environment.
JPMorgan explicitly identifies ongoing central bank demand as a central pillar of its medium-term bullish thesis, and this is a view broadly shared across institutional analysis. Crucially, this demand baseline exists independent of the ETF flows and COMEX positioning metrics that are currently depressed.
The Inflation Cycle and Gold's Historical Resolution
A lesser-appreciated nuance in the current debate is that inflation, while currently acting as a headwind for gold through the rate expectations channel, has historically resolved in gold's favour once rate cycles turn. The gold and bond dynamics at play follow a familiar mechanism:
- Inflation rises, prompting central bank rate hikes.
- Rate hikes increase the opportunity cost of gold, causing short-term price weakness.
- Eventually, rate hikes slow economic growth and inflation moderates.
- Central banks pivot to rate cuts, real yields fall, and gold re-prices sharply higher.
This cycle has played out multiple times across the past five decades. The critical question for gold investors in mid-2026 is not whether this cycle will repeat, but when the pivot occurs and how rapidly gold demand re-accelerates in response.
Bullish vs. Bearish Scenarios: A Structured Risk Framework
The Bull Case
- The Federal Reserve signals or delivers rate cuts in H2 2026 as inflation moderates.
- The US dollar weakens as global growth rebalances and yield differentials narrow.
- Central bank gold buying continues at elevated pace, providing a structural price floor.
- Geopolitical risk premium sustains safe-haven interest as the US-Iran conflict drags on.
- ETF inflows return at scale as institutional investors re-engage.
- Target range: $5,400 to $6,000/oz by year-end 2026 through 2027.
The Bear Case
- The Federal Reserve holds rates above 5% through year-end due to persistent energy-driven inflation.
- Dollar strength persists, continuing to suppress international gold demand.
- Geopolitical tensions de-escalate, eliminating the conflict risk premium from pricing.
- ETF and futures outflows continue, extending the current demand trough.
- Risk scenario: $3,995 to $4,596/oz through year-end 2026.
The most important variable separating these two outcomes is not a gold-specific factor. It is the trajectory of US monetary policy. Investors tracking the gold price forecast should monitor Federal Reserve meeting statements, US CPI data releases, COMEX net positioning reports, and ETF flow data as the leading indicators most likely to signal which scenario is gaining traction. For up-to-date commodity data, Trading Economics provides a useful live reference point.
The next major ASX story will hit our subscribers first
Short-Term Technical Structure: Key Price Levels to Monitor
| Price Level | Significance |
|---|---|
| ~$4,550/oz | Current approximate spot price |
| ~$4,596/oz | Quarter-end model estimate (Trading Economics) |
| ~$4,698/oz | Near-term technical resistance |
| ~$4,950/oz | 12-month forward model target |
| ~$5,107/oz | Bullish technical breakout scenario |
| ~$5,243/oz | JPMorgan revised 2026 annual average |
| ~$5,600/oz | ANZ year-end 2026 target |
| ~$6,000/oz | JPMorgan medium-term recovery target |
Technical analysis and fundamental valuation models can and regularly do diverge over short time horizons. The current COMEX positioning data, with stagnant open interest and depressed managed money participation, reflects investor fatigue rather than a fundamental re-rating of gold's value. Institutional analysts broadly characterise this as a cyclical demand pause within a longer bull market structure, not a signal that the structural case for gold has deteriorated.
The Three Scenarios for Gold Through 2026: A Decision Framework for Investors
Scenario 1: Base Case (Most Probable)
Inflation moderates gradually through H2 2026, the Federal Reserve signals a shift toward easing, and gold recovers steadily to the $5,000 to $5,400/oz range by year-end. Central bank buying provides a consistent demand floor throughout the correction period.
Scenario 2: Bull Case
A faster-than-expected Federal Reserve pivot, combined with renewed institutional investor participation and sustained geopolitical risk premium, pushes gold toward $5,600 to $6,000/oz. ETF inflows return at scale, amplifying the price recovery.
Scenario 3: Bear Case
Persistent energy-driven inflation forces the Federal Reserve to hold rates well above 5% through year-end. Dollar strength continues to suppress demand, ETF outflows extend the current trough, and gold consolidates in the $3,995 to $4,596/oz range through December 2026.
| Timeframe | Forecast Range | Key Condition |
|---|---|---|
| Near-term (0 to 3 months) | $4,550 to $4,698/oz | Rate-sensitive, volatile |
| Mid-term Q4 2026 | $4,950 to $5,243/oz | H2 demand recovery needed |
| Year-end 2026 | $5,243 to $5,600/oz | Fed clarity, inflation moderation |
| End-2027 | $5,400/oz and above | Central bank demand sustained |
| Bullish outlier | $6,000/oz and above | Full macro tailwind scenario |
Frequently Asked Questions: Gold Price Forecast 2026
What is the consensus gold price forecast for year-end 2026?
Most institutional forecasts for year-end 2026 cluster in the $4,950 to $5,600/oz range. JPMorgan targets approximately $5,243/oz as an annual average with a potential recovery toward $6,000/oz, while ANZ's year-end target sits at $5,600/oz. More conservative model-based projections from Trading Economics suggest a 12-month forward level near $4,950/oz, while bearish outlier models point to a possible consolidation around $3,995/oz. For additional model-driven projections, CoinCodex's precious metals forecasts offer a complementary perspective.
Why has gold fallen despite the geopolitical conflict providing safe-haven support?
The approximately 14% decline since February 28 reflects the dominance of the inflation-and-rate channel over the safe-haven channel. Rising oil prices from the US-Iran conflict have inflamed inflation expectations, pushed bond yields higher, and strengthened the US dollar, all of which create short-term headwinds that have outweighed the traditional flight-to-safety bid. This dynamic is historically common in the early stages of energy-driven geopolitical shocks.
Is central bank demand still a meaningful price support?
Yes, and it may be the most structurally important demand factor operating in the gold market today. Central banks, particularly those in emerging economies pursuing reserve diversification away from dollar-denominated assets, continue accumulating gold at elevated rates. This demand operates independently of retail and ETF flows and provides a baseline that helps limit downside even during cyclical corrections.
What would be required for gold to reach $6,000/oz?
A convergence of multiple macro tailwinds would be needed: a clear Federal Reserve rate-cutting cycle, meaningful US dollar depreciation, sustained geopolitical risk premium from the US-Iran conflict or other flashpoints, and a return of institutional investor flows into gold ETFs and COMEX futures. JPMorgan's medium-term bullish framework identifies this as a plausible but conditions-dependent outcome.
What are the primary risks to a gold recovery in H2 2026?
The key risks are a higher-for-longer Federal Reserve policy stance, sustained US dollar strength, geopolitical de-escalation reducing the risk premium, and continued outflows from gold-backed investment vehicles. Any combination of these factors extending into Q3 and Q4 2026 would challenge the institutional consensus on a demand recovery.
This article contains forward-looking statements and price projections sourced from institutional research and model-based forecasting. All forecasts involve inherent uncertainty and should not be construed as investment advice. Past price performance and historical parallels do not guarantee future outcomes. Readers should conduct independent research and consult qualified financial advisers before making investment decisions.
For ongoing coverage of gold market dynamics and institutional price forecasting, Mining.com provides regularly updated commodity market analysis and precious metals commentary.
Want to Track the Next Major ASX Gold Discovery Before the Market Does?
Discovery Alert's proprietary Discovery IQ model delivers real-time alerts on significant ASX mineral discoveries, instantly translating complex geological data into actionable investment insights — no matter where gold's price cycle stands. Explore how historic mineral discoveries have generated extraordinary returns on Discovery Alert's dedicated discoveries page, and begin your 14-day free trial to position yourself ahead of the broader market.