July 18, 2026
Understanding the Current Precious Metals Correction Within a Longer Bull Cycle
Cyclical corrections within long-term bull markets are among the most psychologically challenging environments for investors to navigate. Prices pull back sharply, sentiment deteriorates, and short-term noise begins to drown out longer-term structural signals. This is precisely the dynamic unfolding across precious metals markets in mid-2026, where the gold price forecast and COMEX August rollover are both commanding urgent attention from traders and long-term investors alike. Understanding why these corrections occur, how deep they are likely to run, and what mechanics are currently influencing short-term price action is essential for anyone positioned in this space.
When big ASX news breaks, our subscribers know first
Gold Price Forecast: Where Does the Metal Stand Right Now?
The Scale of the Correction in Context
Gold's retreat from its peak near $4,500 in January 2026 has been significant in nominal terms, but it looks very different when measured against the broader trajectory of this bull market. As of July 17, 2026, gold has traded as low as $3,963 intraday, having broken briefly below the psychologically critical $4,000 level.
For context, consider where gold was trading just two years ago. Between 2019 and 2024, gold was largely confined to a $1,600 to $2,100 trading band. The breakout above $2,500 that materialised by early 2025 was already considered historically significant. The subsequent surge to $4,500 by January 2026 compressed several years of expected appreciation into a very short window.
The current correction, therefore, is occurring at price levels that would have appeared as extreme upside scenarios to most analysts as recently as mid-2024. This framing matters enormously for how investors should interpret the current weakness. Furthermore, our gold price forecast analysis confirms that structural drivers remain firmly intact despite near-term turbulence.
The current gold pullback is not occurring from a position of structural weakness. It is a correction embedded within one of the most powerful and sustained precious metals repricing events in modern market history.
A Short-Term Trade Target Already Achieved
A near-term sell signal was issued with a downside target of $3,975, which was reached on July 16, 2026. The price subsequently extended lower to $3,963 the following morning. The near-term technical picture points to continued softness, with $3,800 identified as the primary support zone across multiple analytical frameworks.
A smaller cohort of analysts has projected a more aggressive downside scenario toward $3,500, but this view is not well-supported by the current fundamental backdrop. The geopolitical and macroeconomic conditions driving investment demand for gold since 2019 remain firmly, and increasingly, in place.
What Is the COMEX August Rollover and Why Does It Matter Right Now?
How COMEX Futures Contracts Work
The COMEX futures market operates on a monthly contract cycle. At any given time, one contract month carries the highest trading volume and performs the primary price discovery function. This is known as the front-month contract. As a contract approaches its expiry date, traders holding open positions face a binary choice: roll their position forward into a later-dated contract, or face potential physical delivery obligations.
Physical delivery on a COMEX gold contract means accepting or making delivery of actual gold bars meeting exchange specifications — something the vast majority of financial traders have no intention of doing. Rolling forward is the standard institutional response. For live pricing data and contract specifications, CME Group's gold futures platform provides a comprehensive reference for active traders.
The August 2026 Open Interest Situation
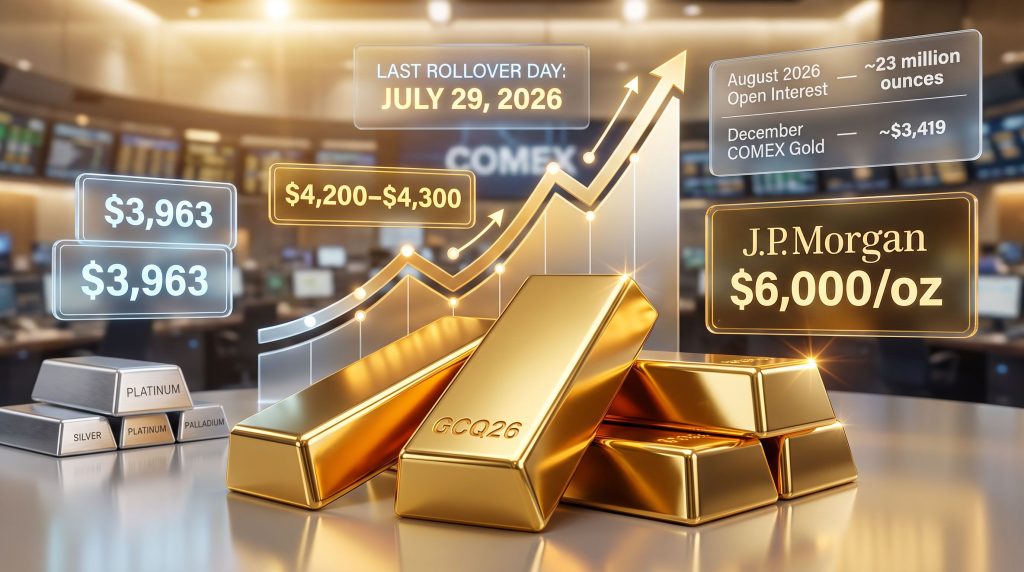
The last rollover day for the COMEX August 2026 gold futures contract (ticker: GCQ26) falls on July 29, 2026. As of mid-July, this contract still carried approximately 23 million ounces of open interest, an unusually large figure that has significant short-term implications for gold price behaviour.
| Metric | Detail |
|---|---|
| August 2026 Open Interest (mid-July) | ~23 million ounces |
| Primary Roll Destinations | October 2026 and December 2026 |
| Dominant Roll Direction | Majority rolling into December 2026 |
| Last Rollover Day | July 29, 2026 |
| Physical Delivery Risk | Low; rollovers proceeding normally |
| December COMEX Gold Price | ~$3,419 (recent reference) |
The Mechanical Price Support Effect
Here is the mechanic most retail investors overlook: when traders holding short positions in the August contract roll forward, they must first buy back their August short positions before selling into a later contract month. With 23 million ounces of open interest still active, this creates a meaningful, if temporary, wave of buying pressure on the front-month contract.
This mechanical dynamic is estimated to be capable of temporarily stabilising or lifting gold prices toward $4,200 to $4,300 on an ultra-short-term basis before the broader corrective trend reasserts itself.
Key Trader Alert: Any trader holding long positions in the August 2026 COMEX gold contract must initiate their roll before July 29, 2026 to avoid triggering physical delivery obligations. Open interest and volume data should be monitored closely over the coming days.
What Happens Once the Rollover Completes?
Once the August contract expires and the mechanical buying pressure from short covering dissipates, the market is expected to revert to its corrective path. The most probable scenario for August itself is a sideways-to-lower trading pattern, with a potential retest of the $3,800 support level. This is not considered a structural breakdown but rather a continuation of the current consolidation phase within a larger bull market cycle.
Where Are the Real Support Levels? A Multi-Framework View
Technical Support Levels at a Glance
- $4,000 — Major psychological round number; already tested and briefly breached intraday
- $3,975 — Near-term short trade target, confirmed reached on July 16, 2026
- $3,963 — Recent intraday low as of July 17, 2026
- $3,800 — Primary technical and fundamental support zone; widely referenced across independent analytical frameworks
- $3,500 — Downside outlier scenario; not supported by prevailing macro and geopolitical fundamentals
Three Structural Pillars Anchoring the $3,800 Floor
Technical levels alone rarely hold in precious metals without fundamental backing. Three converging factors underpin the case for $3,800 as a durable support zone:
-
Sustained geopolitical hostility — The US-Iran situation continues to deteriorate. A 60-day ceasefire memorandum of understanding was initially structured in a way that would have seen hostilities renew in mid-August, uncomfortably close to US midterm election cycles. The renewal of tensions has effectively been brought forward to mid-July 2026. Ongoing military conflict in Ukraine and multi-theatre global instability continue to sustain gold safe-haven demand at elevated levels.
-
Broadening economic deterioration — China's Q2 2026 GDP printed at 4.2%, below consensus expectations. While the underlying output figures are less alarming than the headline suggests, economic conditions are softening across the US, parts of Europe, and Asia. Industrial production showed month-on-month weakness in June, and business equipment investment declined, though the year-over-year reading of +5.4% remains constructive.
-
Compounding political uncertainty — Domestic political instability across major economies, combined with approaching US midterm elections and ongoing trade fragmentation, is expected to intensify through Q3 and Q4 2026. This environment historically generates sustained institutional and retail demand for gold as a portfolio hedge.
Why Business Equipment Investment Is a Leading Indicator Worth Watching
One of the more nuanced economic signals tracked by commodity analysts is business equipment investment, a component within industrial production data. When companies commit capital to equipment purchases, it signals confidence in future hiring plans. Employment growth feeds into consumer spending, which in turn supports broader economic activity.
A single month of weakness in this category is not alarming, but a sustained downtrend would represent a meaningful leading indicator of broader economic deterioration — and by extension, a catalyst for accelerating gold's safe-haven bid.
Gold Price Forecasts: What Major Institutions Are Projecting
Year-End 2026 Forecast Comparison
| Institution | Price Target | Timeframe | Primary Thesis |
|---|---|---|---|
| J.P. Morgan | $6,000/oz | Q4 2026 | Stagflation, de-dollarisation, rate cuts |
| Trading Economics | $4,501/oz | 12-month forward | Global macro composite model |
| CoinCodex | $3,879/oz | August 15, 2026 | Historical momentum modelling |
| UBS | $3,500–$3,800/oz | End-2025 baseline | Geopolitical risk escalation scenario |
| HSBC | $3,175–$3,600/oz | 2025 range | Bullish but conservative relative to peers |
The spread between CoinCodex's $3,879 near-term projection and J.P. Morgan's $6,000 year-end target is not a sign of analytical disagreement — it reflects genuinely different time horizons and modelling assumptions. For further context, J.P. Morgan's commodities research outlines their stagflation and de-dollarisation thesis in considerable detail.
The medium-term consensus across most institutional models points sharply higher. CPM Group's own framework anticipates gold recovering toward $5,000 in the final four months of 2026, with further upside extending into 2027 as the geopolitical and macroeconomic risk environment intensifies.
The breadth of institutional forecasts does not signal confusion. It signals that gold remains in a high-uncertainty, high-opportunity environment where near-term and medium-term outcomes can diverge dramatically.
The Bull Market Structure: Mapping 2019 to 2026
How the Current Cycle Developed
The gold bull market that defined the 2019 to 2026 period did not arrive in a single wave. Its development followed a multi-phase structure that is instructive for understanding where the market currently sits:
- Mid-2019: Gold broke above the $1,200 to $1,500 range, marking the early phase of a new bull cycle. At the time, this was considered a significant move, though it appears modest in retrospect.
- 2019 to 2024: Gold entered a prolonged consolidation and accumulation phase, trading primarily between $1,600 and $2,100. This five-year band reflected genuine macro uncertainty without the triggering catalysts for a full breakout.
- Late 2024 to early 2025: The acceleration phase began, with gold surpassing $2,500 as inflationary pressures, geopolitical escalation, and central bank buying converged.
- January 2026: Gold peaked near $4,500, representing a near-tripling from the lower end of its 2019 to 2024 trading range. Gold's $3,000 milestone earlier in that cycle had already signalled that structural forces were rewriting expectations.
- Mid-2026: The current correction is occurring within the acceleration phase, not signalling a structural reversal.
The Broader Asset Repricing Narrative
Gold's repricing does not exist in isolation. It is part of a systemic revaluation of real and monetary assets that includes silver, platinum, and even the US dollar, which has appreciated approximately 10% on a trade-weighted basis since 2019. This convergence suggests the driving force is not speculative rotation into gold specifically, but a fundamental reassessment of value stores across asset classes in response to fiscal expansion, monetary policy uncertainty, and geopolitical fragmentation.
The next major ASX story will hit our subscribers first
Silver, Platinum, and Palladium: Parallel Corrections Across the Sector
Silver Testing the $55 Support Zone
Silver's behaviour in mid-2026 mirrors gold's pattern almost precisely. The metal is currently testing the $55 level, which had been identified as a key near-term downside target. In addition, a new short-term sell signal was issued upon reaching that level, with expectations of further weakness over the next six weeks before a recovery in Q4 2026 materialises alongside gold. For a deeper understanding of the relationship between these two metals, examining silver versus gold historical patterns provides important context.
Platinum: From Marketing-Driven Spike to Structural Correction
Platinum's 2025 to 2026 trajectory is a particularly instructive case study in how investor sentiment and marketing activity can interact with underlying fundamentals to produce dramatic price moves. For most of the period from 2014 to mid-2025, platinum traded between $800 and $1,200, a range reflecting its industrial demand profile and excess supply conditions.
In late May 2025, a wave of investor interest driven significantly by marketing activity pushed platinum from around $900 to $1,500 in a relatively short window. The momentum continued, and platinum came close to $3,000 — a record high — in January 2026. Since then, it has corrected sharply and is currently trading around $1,592, with the short-term trend remaining downward.
Palladium: Retracing Post-Ukraine Gains
Palladium set its all-time record high in February to March 2022 during the initial escalation of Russia's invasion of Ukraine, reflecting supply concentration concerns given Russia's dominant role in global palladium production. A subsequent rally in 2025 took the metal from approximately $900 to nearly $2,200 before a significant retracement began. As of July 17, 2026, palladium is trading around $1,250, having reached an intraday low of $1,225 earlier that morning.
Economic Data Points Every Gold Investor Should Be Tracking
| Economic Indicator | Recent Signal | Relevance to Gold |
|---|---|---|
| Consumer Price Index (CPI) | Released mid-July 2026 | Inflation trajectory directly affects real yields and gold demand |
| Producer Price Index (PPI) | Released mid-July 2026 | Input cost pressures signal future consumer inflation direction |
| Industrial Production (June) | Month-on-month weakness | Year-over-year remains strong; bears monitoring |
| Business Equipment Investment | Down in June; +5.4% YoY | Leading indicator for employment and consumer spending trajectory |
| Consumer Goods Production | Rebounded in June | Suggests resilient household demand despite macro headwinds |
| China Q2 GDP | 4.2% growth | Below expectations; underlying output data less weak than headline |
| European GDP | Relatively positive | Provides partial offset to US and China softness |
What the Geopolitical Environment Means for Gold Through Year-End 2026
A Compounding Risk Matrix
The final four months of 2026 carry an unusually concentrated set of risk factors that are expected to converge and intensify:
- The US-Iran situation has been brought forward from a mid-August hostility renewal timeline to mid-July, reducing the summer calm that markets may have otherwise anticipated
- The Russia-Ukraine conflict shows no meaningful path toward resolution, sustaining ongoing economic and military escalation
- US midterm election dynamics are expected to generate elevated domestic political uncertainty through Q4
- Global trade fragmentation, including tariff regimes and supply chain restructuring, continues to pressure real economic output across multiple major economies
The Strategic Outlook Through a Risk Lens
The convergence of these compounding risk factors creates the foundational conditions for gold to reclaim and potentially exceed its January 2026 highs. The expected price recovery toward $5,000 in Q4 2026 is predicated not on speculative optimism but on the expectation that the macro and geopolitical environment will worsen from here, continuously regenerating the investment demand that underpins gold's structural floor. Our broader precious metals analysis reinforces this view across the sector.
When political uncertainty intensifies, economic conditions deteriorate, and monetary frameworks are questioned, gold does not need a new catalyst. The existing environment is the catalyst.
Frequently Asked Questions: Gold Price Forecast and COMEX August Rollover
What is the COMEX August gold rollover date in 2026?
The last rollover day for the COMEX August 2026 gold futures contract (GCQ26) is July 29, 2026. Traders holding long or short positions must roll into a later contract, typically October or December 2026, before this date to avoid physical delivery obligations.
What is the gold price forecast for August 2026?
Near-term momentum models project gold around $3,879/oz by mid-August. Fundamental analysts expect sideways-to-lower trading through August, with a potential test of the $3,800 support level, followed by a sharper recovery in Q4 2026 as geopolitical and political risk factors intensify.
Will gold fall below $3,800 in 2026?
The $3,800 level is identified as a strong technical and fundamental support zone across multiple analytical frameworks. While a downside scenario toward $3,500 exists in some technical analyses, it is not supported by the current geopolitical and macroeconomic environment, which continues to underpin structural investment demand for gold.
Why is the COMEX rollover important for gold prices?
With approximately 23 million ounces of August open interest still outstanding in mid-July, short-position holders buying back their August contracts before rolling forward creates a transient but potentially significant wave of buying pressure. This mechanical dynamic could temporarily support or lift gold prices toward $4,200 to $4,300 before the broader corrective trend resumes.
What is J.P. Morgan's gold price target for 2026?
J.P. Morgan has set a $6,000/oz target for gold by Q4 2026, driven by its expectations of stagflation, continued central bank de-dollarisation, and anticipated Federal Reserve rate reductions.
Is the gold bull market still intact?
Yes. The structural bull market that originated in mid-2019 remains intact. The current correction is a cyclical pullback occurring at price levels that would have been considered extreme upside scenarios just 18 months ago. The macro, geopolitical, and monetary conditions that drove the bull market remain firmly in place.
Key Takeaways: Gold Price Forecast and COMEX August Rollover Summary
- Gold is in a near-term corrective phase, with technical and fundamental support at $3,800 and rollover mechanics providing potential temporary upside toward $4,200 to $4,300
- The COMEX August 2026 rollover deadline is July 29 and active position management is required for all futures traders
- The structural bull market remains intact, with a recovery toward $5,000 anticipated in Q4 2026 driven by compounding geopolitical and macroeconomic risk factors
- Institutional price forecasts for year-end 2026 range from $3,879 (CoinCodex) to $6,000 (J.P. Morgan)
- Silver, platinum, and palladium are experiencing parallel corrections consistent with a broad precious metals sector rotation rather than commodity-specific weakness
- Business equipment investment and industrial production data represent critical leading indicators for the gold demand trajectory and should be monitored closely through Q3 2026
- The gold price forecast and COMEX August rollover mechanics are deeply interconnected in the near term, making contract expiry dynamics a key variable for position management over the coming two weeks
Readers seeking further independent analysis on precious metals markets can explore CPM Group's weekly market briefings and annual yearbook publications at cpmgroup.com. These resources offer research-driven, data-focused perspectives on gold, silver, platinum group metals, and related commodity markets. This article is for informational purposes only and does not constitute financial advice. Forecasts and price projections referenced herein are sourced from third-party institutions and carry inherent uncertainty. Past price performance is not indicative of future results.
Want to Be Alerted the Moment a Major Precious Metals Discovery Hits the ASX?
While institutional forecasts point toward $5,000 gold and compounding geopolitical tailwinds continue to drive precious metals demand, Discovery Alert's proprietary Discovery IQ model scans ASX announcements in real time — instantly identifying significant mineral discoveries across gold, silver, platinum, and beyond, so subscribers can act well ahead of the broader market. Explore historic discovery returns on Discovery Alert's dedicated discoveries page and begin your 14-day free trial to position yourself at the forefront of the next major ASX mineral find.