June 19, 2026
Why Precious Metals Bull Markets Always Pause Before Their Most Powerful Moves
Every sustained bull market in precious metals history has followed a rhythm that frustrates short-term traders while rewarding patient, strategically minded investors. The explosive gains come in concentrated bursts, separated by extended consolidation phases that can last months and test the conviction of even seasoned market participants. Understanding this rhythm — and the gold price forecast next buying opportunity in July — is not merely academic. It is the difference between chasing peaks and accumulating at troughs.
Gold's trajectory through 2025 was nothing short of extraordinary. After climbing aggressively across the year, the metal reached a high of approximately $5,595/oz in January 2026, reflecting a convergence of monetary uncertainty, institutional diversification demand, and structural shifts in global reserve management. Since then, the market has entered a period of measured consolidation, pulling back toward the $4,600/oz range and prompting questions about whether the bull run has ended or simply paused.
Technical analysis from registered Chartered Market Technician (CMT) AG Thorson, published via Gold-Eagle.com on May 1, 2026, suggests the pause is entirely consistent with historical precedent. Furthermore, the gold price forecast next buying opportunity is likely to crystallise around July 2026.
When big ASX news breaks, our subscribers know first
Recognising the 2006 Blueprint in Today's Market Structure
For investors with a long memory, the current setup carries unmistakable echoes of the 2006 precious metals consolidation. During that period, gold had surged dramatically before entering a multi-month sideways correction that shook out speculative positioning and reset sentiment to more neutral levels. The eventual resumption of the bull market that followed proved far more durable than the initial advance.
Thorson's analysis identifies the current phase as structurally similar, describing it as a 2006-style consolidation that could persist for several more months before the next meaningful accumulation window opens. The conceptual logic is straightforward: after explosive appreciation, markets need time to absorb paper profits, reset speculative excess, and rebuild a base of patient, conviction-driven holders.
Three structural similarities stand out when comparing the current phase to 2006:
- Duration: Multi-month consolidation following a rapid price advance
- Sentiment shift: Transition from euphoric retail participation to more cautious positioning
- Technical base building: Formation of higher lows while price digests earlier gains
Recognising this pattern at its early stages is precisely what allows strategic accumulators to position ahead of the crowd rather than react after confirmation arrives. In addition, understanding the broader bull market catalysts helps investors maintain conviction during these testing consolidation phases.
The Gold Cycle Indicator and What a Reading of 150 Really Means
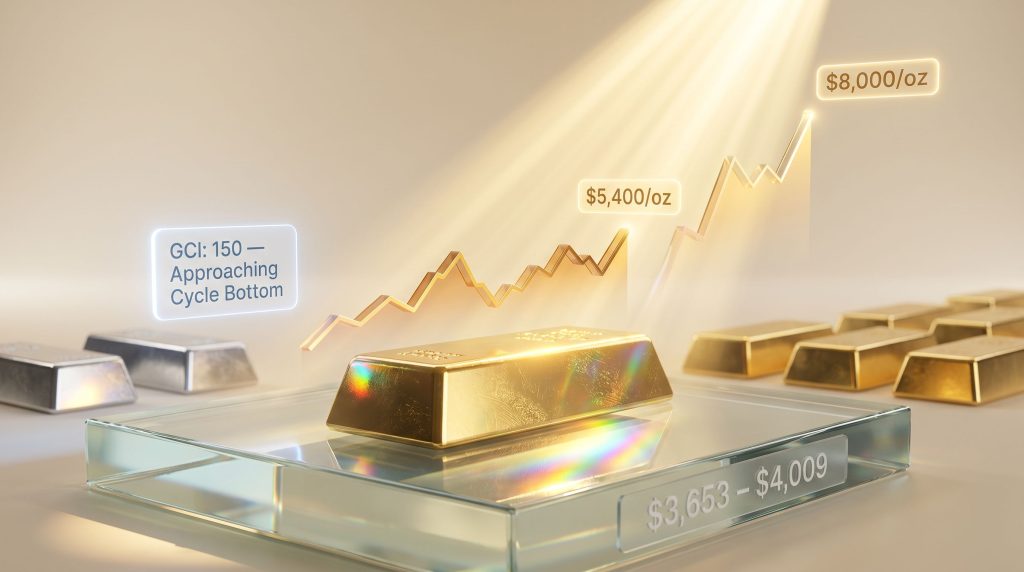
One of the more distinctive tools referenced in Thorson's analysis is the Gold Cycle Indicator (GCI), a proprietary technical instrument designed to identify recurring price rhythms within the gold market. As of May 1, 2026, the GCI finished at a reading of 150, with the analyst's framework suggesting the indicator is approaching a cycle bottoming zone expected to materialise around mid-year.
Cycle-based technical analysis operates on a fundamentally different premise than traditional price momentum or volume analysis. Rather than asking whether gold is trending up or down in the near term, cycle analysis asks where within a recurring temporal pattern the market currently sits. The assumption is that markets express repetitive rhythmic behaviour driven by the aggregate psychology of participants, credit cycles, and macro policy rhythms.
| Indicator | Current Reading | Signal Interpretation |
|---|---|---|
| Gold Cycle Indicator (GCI) | 150 | Approaching cycle bottom zone |
| 200-Day SMA | Active resistance | Near-term bearish technical pressure |
| Short-Term Momentum | Declining | Consistent with pre-bottom market behaviour |
| Projected Cycle Low Timing | July 2026 | Potential accumulation window |
"Cycle indicators do not predict price levels with precision. Their value lies in identifying timing windows where historical patterns suggest elevated probability of trend reversals, which investors can then layer with other confirming signals before deploying capital."
A GCI reading approaching its lower bound signals that the mathematical rhythm of the cycle is converging toward its trough phase. When combined with declining short-term momentum and active resistance at the 200-day moving average, the overall technical picture is one of a market moving toward a high-probability entry zone rather than signalling structural deterioration.
Near-Term Price Path: The May Bounce and the July Trough
Thorson's technical framework outlines a specific two-stage price trajectory between now and mid-year. The first stage involves an interim low forming now, followed by a recovery bounce extending into May. The second stage sees that May strength fading, with gold subsequently pulling back toward the $4,300/oz support zone to establish a mid-year low.
This type of bounce-then-pullback sequence is a well-documented pattern in markets undergoing corrective phases within larger uptrends. The May rebound would represent a relief rally as short-term oversold conditions are resolved, while the subsequent decline into July completes the cyclical bottoming process with more durable support. According to FX Empire's analysis, this mid-year consolidation is a recognised technical setup that experienced traders watch closely for accumulation signals.
Quantitative modelling referenced in the broader analysis suggests:
- A near-term decline of approximately 3.83% from current levels, targeting roughly $4,444/oz
- A July 2026 projected price range of $3,653 to $4,009/oz, with an average around $3,898/oz
- This range represents a potential 13% pullback from the current $4,600/oz level
- Daily volatility metrics are running at approximately 1.51%, consistent with a market in directional decline before a meaningful reversal
Important Disclaimer: Near-term price projections from algorithmic models carry inherent uncertainty and should not be interpreted as guaranteed outcomes. A decisive breakdown in the US dollar, an unexpected shift in Federal Reserve policy, or an escalating geopolitical shock could materially alter this trajectory in either direction.
The $4,300 level carries particular technical significance. It represents not just a round number but a confluence of chart-based support structures that would likely attract fresh buying interest if reached. An investor accumulating near this level would be positioning at approximately a 23% discount from the January 2026 peak, within a market whose longer-term trajectory remains constructive according to the institutional forecasting consensus.
What the Major Banks Are Projecting for Gold Through Year-End 2026
While cycle analysis and technical frameworks define the near-term path, institutional research from major financial organisations provides the fundamental backdrop against which those technical signals should be interpreted.
| Institution | Year-End 2026 Target | Primary Driver | Key Risk |
|---|---|---|---|
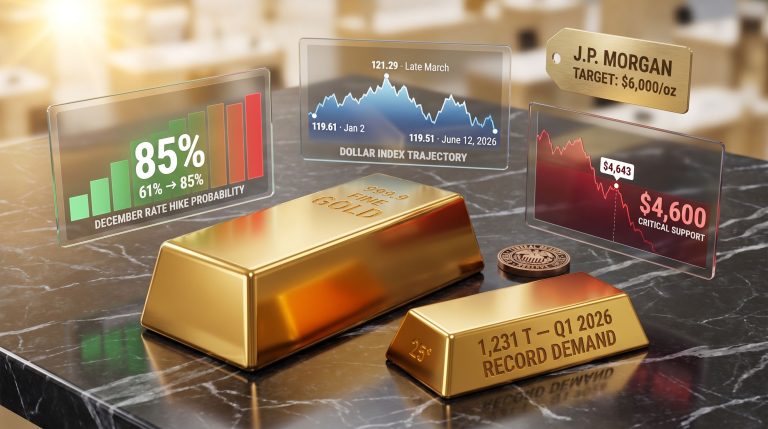
| J.P. Morgan | $5,000 to $5,400/oz | Fed easing cycle, portfolio diversification | Non-linear path; near-term dips likely |
| Goldman Sachs | $5,400/oz | Structural demand, central bank buying | Post-rally consolidation phases |
| World Gold Council | +5% to +15% (mild scenario) | Geopolitical hedging, recession risk | Strong USD (-5% to -20% downside scenario) |
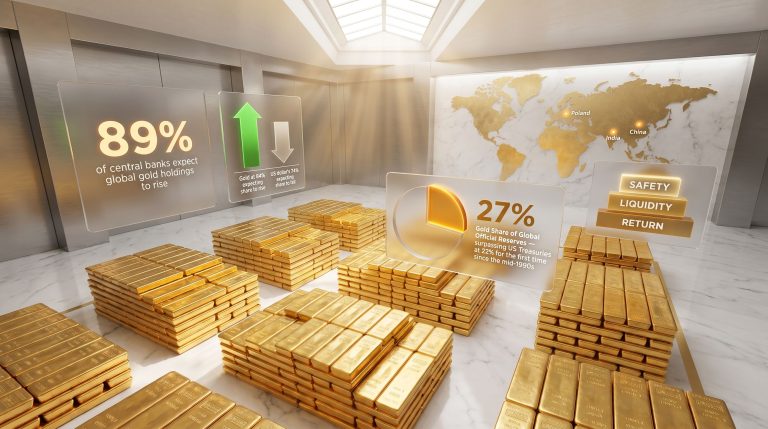
The institutional consensus tells a consistent story: despite near-term volatility and the likelihood of a mid-year trough, the structural case for gold through year-end 2026 remains firmly intact. Key drivers cited across these forecasts include:
- Federal Reserve monetary easing compressing real yields and reducing the opportunity cost of holding non-yielding assets
- Central bank gold demand continuing to provide structural demand beneath the market
- Portfolio allocation shifts as institutional investors increase gold's weighting in response to equity market uncertainty
- Geopolitical risk premiums remaining elevated across multiple global flashpoints
Goldman Sachs reaffirmed its $5,400/oz target even after absorbing the March correction of approximately 10%, suggesting conviction in the structural thesis despite cyclical volatility.
Mapping the Opportunity: From July Trough to Year-End Recovery
The arithmetic of the opportunity implied by this analysis is significant. If gold reaches the projected July range of $3,653 to $4,009/oz and subsequently recovers toward the institutional year-end targets of $5,000 to $5,400/oz, the implied upside from the trough to Q4 2026 sits in the range of 16% to 26% depending on exact entry and exit levels.
An investor accumulating at or near the $4,300 support zone and targeting a recovery toward $5,000/oz would be positioned for approximately 16% upside. Those with more aggressive targets aligned to Goldman's $5,400/oz projection would be working with potential upside closer to 26% from that entry level.
This type of risk-reward setup is precisely what technical cycle analysis is designed to identify: not the certainty of outcome, but the asymmetry between potential upside and downside within a defined entry window.
The next major ASX story will hit our subscribers first
The Five Macro Variables That Could Reshape the July Timeline
The July buying window thesis is conditional rather than absolute. Several macro variables have the potential to either accelerate the timeline, deepen the trough, or prevent the anticipated pullback from materialising at all.
-
Federal Reserve interest rate decisions: The Fed's decision to hold rates unchanged at its most recent meeting has maintained upward pressure on real yields, which tends to weigh on gold. Any pivot toward cuts would compress real yields and reignite structural demand rapidly.
-
US Dollar Index (DXY) trajectory: Dollar strength remains the primary headwind for precious metals. A sustained breakdown in the DXY would materially improve the outlook for gold, silver, and mining equities simultaneously. Thorson specifically notes that a decisive dollar breakdown would alter the silver outlook meaningfully.
-
Central bank gold purchasing activity: Record buying levels from central banks in 2024 and 2025 provided substantial structural price support. Any deceleration in institutional buying could reduce the floor beneath gold during consolidation phases.
-
US Treasury real yields: Rising real yields historically correlate with suppressed gold prices. The relationship between Federal Reserve policy, nominal yields, and inflation expectations remains the single most important fundamental variable for gold's near-term direction.
-
Geopolitical risk events: Black swan developments remain a wildcard with the capacity to override technical and cyclical frameworks. An unexpected escalation could accelerate a price recovery well before the July window opens.
Silver, Platinum, and Mining Equities: The Wider Metals Complex
The July thesis does not apply exclusively to physical gold. The broader precious metals complex is exhibiting similar cyclical patterns, each with its own nuances.
Silver's Post-Surge Consolidation
Silver experienced a dramatic surge to $120/oz during 2025, a move driven by a combination of monetary premium expansion and sustained industrial demand from electrification and solar manufacturing. The metal is now in a consolidation phase, digesting those gains before the next directional move.
Thorson's long-term technical work supports a target range of $300 to $500/oz for silver within the next few years, contingent on continued monetary debasement and industrial structural demand growth. Monitoring the gold-silver ratio during this consolidation phase provides additional context for understanding relative value between the two metals. Critically, a decisive breakdown in the US dollar is identified as the primary catalyst that would accelerate the next silver leg higher.
Platinum's Mid-Year Test
Platinum is expected to follow a similar near-term trajectory to gold and silver: a bounce into May followed by a mid-year pullback that tests support near the October 2025 high of $1,750/oz. This level represents a critical technical zone that, if held, would define the platform for the next advance.
Gold Mining Equities: GDX, GDXJ, and SILJ
| ETF | Near-Term View | Key Support Level | Thesis Invalidation |
|---|---|---|---|
| GDX (Senior Miners) | Bounce into May, then pullback | April high as resistance | Strong breakout above April high |
| GDXJ (Junior Miners) | Potential retest or marginal break of March low in July | March low | Decisive breakout above April high |
| SILJ (Junior Silver Miners) | Retest of March low expected around July | March low | Sustained momentum reversal above April high |
Gold mining equities offer leveraged exposure to precious metals price movements but carry additional layers of operational, balance sheet, and management risk compared to direct metal ownership. During consolidation phases, miners often underperform physical metals as cost pressures and investor uncertainty weigh on valuations, however they can provide significantly amplified returns during recovery phases.
The Long-Term Case: $8,000 by 2027 and the $15,000 Scenario
Beyond the near-term cyclical mechanics, Thorson's technical analysis carries particularly striking long-term projections. The analyst sees gold reaching approximately $8,000/oz in 2027, driven by continued monetary expansion, sustained institutional adoption, and persistent geopolitical hedging demand.
Even more ambitious is the view that gold could reach as high as $15,000/oz by 2031, contingent on sustained dollar debasement, accelerating central bank reserve diversification away from US Treasuries, and structural inflation remaining entrenched in major economies. J.P. Morgan's commodities research similarly highlights structural tailwinds that could support gold well beyond current institutional consensus targets.
The structural forces underpinning these long-term targets include:
- Monetary debasement: Persistent expansion of global money supply without proportional increases in productive output
- De-dollarisation trends: Incremental shifts by sovereign nations toward alternative reserve assets, including gold
- Geopolitical realignment: Fragmentation of the post-Cold War financial order creating demand for assets outside the traditional dollar-denominated system
- Institutional adoption: Growing allocations from pension funds, sovereign wealth funds, and family offices seeking uncorrelated returns
Long-Term Caveat: Projections of $8,000/oz by 2027 and $15,000/oz by 2031 are directional technical scenarios derived from cycle and trend analysis. They carry substantial uncertainty and should be treated as outer boundary possibilities rather than base case expectations. Investors should apply appropriate position sizing and risk management frameworks.
A Practical Framework for Approaching the July 2026 Buying Window
Identifying a potential buying opportunity is only half the challenge. Translating that identification into a disciplined investment process is what ultimately determines outcomes.
-
Monitor the $4,300 support zone on gold for early evidence of stabilisation. This is the technical level the analyst has identified as the probable mid-year low target. Watch for reduced selling volume and sequential higher intraday lows as confirmation signals.
-
Track the macro trigger set: Specifically, watch Fed meeting outcomes, DXY daily closes, and US 10-year real yield movements. A reversal in any of these variables would strengthen the case for adding exposure earlier than July.
-
Stage entries across a defined range: Rather than targeting a single entry price, consider scaling into positions across the $3,900 to $4,300 range on gold to reduce timing risk. This approach sacrifices some potential upside in exchange for reduced sensitivity to exact bottom identification.
-
Diversify across the metals complex: Exposure across physical gold, silver, and quality mining equities captures different elements of the macro thesis with varying risk-return profiles. Each asset class will respond differently to the specific catalysts that ultimately drive the recovery.
-
Define clear invalidation levels: Establish in advance the price levels at which your thesis would be considered incorrect. A decisive and sustained breakdown below $3,650/oz on gold would challenge the cyclical bottoming interpretation and warrant reassessment.
-
Track the GCI alongside other momentum indicators: Use the Gold Cycle Indicator's approach toward its lower bound as a timing signal to layer with price action confirmation rather than treating it as a standalone trigger.
Key Data Summary: Gold Price Forecast for Mid-2026
| Metric | Value |
|---|---|
| Current Gold Price (approx. May 2026) | ~$4,600/oz |
| January 2026 Peak | ~$5,595/oz |
| Key Technical Support Level | ~$4,300/oz |
| July 2026 Projected Range | $3,653 to $4,009/oz |
| Potential Pullback from Current Price | ~13% |
| J.P. Morgan Year-End 2026 Target | $5,000 to $5,400/oz |
| Goldman Sachs Year-End 2026 Target | $5,400/oz |
| Potential Upside from July Trough to Year-End | 16% to 26% |
| Long-Term Target (2027) | ~$8,000/oz |
| Long-Term Target (2031) | Up to ~$15,000/oz |
| Silver Long-Term Target Range | $300 to $500/oz |
| Platinum Near-Term Support | ~$1,750/oz |
| Gold Cycle Indicator (GCI) | 150 (approaching cycle bottom) |
Frequently Asked Questions
What is the gold price forecast for July 2026?
Technical cycle analysis projects a potential gold price range of $3,653 to $4,009/oz in July 2026, representing an estimated pullback of approximately 13% from current levels near $4,600/oz. However, major institutional forecasters including J.P. Morgan and Goldman Sachs maintain year-end 2026 targets of $5,000 to $5,400/oz, suggesting any July weakness would represent a temporary trough within a continuing uptrend.
Why is July 2026 identified as the gold price forecast next buying opportunity?
The Gold Cycle Indicator is approaching its lower boundary, historically associated with cycle trough phases. Combined with the 2006 historical parallel and the expected two-stage price path of a May bounce followed by a mid-year pullback, July emerges as the window where multiple technical signals are expected to converge at a high-probability accumulation zone.
What would prevent the anticipated July 2026 gold pullback?
A decisive breakdown in the US dollar index, a surprise Federal Reserve interest rate cut, or a major geopolitical escalation could interrupt the consolidation phase and push prices higher before July. The analyst specifically identifies a dollar breakdown as the variable most likely to materially alter the near-term outlook.
How do gold mining equities compare to physical gold as July approaches?
Physical gold and gold-backed ETFs provide direct exposure with lower volatility. Gold mining equities, including GDX and GDXJ, offer amplified exposure but carry operational and balance sheet risks. During consolidation phases, miners typically underperform physical metal but can generate stronger returns during the recovery phase. Furthermore, GDXJ specifically may test or marginally break below its March low in July before recovering.
What are the long-term gold price targets beyond 2026?
Technical analysis from the source framework points to approximately $8,000/oz by 2027 and as high as $15,000/oz by 2031, driven by monetary debasement, central bank reserve diversification, and de-dollarisation trends. These are directional scenarios carrying significant uncertainty and should not be interpreted as guaranteed forecasts.
This article is intended for informational purposes only and does not constitute financial advice. Precious metals markets involve significant risk and price volatility. Past performance and historical technical patterns do not guarantee future results. All price projections referenced herein represent the analytical views of independent technical analysts and major institutional research teams and should be considered alongside your own due diligence and risk tolerance. Consult a qualified financial adviser before making investment decisions.
Want to Know When the Next Major ASX Mineral Discovery Is Announced?
While gold's mid-year consolidation may be setting up a compelling accumulation window, the real asymmetric returns in the resources sector often come from being first to act on a significant new mineral discovery — and Discovery Alert's proprietary Discovery IQ model delivers real-time ASX discovery alerts straight to subscribers, turning complex geological announcements into clear, actionable insights. Explore historic discoveries and their exceptional market returns, then start your 14-day free trial to ensure you're positioned ahead of the market when the next major find is announced.