June 30, 2026

When Inflation Surprises, Gold Cycles, and Dollar Strength Collide
Precious metals markets have a long history of confounding investors who anchor their outlook to price alone. The most durable wealth-building opportunities in gold and silver rarely announce themselves cleanly. Instead, they tend to emerge from the noise of competing macro signals, technical exhaustion, and sentiment extremes. The current environment fits the gold price forecast mid-year lows thesis almost precisely, presenting a case study in how inflation data, currency dynamics, and cycle positioning can simultaneously support a short-term correction while leaving a long-term bull market structurally intact.
When big ASX news breaks, our subscribers know first
Why Technical Analysts Are Flagging a Mid-2026 Pullback in Gold
The momentum that carried precious metals to historic highs in early 2025 appears to be entering a consolidation phase. A cluster of macroeconomic signals arriving in mid-May 2026 has sharpened that view considerably. The most significant data point has been the Producer Price Index reading, which came in at 1.4% against a consensus estimate of just 0.5%, a miss of nearly 180% relative to expectations.
That kind of deviation from forecasts does not pass through markets quietly. It immediately re-anchors inflation expectations higher and reinforces the case that interest rates may need to remain elevated for longer than previously assumed. Furthermore, the gold price forecast environment has shifted meaningfully as a result.
For gold, this matters through a well-established channel. Non-yielding assets like bullion face a structural disadvantage when real and nominal yields rise, because the opportunity cost of holding gold increases. A PPI surprise of this magnitude resets probability distributions around Federal Reserve policy, tilting rate expectations toward prolonged restriction rather than imminent easing.
The Macro Setup That's Shifting Momentum Against Precious Metals
The broader macro backdrop heading into mid-year has shifted in meaningful ways. Treasury yields have trended higher, and equity markets continue to make record highs despite deteriorating consumer confidence readings. The combination of an inflation surprise, a strengthening US dollar, and rising yields creates a three-sided headwind for precious metals that is difficult to dismiss as noise.
AG Thorson, a registered Chartered Market Technician (CMT) through the Market Technicians Association and editor of GoldPredict.com, observes that continued downside follow-through combined with rising Treasury yields would suggest the recent bounce has exhausted itself and that prices are likely tracking toward projected mid-year lows.
Precious metals corrections within secular bull markets tend to feel more threatening than they actually are, because the psychological intensity of a pullback from record highs magnifies perceived risk even when the underlying structural thesis remains unchanged.
What Is the Gold Cycle Indicator and Why Does It Matter Right Now?
Cycle-based analytical frameworks operate on a fundamentally different premise than price-trend analysis. Rather than identifying where prices have been and extrapolating forward, cycle methodologies attempt to identify where markets are in a recurring sequence of accumulation, distribution, and reversal. The Gold Cycle Indicator is one such framework, and its current reading carries important implications for timing.
As of mid-May 2026, the Gold Cycle Indicator sits at 148, placing it squarely within the transition and neutral zone of the cycle framework. This reading suggests directional ambiguity in the near term, but more importantly, it suggests the market has not yet entered the bottoming phase where durable buying opportunities historically emerge.
| Cycle Phase | Indicator Range | Typical Market Behaviour |
|---|---|---|
| Overbought / Topping Zone | 160-180+ | Momentum fades, consolidation begins |
| Transition / Neutral | 130-160 | Directional ambiguity, range-bound |
| Bottoming Phase (Buy Zone) | Below 100 | Accumulation opportunities emerge |
| Recovery / Early Bull | 100-130 | Price begins new upward leg |
Note: Ranges are illustrative based on cycle analysis frameworks and do not constitute a guarantee of future performance.
How Cycle Bottoming Phases Have Historically Preceded Major Buying Opportunities
The logic of cycle analysis is that markets do not move in straight lines. Every sustained bull market in precious metals history has included intermediate corrections that tested investor conviction before the next major advance began. The 2006 metals consolidation is the historical analogue most relevant to current conditions, representing a period when gold and silver paused meaningfully before resuming their broader uptrend.
The critical insight from cycle frameworks is that the bottoming phase cannot be rushed. The indicator must descend toward the sub-100 zone before conditions for a durable cycle low are in place. At 148, the market still has considerable distance to travel before that threshold is met. Thorson's cycle work points toward July 2026 as a focal point for a potential re-entry opportunity, suggesting the bottoming process will be gradual rather than sudden.
How Is the US Dollar Influencing the Gold Price Forecast?
The inverse relationship between the US Dollar Index and gold prices is one of the most durable dynamics in financial markets. When the dollar strengthens, gold priced in USD becomes relatively more expensive for international buyers, compressing demand at the margin. Understanding where the dollar stands in its own technical cycle is therefore inseparable from the broader gold-stock market relationship and constructing a credible near-term outlook.
As of mid-May 2026, technical analysis of the Dollar Index suggests a one-year rounded bottom formation is potentially developing. This pattern is characterised by a gradual accumulation of buying interest over an extended period, followed by a breakout attempt above the formation's resistance level. For the DXY, that critical resistance sits near 100.50, a level that has proven difficult to overcome decisively.
The 100.50 Resistance Level on the DXY: A Critical Threshold
A confirmed breakout above 100.50 on the Dollar Index would represent more than a short-term technical development. It would validate the rounded bottom formation and signal the potential for medium-term dollar appreciation. The implications for precious metals would be direct and meaningful:
- Dollar strength increases the opportunity cost of gold in relative terms
- A stronger USD makes dollar-denominated commodities more expensive internationally
- Rising yields alongside a rising dollar compounds pressure on non-yielding assets
- Historical precedents suggest gold price weakness typically follows sustained DXY breakouts
A confirmed breakout above the 100.50 resistance zone on the US Dollar Index could act as a meaningful headwind for gold and silver through mid-year, particularly if Treasury yields simultaneously trend higher. The confluence of both signals would strengthen the correction thesis considerably. (AG Thorson, GoldPredict.com, May 2026)
What makes this setup particularly significant is the conditional nature of the bearish case. A dollar bounce that fails to sustain above 100.50 would significantly reduce the headwind for metals and potentially shorten the correction timeline. Investors monitoring this setup should treat the DXY 100.50 level as a binary catalyst, with sustained price action above it supporting the mid-year lows thesis and failure below it potentially truncating the corrective phase.
Where Is Gold Technically Positioned Heading Into Mid-Year?
Gold's technical structure as of mid-May 2026 reflects a market in transition, neither confirming a decisive new high nor breaking down into a clear corrective trend. The price remains anchored near the 50-day exponential moving average, a level that has served as a gravitational centre during the current consolidation.
One of the more technically significant observations is gold's failure to confirm the recent highs made by silver. In a healthy precious metals bull market, both metals tend to make new highs within close proximity to each other. When they diverge, it typically signals weakening internal momentum and elevates the probability of a reversal. This non-confirmation aligns with the broader correction thesis, and the gold-silver ratio analysis provides additional context for understanding this divergence.
Key Technical Thresholds to Watch:
- Support breach signal: A sustained breakdown below the 50-day EMA would confirm the rebound has exhausted itself
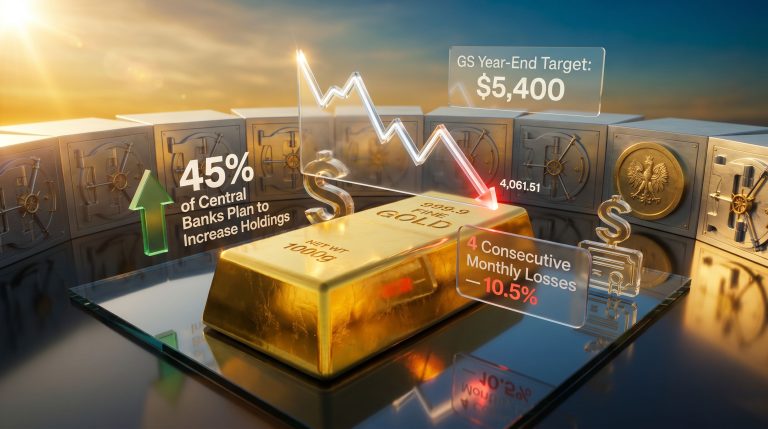
- Downside target zone: Technical cycle analysis suggests a mid-year low target near the $4,400 region, with deeper bearish scenarios projecting a test toward $4,066-$4,090/oz
- Price rollover timing: Technical analysis suggests prices could roll over between now and month-end
- Bullish invalidation level: A decisive move above current May 2026 highs would challenge the correction thesis
The range between $4,066 and $4,400 reflects the spread between base case and bearish case scenarios. The base case assumes dollar strength develops but does not dramatically accelerate, while the deeper correction scenario assumes a more pronounced DXY breakout combined with materially higher Treasury yields.
Silver, Platinum, and the Broader Metals Complex: Are They Confirming the Weakness?
When constructing a conviction-weighted view on precious metals direction, confirmation across multiple metals carries more analytical weight than any single asset's signal. A bearish thesis built only on gold's positioning can be dismissed as idiosyncratic. However, when silver and platinum add corroborating signals, the case strengthens considerably.
Silver's recent price action has generated a bearish engulfing candlestick pattern, one of the more reliable reversal signals in candlestick analysis. This pattern forms when a candle's body fully engulfs the prior candle's body on elevated selling volume. The analytical framework emphasises that a bearish engulfing candle alone requires confirmation through a decisive break below the 50-day EMA before concluding the rebound has definitively ended.
Platinum presents a different but equally instructive picture. The metal is currently testing the 50-day EMA as support, with the technical case requiring a series of consecutive closes below that level to signal rebound exhaustion. Unlike silver's single-candle reversal signal, platinum's framework demands sequential confirmation.
Cross-Metal Technical Summary:
| Metal | Key Signal | Bearish Confirmation Trigger |
|---|---|---|
| Gold | Stalling near 50-day EMA | Sustained close below 50-day EMA |
| Silver | Bearish engulfing candle formed | Decisive break below 50-day EMA |
| Platinum | Testing 50-day EMA support | Series of closes below 50-day EMA |
The convergence of these signals across three separate precious metals significantly raises the analytical credibility of the mid-year correction thesis. Each metal has its own supply and demand dynamics, yet all three are currently exhibiting structurally similar technical stress points, suggesting the headwinds are macro-driven rather than metal-specific.
The next major ASX story will hit our subscribers first
What Are Gold Miners Telling Us About the Broader Trend?
Mining equities occupy a unique position in precious metals analysis. They function as leveraged plays on the underlying metals, amplifying directional moves both up and down. More importantly, they frequently lead the spot metals complex at inflection points. The relationship between gold and mining equities has become particularly instructive during the current consolidation phase.
The VanEck Gold Miners ETF (GDX) has pulled back to test its 50-day EMA, mirroring the pattern observed in spot gold. The framework identifies $92.00 as the critical downside confirmation level for GDX, with progressive closes below that level providing the signal that the rebound phase has concluded.
GDXJ and SILJ: Why Junior Miners Are Leading Indicators
The VanEck Junior Gold Miners ETF (GDXJ) has formed a swing high, a technical pattern created when a price peak is flanked by lower highs on either side. The framework specifies that progressive closes below $120.00 on GDXJ would confirm the rebound is over and that junior miners are heading toward lower prices.
Silver Junior Miners (SILJ) have formed a similar swing high formation. Sustained breaks below the 50-day EMA across SILJ would provide additional confirmation that the May rebound across the entire precious metals complex has concluded.
In precious metals markets, junior miner indices like GDXJ and SILJ often lead the broader metals complex in both directions. A confirmed breakdown in junior miners frequently precedes weakness in spot gold and silver prices, making them among the most useful early warning indicators in technical cycle analysis.
The reason junior miners are leading indicators relates to their risk profile. Junior mining companies typically carry higher operational leverage, smaller cash buffers, and greater sensitivity to financing conditions than major producers. When institutional investors begin reducing precious metals exposure, junior miners typically experience selling pressure first, well before it manifests in spot metal prices or large-cap miner valuations.
Bull vs. Bear: What Are Institutional and Technical Analysts Forecasting for Gold in 2026?
The gold price forecast mid-year lows landscape is not uniformly bearish. A sharp divergence exists between short-term technical analysis frameworks, which point toward a corrective phase, and institutional research, which maintains a constructive medium-to-long-term view. Understanding both perspectives is essential for positioning appropriately across different time horizons.
2026 Gold Price Forecast Comparison:
| Analytical Framework | Short-Term View | Mid-Year Target | Year-End / Long-Term Target |
|---|---|---|---|
| Technical Cycle Analysis | Bearish / Correction | ~$4,400 mid-year low | Recovery into H2 2026 |
| CoinCodex Quantitative Model | Bearish near-term | Decline over next 1-4 weeks | ~$4,081 year-end |
| J.P. Morgan Institutional Research | Constructive | Consolidation | ~$5,000 by Q4 2026 |
| Deep Correction Scenario | Bearish | $4,066-$4,090 support test | Dependent on macro resolution |
| Long-Term Bull Thesis | Accumulation phase | Mid-year low as buy zone | $5,400+ by end-2027 |
This table is for educational and informational purposes only and does not constitute financial advice.
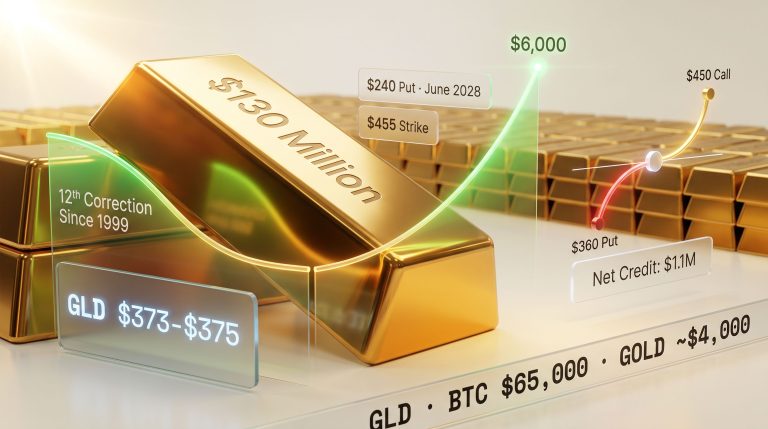
J.P. Morgan's institutional view targets $5,000/oz by Q4 2026, a figure that implies significant recovery from mid-year correction lows. This projection treats current weakness as transitory and expects structural drivers of gold demand, including central bank accumulation and declining real yields over time, to reassert themselves in the second half of the year.
The CoinCodex quantitative model takes a more precise near-term bearish stance, projecting weakness over the following one to four weeks from mid-May 2026 with a year-end target near $4,081, which aligns closely with the deeper correction scenario identified in cycle analysis. The proximity of these independently derived figures adds analytical credibility to the lower end of the correction range.
What Macro Forces Are Driving the Mid-Year Gold Correction Thesis?
The case for a near-term correction does not rest on any single variable. Instead, it reflects the simultaneous convergence of multiple macro forces that collectively create a challenging environment for precious metals. Understanding these forces individually, and in combination, clarifies both the probability and potential depth of the correction. Furthermore, the gold bull market catalysts that drove earlier gains are now temporarily offset by these near-term headwinds.
Key Macro Drivers and Their Near-Term Impact on Gold:
| Driver | Near-Term Impact on Gold | Direction |
|---|---|---|
| PPI at 1.4% vs. 0.5% estimate | Reinforces elevated rate expectations | Bearish short-term |
| US Dollar rounded bottom formation | Strengthens DXY, pressures metals | Bearish short-term |
| Rising Treasury yields | Increases opportunity cost of gold | Bearish short-term |
| Central bank gold accumulation | Provides structural demand floor | Bullish long-term |
| ETF inflows recovery | Signals institutional re-entry | Bullish medium-term |
| Geopolitical escalation risk | Safe-haven demand spike potential | Bullish wildcard |
Rising Treasury yields represent the most mechanically direct headwind. Gold generates no income, which means its attractiveness relative to yield-bearing assets deteriorates as yields rise. Central bank gold demand, however, provides the most durable structural floor beneath prices. Central banks globally have been consistent net buyers of gold since 2010, with annual purchases reaching multi-decade highs in 2022 and 2023.
Geopolitical variables function differently from these structural factors. A resumption of conflict scenarios or escalation in geopolitical tension could rapidly redirect capital into safe-haven assets, potentially truncating any corrective phase before mid-year lows are established.
Is the S&P 500's Divergence From Consumer Sentiment a Warning Sign for Risk Assets?
One of the most striking market conditions as of mid-May 2026 is the extraordinary gap between equity market performance and underlying consumer economic experience. The S&P 500 continues to make record highs, driven significantly by software companies, while consumer sentiment readings sit near historic lows. This divergence represents a form of market detachment that historically precedes periods of elevated volatility.
Thorson's assessment is direct: the market remains detached from economic reality, and it would likely require either a resumption of geopolitical conflict or a spike in Treasury yields to disrupt the equity market's upward trajectory.
When equities trade at record highs while consumer confidence sits near historic lows, historical precedent suggests elevated fragility in risk assets. A sharp equity correction could initially pressure gold alongside other assets before safe-haven demand reasserts itself.
The relationship between equity corrections and gold is complex and context-dependent. In acute risk-off events, gold and stocks have historically declined together in the initial phase as forced deleveraging drives indiscriminate selling. Safe-haven demand that supports gold typically reasserts itself only after the acute selling phase has exhausted itself, often several weeks into an equity drawdown.
What Does the Long-Term Gold Bull Case Look Like Beyond the Mid-Year Correction?
Situating the current correction within the broader multi-year bull market context is essential for avoiding the psychological trap of treating a cyclical pause as a structural reversal. The long-term thesis for gold rests on several structural pillars that the current PPI surprise and dollar strength do not fundamentally challenge.
The 2006 historical parallel is the most instructive reference point. During that period, precious metals paused meaningfully after strong advances, creating a period of uncertainty that tested investor conviction before the next major bull phase began. That consolidation ultimately proved to be one of the most valuable accumulation windows of the entire 2000s bull market.
Long-Term Scenario Framework:
| Timeframe | Gold Price Scenario | Key Conditions Required |
|---|---|---|
| Mid-2026 (Low) | $4,066-$4,400 correction zone | Dollar strength, elevated yields |
| Q4 2026 | $4,800-$5,000 recovery | Fed pivot signals, dollar weakening |
| 2027 | $5,000-$5,400 | Continued central bank demand, USD decline |
| 3-5 Year Bull Case | $10,000+ | Structural monetary debasement, de-dollarisation |
Scenario projections are speculative and for educational purposes only. They do not constitute financial advice.
From a big-picture perspective, Thorson's long-term framework sees gold surpassing $10,000/oz and silver trading above $300 within the next three to five years. The structural drivers behind these longer-term targets include continued monetary debasement across major fiat currencies, de-dollarisation trends in global trade settlement, and the likelihood that central bank demand remains structurally elevated as geopolitical fragmentation incentivises reserve diversification away from US Treasuries.
When Is the Next Gold Buying Opportunity Expected?
For investors tracking the gold price forecast mid-year lows framework, the practical question is not whether a correction is coming, but when and how to identify the signal that it has run its course. Cycle analysis frameworks provide a structured approach to answering that question by specifying observable conditions that must be met before a cycle low can be confirmed.
Checklist: Signs That a Mid-Year Gold Low May Be Forming
- Gold Cycle Indicator enters the minimum bottoming phase threshold (sub-100 reading)
- Gold price stabilises above a key structural support zone after testing lower
- US Dollar Index fails to sustain a breakout above 100.50
- Treasury yields begin reversing from cyclical highs
- Junior miner indices (GDXJ and SILJ) stop making successive lower lows
- Gold and silver begin confirming each other's price action simultaneously
July 2026 has emerged as the focal point in Thorson's cycle work for a potential re-entry window. This timing reflects both the expected duration of the current corrective phase and the historical pattern of precious metals cycle lows clustering around mid-year windows during broader bull markets. Investors should treat this as a probable window rather than a guaranteed date, with the checklist above serving as the confirmation mechanism.
Frequently Asked Questions: Gold Price Forecast Mid-Year Lows
What Is the Projected Mid-Year Low for Gold in 2026?
Technical cycle analysis frameworks suggest a mid-year correction target in the $4,066-$4,400 range, depending on the severity of dollar strength and yield pressure. This is not a consensus figure, and institutional forecasts from firms like J.P. Morgan project a recovery toward $5,000/oz by Q4 2026 once corrective pressure subsides. These projections are speculative and carry meaningful uncertainty in both directions.
Why Are Gold Miners Underperforming Spot Gold During This Period?
Mining equities amplify directional moves in spot metals in both directions. During corrective phases, miners tend to sell off more sharply than the underlying metal due to their sensitivity to operating cost pressures, equity market sentiment, and financial leverage to gold prices. Junior miners face additional pressure from financing conditions and risk appetite, explaining why GDXJ and SILJ often lead the broader complex lower.
Is This Mid-Year Pullback a Reason to Sell Gold?
Most technical and institutional frameworks characterise the current consolidation as a pause within a larger structural bull market, not a trend reversal. Cycle analysts point to the 2006 metals pause as evidence that mid-cycle corrections are normal components of multi-year advances rather than terminal signals. The long-term structural case for gold remains intact under this framework.
What Would Invalidate the Mid-Year Low Thesis?
A decisive and sustained breakout above current May 2026 highs in gold, accompanied by confirmation from silver and junior miners, would challenge the correction thesis. A rapid deterioration in geopolitical conditions, or an unexpected shift toward Federal Reserve rate cuts, could also accelerate a resumption of the bull trend before mid-year lows are established.
How Does Bitcoin's Outlook Compare to Gold's Mid-Year Forecast?
Thorson's cycle work suggests Bitcoin faces its own corrective cycle, with a potential test of the $40,000 level before a cyclical bottom forms around October 2026. The framework notes that Bitcoin remains at a critical juncture with RSI momentum testing support, and that historically, after testing the 200-day moving average, Bitcoin prices have declined approximately 60% during bear cycles. A sustained breakout above $90,000 would be required to invalidate that bearish scenario. Unlike gold's structural safe-haven demand, Bitcoin's corrective risk is framed around historical bear cycle drawdown patterns and cycle timing rather than macro yield dynamics.
This article is for informational and educational purposes only and does not constitute financial or investment advice. All price forecasts and projections discussed represent the views of technical analysts and institutional research teams and carry significant uncertainty. Past performance of cycle indicators or price patterns does not guarantee future results. Readers should conduct independent research and consult a qualified financial adviser before making any investment decisions.
Want to Know When the Next Major Gold Discovery Could Reshape the Market?
While macro cycles and technical thresholds dominate the gold price conversation, Discovery Alert's proprietary Discovery IQ model delivers real-time alerts the moment significant mineral discoveries hit the ASX — turning complex data across 30+ commodities into clear, actionable insights for both short-term traders and long-term investors. Explore how historic ASX mineral discoveries have generated exceptional returns, and begin your 14-day free trial today to position yourself ahead of the market.