June 18, 2026
When Forecasting Breaks Down: Why Gold in 2026 Defies Conventional Models
Precious metal analysts spend careers building price models anchored to interest rate differentials, currency movements, and inflation cycles. Yet the gold price forecast amid Middle East conflict has exposed the limits of every standard framework. When a single commodity is simultaneously responding to drone strikes in the Persian Gulf, sovereign reserve rebalancing in Beijing, Federal Reserve signalling shifts in Washington, and retail accumulation flows across Southeast Asia, no single variable can anchor a reliable directional call. The result is one of the most genuinely uncertain pricing environments gold markets have seen in a generation.
Understanding where gold goes from here requires abandoning the search for a single dominant driver. Instead, the more productive analytical approach is scenario-based: mapping the plausible pathways across geopolitical, monetary, and structural demand dimensions, and understanding which combinations of outcomes produce which price outcomes.
When big ASX news breaks, our subscribers know first
The Extraordinary Price Journey That Created This Complexity
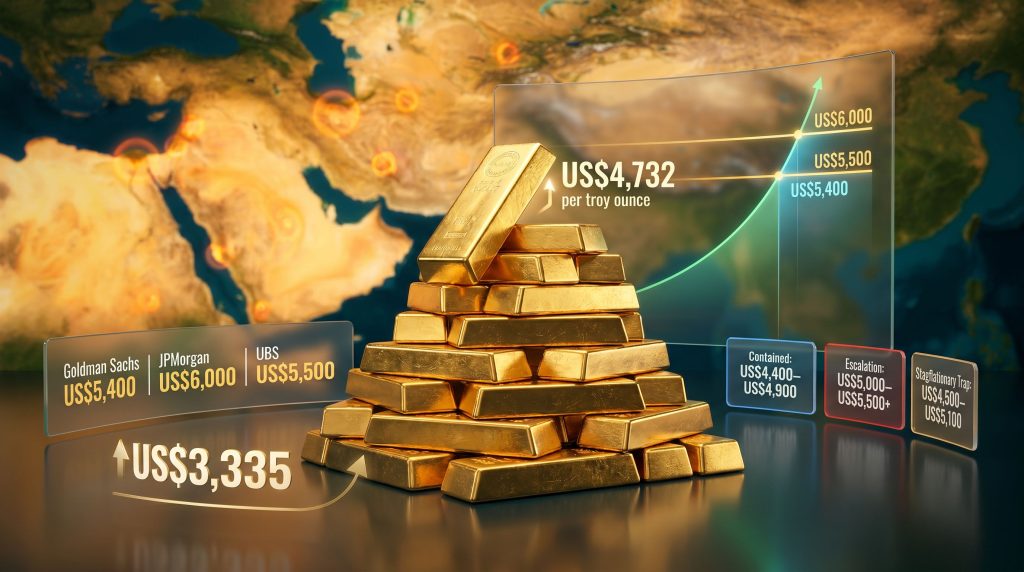
Between May 2025 and May 2026, gold appreciated from US$3,335 per troy ounce to US$4,732 per troy ounce, a gain of approximately 42% in twelve months. That magnitude of appreciation in a single year is not typical safe-haven behaviour. It reflects a simultaneous convergence of at least three structurally distinct demand forces operating independently of one another.
The first is geopolitical risk premium accumulation driven by the ongoing Middle East conflict. The second is institutional and sovereign accumulation tied to de-dollarisation strategies across emerging market central banks. The third concerns inflation hedge dynamics from investors recalibrating their portfolios against a backdrop of sticky price pressures and shifting rate expectations.
"When three independent demand forces align simultaneously, the resulting price signal is not simply additive. Each reinforces the others in ways that make reversals partial rather than complete, which is why even significant de-escalation events have failed to produce sharp sustained corrections."
How Middle East Conflict Actually Moves the Gold Price
The Non-Linear Relationship Between Escalation and Price
A common misconception is that geopolitical escalation produces proportionally larger gold price gains. The historical record, and the 2026 trading pattern specifically, tells a more complicated story. Escalation events such as missile strikes or fresh breakdowns in ceasefire negotiations generate short-duration spikes in safe-haven demand. However, the magnitude and durability of these moves is filtered through competing macro variables.
When the same risk-off event that triggers gold buying also strengthens the US dollar, the two forces partially cancel each other out. Gold is priced in US dollars, meaning a stronger dollar compresses the metal's price in USD terms even as demand rises. World Gold Council commentary from mid-2026 has noted that during several escalation episodes, equity markets remained relatively resilient, suggesting broader investor sentiment has not fully priced in worst-case geopolitical scenarios. This limits the scale of panic-driven gold buying.
Equally notable is the pattern of profit-taking by Western investors during periods of elevated tension. When prices spike on escalation news, institutional and retail investors who accumulated earlier in the cycle are incentivised to realise gains, creating selling pressure that offsets fresh safe-haven inflows. This is not new behaviour. Similar dynamics played out during the 2008 global financial crisis and the early stages of the COVID-19 pandemic, where initial safe-haven surges were followed by sharp corrections before the structural bull move resumed.
Furthermore, the geopolitical impact on gold is rarely straightforward, as multiple macro variables interact simultaneously to either amplify or dampen price responses to conflict-related news.
The Oil Price Transmission Channel
The relationship between Middle East conflict, oil prices, and gold is neither direct nor clean. When conflict threatens energy supply routes, oil prices rise. Higher oil prices feed into broader inflation expectations, which in theory supports gold as a safe-haven and an inflation hedge. However, the same inflationary pressure forces central banks to consider maintaining or extending restrictive monetary policy, which keeps real yields elevated and reduces gold's relative attractiveness versus yield-bearing assets.
| Oil Price Scenario | Inflation Expectation Impact | Central Bank Policy Response | Net Effect on Gold |
|---|---|---|---|
| Sharp oil price surge | Inflation forecasts rise materially | Rates held higher or hiked | Mixed: hedging demand versus yield drag |
| Oil price moderation | Inflation pressures ease gradually | Rate cuts become more probable | Broadly constructive for gold |
| Oil collapse on ceasefire | Disinflation signals strengthen | Rate cut path accelerates | Conditionally positive, but geopolitical premium fades |
The World Gold Council has noted a shift in market conditions from the first quarter of 2026, with a meaningful reduction in volatility levels even as underlying tensions in the Middle East persisted. The increased participation of investors in gold demand over the prior eighteen months was identified as a defining feature of the current cycle, differentiating it from earlier geopolitically-driven moves where speculative positioning was dominant.
What Major Institutions Are Forecasting for Gold Through 2026
Goldman Sachs: The Structural Demand Bull Case
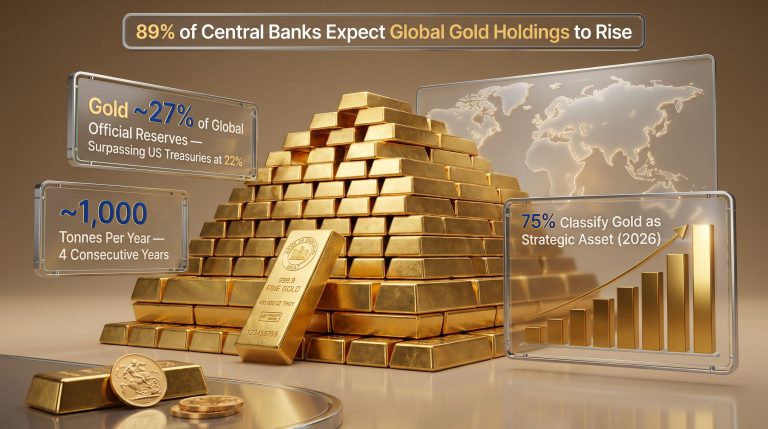
Goldman Sachs maintains a year-end 2026 gold price target of US$5,400 per troy ounce, anchored not in geopolitical speculation but in official-sector buying behaviour. The bank projects central bank gold demand will average 60 tonnes per month throughout CY26, a pace that represents historically elevated sovereign accumulation.
The significance of this demand source is that it is largely insensitive to short-term price fluctuations or geopolitical noise cycles. Central banks accumulating gold as part of a reserve diversification strategy are not timing entries based on technical analysis or conflict calendars. Their buying is driven by multi-year strategic mandates, making it the most durable pillar of the current bull case.
JPMorgan: Near-Term Caution, Long-Term Ambition
JPMorgan's forecasting position is internally layered. The bank revised its average CY26 gold price forecast downward to US$5,243 per ounce from a prior estimate of US$5,708 per ounce, acknowledging near-term headwinds including dollar resilience and recalibrated expectations around the pace of rate reductions. However, its longer-term trajectory remains ambitious, with gold prices potentially approaching US$6,000 per ounce by year-end 2026 under favourable conditions.
The downward near-term revision is instructive. It reflects a market reality in which the transition from anticipated rate cuts to a higher-for-longer or even rate hike scenario has meaningfully altered the short-term calculus for Western gold allocation.
UBS: Tempered but Still Constructive
UBS reduced its year-end 2026 gold price forecasts from US$5,900 to US$5,500 per ounce, citing persistent macro headwinds and the risk that inflation remains stickier than previously modelled. Despite the downward revision, the Swiss bank's target still implies meaningful upside from current levels. The direction of the revision, however, signals growing institutional caution about the pace of appreciation rather than a fundamental reversal of the bull thesis.
| Institution | CY26 Year-End Target | Key Demand Driver | Recent Revision |
|---|---|---|---|
| Goldman Sachs | US$5,400/oz | Central bank buying (60t/month avg.) | Maintained |
| JPMorgan | ~US$6,000/oz (long-term); US$5,243/oz avg. | Structural demand plus geopolitical factors | Near-term downgraded |
| UBS | US$5,500/oz | Safe-haven demand offset by macro headwinds | Downgraded from US$5,900 |
Three Scenario Pathways for Gold Through Year-End 2026
Scenario One: Contained Conflict and Gradual Consolidation
If Middle East hostilities remain geographically contained and do not materially disrupt energy supply routes, gold is likely to enter a consolidation phase. Oil prices would stabilise, inflation expectations would moderate gradually, and the Federal Reserve's policy path would become more predictable. Under these conditions, gold's geopolitical risk premium would partially deflate, but central bank accumulation would limit downside severity.
- Indicative price range: US$4,400 to US$4,900 per ounce
- Primary risk: Continued equity market resilience diverting capital away from defensive assets
- Key support mechanism: Ongoing central bank purchases absorbing Western profit-taking flows
Scenario Two: Escalation Spiral and Safe-Haven Surge
A broadening of the conflict beyond current boundaries, particularly any disruption to major energy transit infrastructure, would materially increase the geopolitical risk premium embedded in gold pricing. Under this scenario, risk-off sentiment would intensify globally, institutional forecasts at the upper end of the range would become achievable, and gold could test or breach recent highs. For instance, recent reporting from Yahoo Finance highlighted gold touching US$5,400 as safe-haven demand surged amid escalating Iran-related tensions, illustrating how quickly price levels can shift during conflict spikes.
- Indicative price range: US$5,000 to US$5,500 per ounce and above
- Primary offset risk: US dollar strengthening in a risk-off environment partially cancelling gold's safe-haven gains
- Key catalyst watch: Energy corridor disruptions and regional conflict expansion beyond current boundaries
Scenario Three: The Stagflationary Trap
The most analytically challenging scenario for gold investors involves elevated oil prices from conflict-related supply pressures coinciding with a strengthening US dollar and Federal Reserve signals of extended rate holds or hikes. In this environment, gold would be simultaneously supported by inflation hedging demand and capped by yield and dollar headwinds, producing frustrating range-bound price action without a clear directional trend.
"This scenario removes the clean directional narrative that makes gold positioning straightforward. Investors face the uncomfortable reality of an asset that is supported enough to prevent sharp declines but constrained enough to frustrate breakout strategies."
- Indicative price range: US$4,500 to US$5,100 per ounce (wide range, non-trending)
- Primary driver of difficulty: Western investors reducing allocations as real yields remain positive
- Key risk amplifier: Eastern accumulation alone insufficient to drive sustained price breakouts
| Time Horizon | Contained Conflict | Escalation Scenario | Stagflationary Trap |
|---|---|---|---|
| 1 Week | US$4,600–US$4,750 | US$4,800–US$5,000 | US$4,400–US$4,600 |
| 1 Month | US$4,500–US$4,900 | US$5,000–US$5,300 | US$4,300–US$4,700 |
| 3 Months | US$4,700–US$5,200 | US$5,300–US$5,500+ | US$4,400–US$5,000 |
The East-West Investor Divide: A Structural Feature of the Current Cycle
Why Western and Eastern Investors Are Behaving Differently
One of the most important and underappreciated dynamics in current gold markets is the structural divergence between Western and Eastern investor behaviour. Understanding this divide is essential for accurate price forecasting and explains why gold has not experienced the sharp sustained corrections that historical models might predict.
Western institutional and retail investors have demonstrated a consistent pattern of profit-taking during periods of elevated gold prices, particularly when equity markets remain resilient. The shift in monetary policy expectations from anticipated rate cuts toward a higher-for-longer or potential rate hike scenario has reduced the urgency of gold allocation for yield-sensitive Western portfolios. This behaviour was highlighted in World Gold Council commentary, which noted that Western investors' profit-taking has been a recurring feature of the past eighteen months of trading.
Eastern investors, by contrast, including retail buyers across Asia and sovereign wealth and central bank entities across emerging markets, have maintained consistent accumulation patterns largely independent of short-term price levels. The de-dollarisation thesis, which holds that emerging market central banks are systematically diversifying away from US dollar reserves, provides a strategic rationale for gold accumulation that is structurally insensitive to price noise.
The Ratchet Effect: How Divergent Behaviour Creates Price Floors
The East-West split creates what functions as a ratchet mechanism in gold markets. When Western profit-taking pushes prices lower during peaks, Eastern buying absorbs the selling pressure and establishes a new, higher price floor. Over repeated cycles, this produces a stepwise appreciation pattern rather than the sharp boom-bust volatility that characterised earlier commodity supercycles.
This mechanism helps explain why even the most significant near-term headwinds identified by institutional analysts, including dollar strength, positive real yields, and moderating geopolitical tensions, have not translated into structural price reversals. Consequently, analysts tracking the gold price forecast amid Middle East conflict must account for this structural demand architecture when modelling downside scenarios.
The next major ASX story will hit our subscribers first
The Four Variables That Will Determine Gold's Next Move
Investors navigating the current environment should focus monitoring effort on these four critical indicators:
-
Conflict geographic scope: Any escalation beyond current boundaries, particularly involving energy transit infrastructure, would materially rebuild the geopolitical risk premium. Credible de-escalation progress would likely trigger a correction, but central bank demand should limit its severity.
-
Federal Reserve policy signals and real yield movements: The transition from rate cut expectations to inflation-driven rate holds or hikes represents the most significant near-term headwind. Core PCE inflation releases, Fed meeting minutes, and real yield curve movements are the most reliable leading indicators.
-
US Dollar Index trajectory: A strengthening dollar directly compresses gold's USD price and reduces purchasing power advantages for non-US buyers. Dollar weakness from fiscal concerns or shifting reserve preferences would provide meaningful tailwinds.
-
Central bank purchase data: Monthly official-sector buying volumes from World Gold Council and IMF reporting represent the most structurally significant demand signal. Any material deviation from the projected 60-tonne monthly average would require recalibration of institutional price forecasts.
Frequently Asked Questions on Gold and Middle East Conflict
Why does gold sometimes fall when Middle East tensions rise?
Gold's response to escalation events is mediated by competing macro forces. When escalation simultaneously strengthens the US dollar, which is a common risk-off response in global markets, the inverse relationship between the dollar and gold can offset or overwhelm safe-haven buying pressure. Resilient equity markets further reduce the urgency of defensive asset rotation that a pure geopolitical risk model would predict. Analysis from FX Street on safe-haven demand provides additional context on how these competing forces have played out during recent Iran-related conflict episodes.
What is the single biggest long-term risk to the gold bull case?
A decisive and sustained slowdown in central bank buying behaviour represents the most significant structural downside risk. If official-sector purchases fall materially below the projected 60-tonne monthly average due to reserve adequacy, fiscal constraints, or a reversal of de-dollarisation trends, the structural demand floor underpinning major institutional price targets would weaken considerably. A prolonged period of positive US real yields compounding this effect would represent a genuine structural headwind rather than a cyclical one.
Does inflation always support gold prices?
Inflation's relationship with gold is context-dependent. Rising inflation from supply-side shocks such as energy price surges supports gold as a purchasing power hedge. However, if the same inflationary pressure forces central banks to extend or intensify monetary tightening, the resulting increase in real yields reduces gold's relative attractiveness compared with yield-bearing assets. This creates the paradox at the heart of the stagflationary trap scenario: gold is simultaneously supported and capped by the same macro force.
The Structural Case Remains Intact Despite Near-Term Noise
The convergence of central bank accumulation at historically elevated rates, persistent de-dollarisation trends across emerging market sovereign portfolios, and genuine structural inflation uncertainty creates a durable demand architecture that supports the multi-year gold bull thesis. Short-term volatility driven by Middle East conflict cycles creates noise in the price signal but does not fundamentally alter these structural demand foundations.
The institutional consensus, despite the divergence in specific price targets, points toward meaningful upside from current levels through year-end 2026. Goldman Sachs at US$5,400, JPMorgan approaching US$6,000, and UBS at US$5,500 represent a range that, even at the lower bound, implies substantial appreciation from the mid-2026 price of US$4,732 per ounce.
For investors, the key takeaways from the current environment are:
- Geopolitical risk premium is real but unreliable as a standalone price driver and must be evaluated within the broader macro context
- Central bank demand at approximately 60 tonnes per month represents the most durable and structurally significant support mechanism currently operating in gold markets
- The East-West investor divide creates price floor ratchet dynamics that limit downside severity during correction phases
- Scenario awareness is more valuable than point forecasts given genuine uncertainty across geopolitical, monetary policy, and currency variables
- Volatility-driven corrections may represent accumulation opportunities for investors aligned with the structural bull thesis over a multi-year horizon
For Australian investors seeking broader context on gold market developments and ASX-listed resources sector movements, The Market Online provides complementary market reporting covering commodity price dynamics and mining sector news relevant to the Australian investment landscape.
This article is intended for informational and educational purposes only and does not constitute financial or investment advice. All price forecasts referenced reflect publicly available institutional research as of May 2026. Past performance is not indicative of future results. Readers are encouraged to conduct independent research and consult a certified financial adviser before making any investment decisions.
Want to Capitalise on the Next Major ASX Gold Discovery Before the Broader Market?
Discovery Alert's proprietary Discovery IQ model delivers real-time alerts on significant ASX mineral discoveries, instantly converting complex geological and commodity data into actionable investment insights — so subscribers can act on emerging opportunities the moment they are announced. Explore historic discoveries and the returns they generated, then begin a 14-day free trial to secure a market-leading edge in the ASX resources sector.