June 21, 2026
When Diplomacy Moves Markets: Understanding the Gold-Oil Divergence
Commodity markets rarely move in neat, predictable patterns, but occasionally a single geopolitical event creates a chain reaction visible across asset classes simultaneously. The announcement of a structured interim agreement between the United States and Iran in June 2026 produced exactly this kind of cascading effect — gold climbs as oil drops on U.S.-Iran interim deal, sending crude benchmarks sharply lower while precious metals advanced. Understanding why these two asset classes moved in opposite directions requires examining energy supply chains, central bank policy transmission, and the behavioural patterns of institutional traders during geopolitical transitions.
When big ASX news breaks, our subscribers know first
The Architecture of the U.S.-Iran Interim Agreement
What the 14-Point Framework Actually Contains
The agreement released in mid-June 2026 is not a permanent peace treaty. It is a structured ceasefire extension built on a 14-point framework that expands an earlier April 2026 ceasefire by an additional 60 days, creating a negotiating window for both sides to work toward a final truce. The agreement covers all active military fronts, including operations in Lebanon, and includes provisions for Iran to regain access to frozen assets and resume oil sales under defined conditions.
Pakistani Prime Minister Shehbaz Sharif served as the primary mediator throughout the negotiation process, a detail carrying significant geopolitical weight. Pakistan's involvement reflects the multilateral diplomatic architecture required to bridge U.S.-Iranian mistrust. Furthermore, the decision to formally sign the agreement in Switzerland on June 19 underscores the preference for neutral, internationally recognised territory as a backdrop for high-stakes commitments.
The Diplomatic Timeline and Its Market Significance
The sequence of events matters as much as the outcome itself. Markets had already partially priced in elevated geopolitical risk over the preceding three months of active conflict. When the formal agreement text was released on Wednesday, June 18, it triggered an immediate repricing across energy and safe-haven markets. In addition, the announcement included plans to clear mines from the Strait of Hormuz, with reopening scheduled for Friday, June 19 — a development with direct consequences for global crude supply logistics. For broader context on the gold geopolitical drivers that shape these market movements, the interplay between diplomacy and bullion pricing is well-established.
How Does a Peace Deal Send Oil Prices Lower?
The Strait of Hormuz as a Global Energy Chokepoint
The Strait of Hormuz is the world's single most consequential energy transit corridor. Approximately 20% of global petroleum liquids and a significant share of liquefied natural gas exports pass through this narrow waterway connecting the Persian Gulf to the Arabian Sea. When the strait is disrupted — whether through conflict, mining, or blockades — the resulting supply uncertainty is immediately absorbed into crude futures pricing as a geopolitical risk premium.
Over the three months of U.S.-Iran hostilities that preceded the interim agreement, this risk premium had accumulated substantially in oil benchmarks. Once the ceasefire framework was confirmed and mine-clearing operations were announced, that premium began to unwind rapidly. This dynamic is explored in detail across oil geopolitics analysis resources covering how conflict escalation and resolution reshape energy markets.
Crude Benchmark Declines: The Numbers
| Crude Benchmark | Pre-Deal Estimated Level | Post-Deal Level | Approximate Change |
|---|---|---|---|
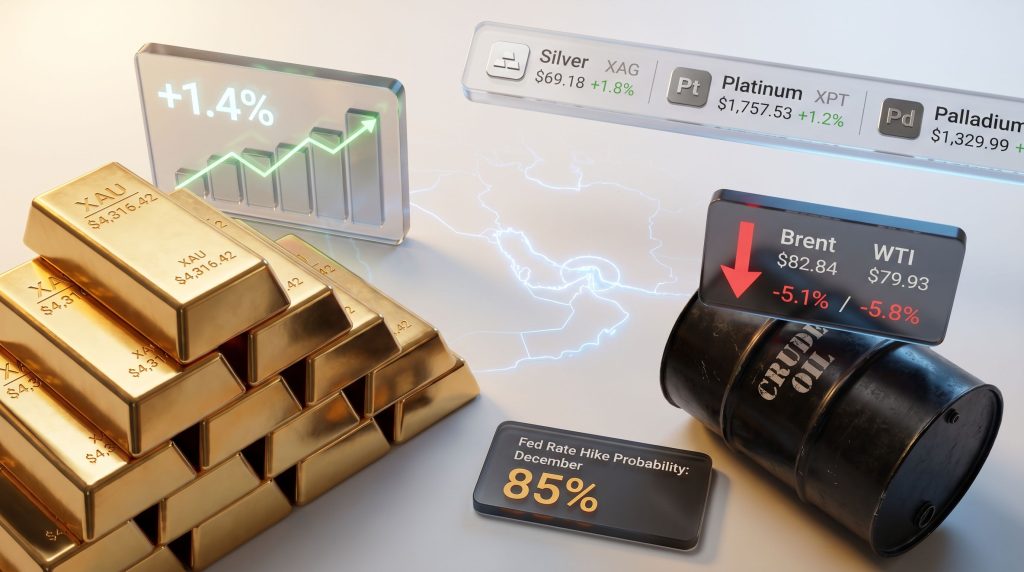
| Brent Crude Futures | ~$87.30/barrel | $82.84/barrel | -5.1% |
| WTI Crude (U.S.) | ~$84.80/barrel | $79.93/barrel | -5.8% |
The scale of these declines reflects not just the immediate supply outlook but also the repricing of inflation expectations. When energy costs fall sharply, the downstream inflation pressure that flows through transportation, manufacturing, and consumer goods pricing eases in parallel. This is the transmission channel that connects falling oil to rising gold.
The Oil-Inflation-Rate Hike Transmission Chain
The logic behind this cross-asset relationship follows a clear sequence:
- Oil prices fall as geopolitical supply risk is removed from energy markets.
- Energy-driven inflation expectations ease, reducing the perceived need for central bank intervention.
- Rate hike probability decreases, or at minimum, the pace of expected tightening slows.
- The opportunity cost of holding gold declines, as yield-bearing assets become relatively less attractive.
- Gold becomes more appealing to both institutional and retail investors, supporting price gains.
This transmission mechanism is well-documented in commodity economics. Gold's non-yielding nature means its relative attractiveness is highly sensitive to interest rate expectations. When those expectations shift downward, even modestly, bullion often benefits disproportionately in the short term.
Gold's 1.4% Recovery: Dissecting the Rally
Short-Covering as the Primary Mechanical Driver
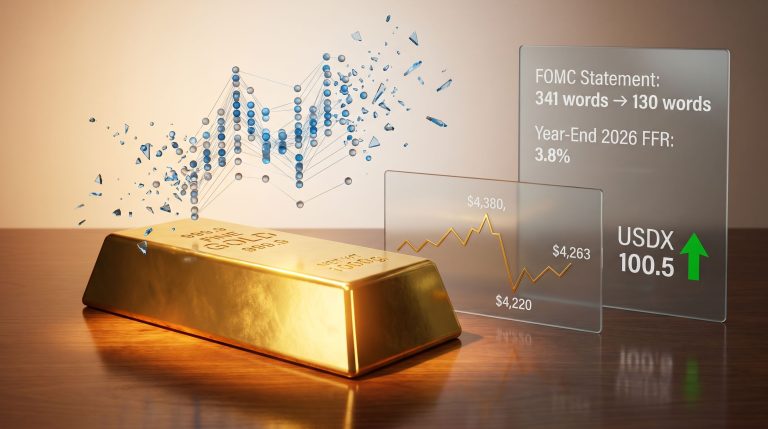
Spot gold advanced 1.4% to $4,316.42 per ounce as of early morning trading on June 19, 2026 (0242 GMT), recovering from a 1.7% decline in the prior session. August gold futures were quoted at $4,336.70 per ounce, a level modestly above spot that reflects a standard contango structure, where deferred delivery contracts price in carrying costs and near-term uncertainty.
The initial catalyst for the recovery was technical in nature. Wednesday's steep sell-off had driven speculative short positions to elevated levels. When positive diplomatic news emerged, traders who had bet on continued weakness were forced to cover those positions quickly. Senior market analysis from OANDA described this dynamic as a combination of short position unwinding following the prior day's sharp decline and renewed optimism generated by Middle East diplomatic progress — two forces that converged within a single trading session.
According to reporting from Reuters, the ceasefire extension itself played a pivotal role in stabilising bullion sentiment, confirming that diplomatic progress was being closely monitored by precious metals traders.
Reading the Chart: Three Consecutive Sessions of Gains
The June 19 advance extended gold's winning streak to three consecutive sessions and pushed prices to their highest level since June 9. For institutional chart analysts, this type of recovery from a well-defined support level — accompanied by improving fundamental catalysts — often signals that a prior downtrend is losing momentum.
Key price levels for traders to monitor:
- $4,316.42 as the June 19 spot reference point.
- The June 9 high as overhead resistance for any continued rally.
- The prior session low as near-term support in the event of renewed selling pressure.
The Federal Reserve Variable: Why Rate Expectations Cap Gold's Upside
The Fed's June 2026 Decision and the Dot Plot Shift
The Federal Reserve held its benchmark rate unchanged at 3.50%–3.75% following its June 2026 meeting, but the accompanying projections introduced a meaningful hawkish signal. Nine of the central bank's 19 policymakers indicated they believe a rate increase will be necessary before year-end, a shift that immediately altered market expectations for the December 2026 meeting.
| Fed Indicator | Pre-Decision Reading | Post-Decision Reading |
|---|---|---|
| Rate Hike Probability (December) | 61% | 85% |
| Fed Funds Rate Range (Current) | 3.50%–3.75% | 3.50%–3.75% (held) |
| Policymakers Favouring Hike | Not disclosed | 9 of 19 |
Source: CME FedWatch Tool, Federal Reserve June 2026 projections
The jump from a 61% to 85% probability of a December rate hike is not trivial. Markets had been operating with a relatively benign rate outlook prior to the Fed decision. The projection update forced a rapid repricing of the interest rate curve, which directly affects gold's medium-term trajectory. The relationship between gold and bond dynamics further illustrates how shifts in rate expectations ripple through to bullion valuations.
Why Higher Rate Expectations Create a Structural Ceiling for Gold
Gold produces no cash flow. It pays no dividend and offers no yield. Its appeal rests primarily on its function as a store of value, an inflation hedge, and a gold safe-haven demand asset during periods of uncertainty. When interest rates rise, the yield available from cash, bonds, and money market instruments increases, making the decision to hold a non-yielding asset like gold relatively more costly in opportunity terms.
Strategic Warning: Investors should be careful to distinguish between the short-term diplomatic catalyst driving gold's current bounce and the structural monetary policy headwind that will likely cap further gains. An 85% probability of a December rate hike represents a meaningful constraint on bullion's medium-term upside, regardless of near-term geopolitical tailwinds.
Market commentary in the wake of the Fed's June decision reflected this tension directly, noting that gold prices were expected to remain constrained on the upside as market participants repriced the probability of the Federal Reserve initiating a rate-hike cycle. This creates a binary dynamic: short-term support from geopolitical resolution, offset by medium-term pressure from monetary policy normalisation.
The Broader Precious Metals Complex
How Silver, Platinum, and Palladium Responded
The gold-driven rally extended across the entire precious metals sector, though not uniformly. Silver notably outperformed on a percentage basis, which is consistent with silver's dual role as both a monetary metal and an industrial commodity.
| Metal | Spot Price | Session Move |
|---|---|---|
| Gold (XAU) | $4,316.42/oz | +1.4% |
| Silver (XAG) | $69.18/oz | +1.8% |
| Platinum (XPT) | $1,757.53/oz | +1.2% |
| Palladium | $1,329.99/oz | +1.3% |
Why Silver Outpaced Gold
Silver's larger percentage gain warrants specific attention. Unlike gold, which derives the majority of its value from monetary and safe-haven demand, silver carries a significant industrial demand component. It is a critical input in solar panel manufacturing, electronics, and electric vehicle components. When geopolitical tensions ease and the economic outlook improves, silver consequently benefits from two simultaneous tailwinds:
- The same monetary tailwind that supports gold as rate hike fears moderate.
- An additional industrial demand premium as growth expectations improve following conflict resolution.
This dual sensitivity to both safe-haven and industrial demand cycles makes silver structurally more volatile than gold during geopolitical transitions, often producing larger percentage moves in both directions during inflection points. As noted in analysis from Gold Eagle, both gold and silver firmed meaningfully as the Iran deal cooled crude oil prices, reinforcing this behavioural pattern.
The next major ASX story will hit our subscribers first
Geopolitical Risk Premium: Pricing War, Pricing Peace
How Three Months of Conflict Distorted Commodity Markets
When military conflict directly threatens critical energy infrastructure or supply routes, commodity markets build a risk premium into prices that reflects the probability of supply disruption multiplied by its potential severity. Over the three months of U.S.-Iran hostilities preceding the interim agreement, this premium became embedded across multiple asset classes, distorting energy prices, inflation expectations, and by extension, central bank policy outlooks.
The unwinding of this premium following the ceasefire announcement is a textbook example of what traders call a risk-off unwind — where assets that had appreciated specifically due to uncertainty give back gains as that uncertainty recedes. Oil was the primary beneficiary of conflict-driven premium accumulation, and therefore the primary casualty of its removal.
Cross-Asset Signals: Stocks, the Dollar, and Commodities
The diplomatic resolution produced a coordinated cross-asset response. U.S. stock futures rallied as geopolitical uncertainty receded, reflecting improved risk appetite. The U.S. dollar showed relative softness, which historically provides an additional tailwind for gold since bullion is priced in dollars and becomes cheaper for foreign buyers when the currency weakens.
Scenario Analysis:
If the interim deal holds and transitions to a permanent truce: Oil prices could stabilise at lower levels, inflation expectations remain anchored, and the Federal Reserve may adopt a more measured pace of rate increases — providing a modestly supportive environment for gold in the near term, though the 85% December hike probability remains a headwind.
If the deal collapses and military operations resume: Energy supply disruptions would reignite inflation fears, crude prices would spike, and gold would face competing pressures between safe-haven demand and the higher rate environment that elevated oil prices tend to generate.
Strategic Investment Considerations for Precious Metals Positioning
Distinguishing Tactical from Structural Drivers
Professional portfolio managers typically approach precious metals positioning during geopolitical transitions by separating short-cycle drivers from longer-duration structural forces. The current environment presents both:
Short-term tactical support:
- Diplomatic resolution reducing energy supply risk premium.
- Short-covering mechanics amplifying near-term price recovery.
- Dollar softness providing a secondary bullion tailwind.
Medium-term structural constraints:
- Rising Federal Reserve rate hike probability limiting gold's ceiling.
- Easing inflation expectations reducing the urgency of inflation-hedge positioning.
- Potential for further diplomatic volatility if the interim agreement faces challenges.
The Role of Gold in a Shifting Inflation Regime
One nuanced consideration for investors is that gold's inflation-hedging thesis shifts in character as the source of inflation changes. When inflation is primarily energy-driven — as it was during the conflict period — falling oil prices can rapidly reduce the urgency of holding gold as an inflation hedge.
However, if inflation transitions to become more monetary in origin, driven by sustained money supply growth or fiscal deficits rather than commodity prices, gold's protective characteristics become more durable and less sensitive to short-term energy price movements. This distinction matters for medium-term allocation decisions. Investors who hold gold primarily as an energy-inflation hedge may find the current environment less compelling than those holding it as a monetary debasement hedge.
Frequently Asked Questions
Why did gold rise when a peace deal was announced?
The resolution of Middle East hostilities caused oil prices to fall sharply, reducing inflation expectations. Lower anticipated inflation reduces the likelihood of aggressive Federal Reserve rate increases, which in turn lowers the opportunity cost of holding gold as a non-interest-bearing asset — making bullion more attractive to investors seeking real store-of-value exposure.
What is the Strait of Hormuz and why does it affect oil prices?
The Strait of Hormuz is one of the world's most strategically critical energy transit corridors, through which a significant portion of global oil and liquefied natural gas exports flow daily. Any disruption to this waterway through conflict, mining, or blockades creates immediate supply uncertainty and drives crude prices higher by embedding a geopolitical risk premium into futures markets.
What does the Federal Reserve's rate decision mean for gold's outlook?
The Fed held its benchmark rate at 3.50%–3.75% in June 2026 but signalled that nine of its 19 policymakers favour a rate increase before year-end. Markets now price an 85% probability of a December rate hike, which constrains gold's upside by increasing the relative attractiveness of yield-bearing assets compared to non-yielding bullion.
How long does the U.S.-Iran interim agreement last?
The current framework extends an earlier April ceasefire by 60 days, creating a structured negotiating window for both parties to work toward a permanent truce. The agreement covers all active military fronts, including Lebanon, and includes provisions relating to Iranian oil sales and frozen asset access.
Why did silver outperform gold in this session?
Silver carries a dual identity as both a monetary metal and an industrial commodity. When geopolitical tensions ease and economic growth prospects improve, silver benefits from both the safe-haven dynamic that supports gold and an additional industrial demand tailwind — often consequently producing larger percentage moves than gold during short-term inflection points.
Key Takeaways
- The U.S.-Iran interim agreement triggered a 5.1%–5.8% collapse in crude oil benchmarks, removing a substantial geopolitical risk premium from energy markets.
- Furthermore, gold climbs as oil drops on U.S.-Iran interim deal saw spot bullion recover 1.4% to $4,316.42 per ounce, driven by short-covering mechanics and reduced near-term inflation expectations, extending gains to a third consecutive session.
- The Strait of Hormuz mine-clearing and reopening process represents the single most consequential logistical development for global energy supply chains.
- Federal Reserve rate hike probability for December jumped from 61% to 85% following the June 2026 policy meeting, introducing a structural constraint on gold's medium-term upside regardless of geopolitical tailwinds.
- The entire precious metals complex rallied in sympathy, with silver (+1.8%) leading on a percentage basis due to its dual monetary and industrial demand exposure.
- Investors must carefully distinguish between short-term tactical catalysts driving the current precious metals recovery and the medium-term monetary policy headwinds that will likely limit the duration and magnitude of any sustained rally.
This article is intended for informational purposes only and does not constitute financial advice. All price references reflect data as reported by CNBC and Reuters as of June 18–19, 2026. Past market behaviour is not indicative of future outcomes. Investors should conduct their own due diligence before making any investment decisions.
Want to Stay Ahead of the Next Major Mineral Discovery?
While geopolitical shifts drive gold and precious metals prices, the real opportunity often lies in identifying significant ASX mineral discoveries the moment they are announced — and that's exactly what Discovery Alert delivers, powered by its proprietary Discovery IQ model, converting complex discovery data into actionable insights for both traders and long-term investors. Explore historic discoveries and their extraordinary returns to understand what's possible, then begin your 14-day free trial to ensure you're positioned ahead of the market.