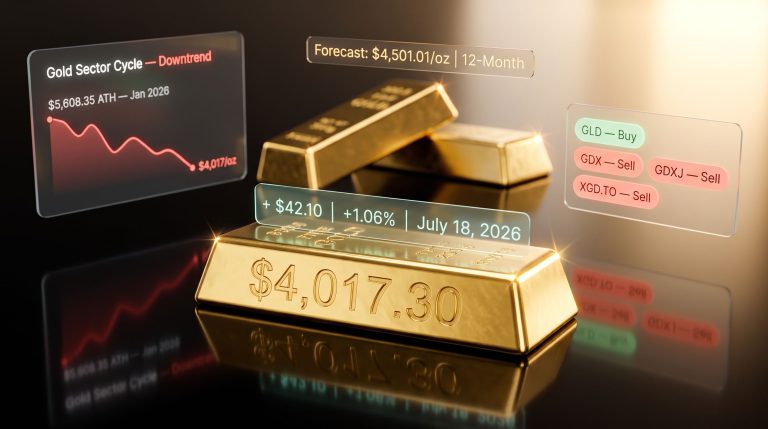
July 19, 2026
The Mechanics Behind Gold's Multi-Year Bull Market: Understanding What's Really Driving Prices
Precious metals markets operate on a set of forces that most casual observers misread entirely. The reflexive assumption that gold rises whenever conflict breaks out, or falls when stock markets recover, obscures a far more intricate system of interacting variables. Real yields, currency dynamics, sovereign debt trajectories, and structural shifts in institutional behaviour are the actual engines of gold price momentum amid geopolitical headwinds. Geopolitical events, while capable of amplifying shorter-term moves, are better understood as accelerants applied to an already burning fire rather than the ignition source itself.
This distinction matters enormously for investors trying to assess whether gold's extraordinary performance over recent years reflects durable fundamentals or a temporary risk premium that could evaporate once tensions ease. The evidence, when examined across supply, demand, monetary policy, and investor behaviour simultaneously, points decisively toward the former.
When big ASX news breaks, our subscribers know first
Why 2025 Became a Watershed Moment for Gold Investors
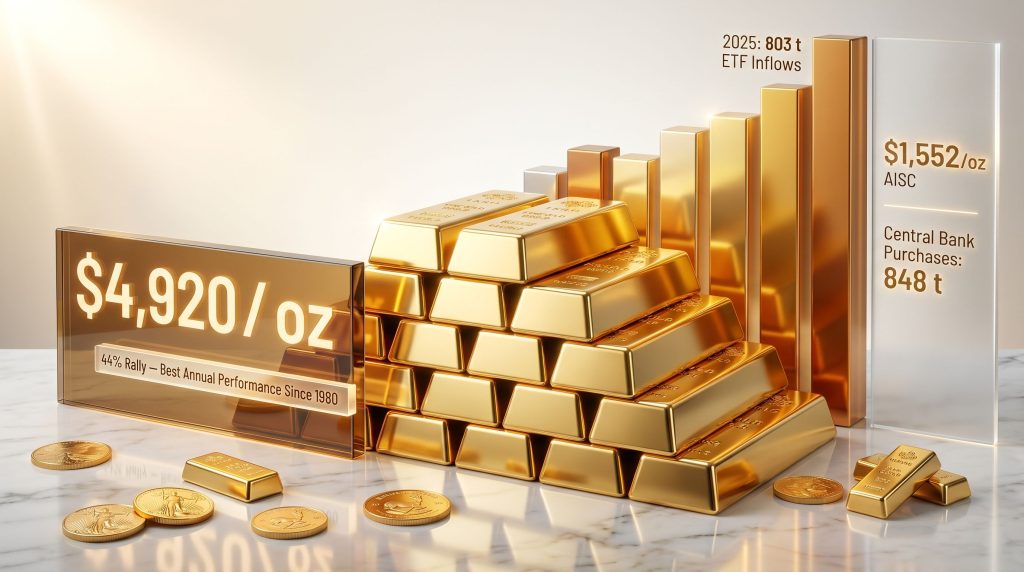
Gold's 44% price rally in 2025 was the metal's strongest annual performance since 1980, a fact that immediately raises a critical question: was this an outlier or a confirmation of a structural shift? The answer requires looking beyond the headline number.
Four macro pillars converged to produce that result, and notably, none of them have been resolved heading into 2026:
- Monetary policy uncertainty: Persistent questions about the Federal Reserve's independence and its willingness to maintain restrictive policy amid fiscal pressure created an environment where fixed-income alternatives lost credibility as portfolio anchors.
- Sovereign debt concerns: The trajectory of U.S. fiscal deficits continued to expand, raising long-term questions about dollar-denominated asset reliability that extend well beyond any single administration's policy cycle.
- Dollar weakness: A softening U.S. dollar made gold cheaper in local currency terms across major consuming nations, broadening demand at precisely the moment global investor appetite was already elevated.
- Investor behaviour shifts: The composition of who is buying gold, and why, changed materially, with physical investment overtaking jewellery fabrication as the dominant demand category for the first time on record.
Understanding 2025's gold rally requires recognising that geopolitical risk was a catalyst layered on top of pre-existing structural demand, not the foundational reason for the move. The underlying architecture was already in place.
How Interest Rates, Real Yields, and Dollar Direction Actually Shape Gold Prices
The Interest Rate Transmission Mechanism
Gold is a non-yielding asset, which means its opportunity cost rises and falls in direct response to what investors can earn elsewhere. When real yields (nominal interest rates minus inflation expectations) are high and rising, the cost of holding gold increases relative to bonds, typically suppressing demand. When real yields are low, negative, or declining, the inverse logic applies and gold becomes more attractive on a comparative basis.
This mechanism explains why the Federal Reserve's rate path carries more predictive weight for gold prices than most geopolitical events. A central bank pivot toward easing, or even credible signals of future cuts, can ignite gold buying long before any actual rate change occurs. Furthermore, understanding gold and bond dynamics helps investors contextualise why these rate shifts produce such powerful and sustained price responses.
Dollar Dynamics and Their Inverse Relationship With Gold
Gold is priced globally in U.S. dollars, creating a well-documented inverse relationship: a stronger dollar makes gold more expensive for international buyers, compressing demand, while a weaker dollar has the opposite effect. This linkage is not perfectly linear, as was demonstrated in 2025 when gold rallied alongside periods of dollar strength, suggesting that other factors were powerful enough to override the traditional correlation.
When Geopolitics Moves the Needle and When It Doesn't
Geopolitical tensions influence gold prices most powerfully when they alter inflation expectations, weaken the dollar, or prompt central banks to shift monetary policy. Conflicts that push energy prices higher and sustain elevated interest rates can paradoxically act as headwinds for gold by keeping real yields elevated and compressing the household disposable incomes that typically fund retail bar and coin purchases.
This is precisely the dynamic observed in early 2026, where Middle East conflict-driven oil price increases dampened momentum in several key physical gold markets rather than extending it. According to recent analysis on geopolitical headwinds, the relationship between conflict and gold pricing is far more nuanced than headline coverage typically suggests.
The Supply Side: Modest Growth Concealing Rising Structural Costs
Global Mine Production Trends
Mine production data from 2025 reveals a market that is growing but not racing ahead. Global output rose by 2% year-on-year to 3,817 tonnes, driven by a combination of new mine openings, capacity expansions at existing operations, and increased artisanal and small-scale mining activity. The 2026 forecast calls for a further 2.4% increase to approximately 3,907 tonnes, though that growth will not be evenly distributed.
| Region | 2025 Output Trend | 2026 Forecast |
|---|---|---|
| Global Total | +2% YoY to 3,817 t | +2.4% YoY to 3,907 t |
| Oceania | Declining | Continued contraction |
| Europe | Declining | Continued contraction |
| All Other Regions | Growth | Strengthening output |
The regional divergence is worth examining more closely. Oceania and Europe are both contracting, reflecting a combination of mature ore body depletion, escalating operating costs, and increasingly complex permitting environments. This structural decline in historically significant producing regions shifts the supply growth burden toward jurisdictions that carry their own set of operational and political risk profiles.
The All-In Sustaining Cost Surge Reshaping Mine Economics
Perhaps the most underappreciated supply-side development of 2025 was the 12% year-on-year increase in global all-in sustaining costs (AISC) to $1,552 per ounce. AISC is the industry's comprehensive cost benchmark, capturing not just direct mining costs but also sustaining capital expenditure, royalties, and corporate overheads. A 12% single-year increase is significant.
The primary cost drivers were royalty escalation in key jurisdictions and broad inflationary pressure flowing through labour, energy, and consumables categories. For mid-tier producers operating with thinner margins, this cost inflation compresses the economic buffer between operating costs and prevailing gold prices. It also raises the floor price below which new project development becomes economically unattractive, providing a long-term structural price support mechanism that is often overlooked in shorter-term analysis.
Recycling Supply: A 13-Year High That Tells an Interesting Story
Global gold recycling reached 1,404 tonnes in 2025, a 13-year high, despite gold prices sitting at record annual averages. At first glance, this seems paradoxical: why would record prices not trigger even more scrap selling? The answer reveals something important about the current holder psychology.
European scrap supply drove the majority of recycling gains, while South Asian markets notably underperformed, a divergence likely reflecting different cultural relationships with gold as a store of value. In South Asia, gold is frequently retained across generations as financial insurance, making holders more resistant to price-motivated selling than Western counterparts.
Scrap supply for 2026 is forecast to rise by a further 5.1% year-on-year, but structural constraints will limit the magnitude. Low near-market stock levels and strong safe-haven retention motivations among existing holders act as natural caps on how much recycled material can enter the market, even at record prices.
Official Sector Demand: Reading the 2025 Decline Correctly
Net central bank gold purchases fell to 848 tonnes in 2025, representing a 22% decline from 2024 and a four-year low. This figure requires careful contextualisation rather than alarm. In addition, central bank demand patterns from 2025 suggest the diversification trend is firmly intact despite the headline decline.
The 2025 official sector figure of 848 tonnes remains materially above pre-2022 purchasing norms, confirming that the structural shift by sovereign institutions toward gold diversification remains intact. The decline reflects portfolio rebalancing after three consecutive years of purchases exceeding 1,000 tonnes, not a reversal of strategic intent. (Metals Focus, 2026)
The geographic distribution of buying continued to reflect a de-dollarisation undercurrent, with purchases spread broadly across emerging market central banks that have been systematically reducing their exposure to U.S. dollar-denominated reserves. U.S. policy uncertainty provided additional motivation for reserve managers already inclined toward diversification to accelerate their reallocation timelines.
Sales were concentrated among a small number of countries and primarily reflected tactical portfolio rebalancing following the price rally rather than any fundamental reassessment of gold's role in official reserve management.
The Historic Demand Architecture Shift: Physical Investment Takes the Crown
Physical Investment Reaches a 12-Year High
Physical gold investment rose 16% in 2025 to a 12-year high, and the implications extend beyond the headline number. Gold coins and bars are now projected to surpass jewellery as the dominant demand category for the first time ever recorded, representing a fundamental restructuring of who drives gold market dynamics and why.
Country-level performance within this category was notable:
- China led bar and coin demand growth at +28%, reflecting both domestic economic uncertainty and a cultural pivot toward tangible asset preservation.
- India followed at +17%, driven by rural wealth accumulation and a long-standing preference for physical gold as an inflation hedge and intergenerational wealth transfer vehicle.
- Both markets represent enormous potential demand pools that remain far from saturation at current ownership penetration levels.
ETF Inflows: The Institutional Dimension
Exchange-traded gold product holdings expanded by 803 tonnes in 2025, the highest yearly inflow since 2020. Unlike the bar and coin market, which skews toward retail participation, ETF flows largely reflect institutional and sophisticated retail positioning. Gold ETF inflows of this magnitude signal that the investment case resonated across different economic environments and investor mandates simultaneously.
J.P. Morgan has cited continued ETF accumulation as a key driver in its projection of a $5,000 per ounce price target for 2026, a forecast that has attracted significant market attention. (J.P. Morgan, 2025)
Retail Psychology in 2026: The Patience Test
Post-January 2026 price consolidation has introduced friction for retail participants accustomed to the relentless upward trajectory of 2025. Range-bound prices following an initial rally are a well-documented psychological challenge for momentum-oriented retail investors, who tend to exit positions during stagnant periods and re-enter at higher levels, often crystallising losses in the interim.
Simultaneously, elevated oil prices are compressing household disposable incomes in key bar and coin markets, reducing the capital available for discretionary precious metals purchases. These headwinds are real but are best understood as cyclical dampeners on a structurally intact investment thesis.
The next major ASX story will hit our subscribers first
Jewellery, Electronics, and Industrial Demand: Structural Headwinds Accumulating
Jewellery Fabrication at a Five-Year Low
Global jewellery fabrication fell by 19% in 2025 to 1,646 tonnes, its lowest level in five years. The price elasticity of jewellery demand is well-established: as gold prices rise, consumers respond through a combination of light-weighting (reducing the gold content per piece), carat shifts (moving from 18-carat to 14-carat or lower), and outright substitution toward platinum, palladium, or gold-filled alternatives.
| Year | Global Jewellery Fabrication | YoY Change |
|---|---|---|
| 2023 | ~2,030 t (est.) | Stable |
| 2024 | ~2,030 t (est.) | Stable |
| 2025 | 1,646 t | -19% |
| 2026 (forecast) | ~1,465 t (est.) | -11% |
The 2026 forecast of approximately 1,465 tonnes would place fabrication only marginally above the Covid-19-disrupted 2020 baseline, a remarkable deterioration for what was historically the dominant category of gold consumption.
Electronics: AI Infrastructure Gains, Consumer Weakness
Electronics demand was effectively flat in 2025, masking an interesting internal dynamic. Gold usage in AI data centre infrastructure, specifically in advanced bonding wire, connectors, and high-reliability circuitry, provided incremental demand growth. However, ongoing weakness in consumer electronics, particularly smartphones and personal computing devices, neutralised these gains almost precisely.
As AI infrastructure buildout continues and consumer electronics eventually cycles through its current softness, this segment could shift from neutral to modestly positive for gold demand over the medium term.
Industrial Fabrication Contraction
Decorative and broader industrial fabrication contracted by 4.9% in 2025 to its lowest level since the pandemic-affected 2020, adding another quiet headwind to aggregate demand that receives less analytical attention than investment flows but contributes meaningfully to the overall demand balance.
Where Is the Gold Price Heading? Forecasts, Scenarios, and Risk Assessment
The 2026 Base Case
The annual average gold price forecast for 2026 stands at $4,920 per ounce, representing a 43% increase over the 2025 annual average and a new all-time record high according to precious metals research analysis by Metals Focus. Reviewing the broader gold price forecast context helps investors understand how this projection incorporates assumptions about conflict resolution and continued structural investment demand.
Scenarios That Could Disappoint Gold Bulls
Several credible scenarios could constrain gold's upside or trigger meaningful corrections:
- Scenario A: Dollar Resurgence. A hawkish Federal Reserve pivot driven by unexpectedly sticky inflation could strengthen the dollar materially, applying downward pressure on gold's international price competitiveness.
- Scenario B: Geopolitical De-escalation Without Macro Follow-Through. Peace agreements in active conflict zones could trigger short-term profit-taking and sentiment reversal, even if the underlying macro environment remains supportive.
- Scenario C: Equity Market Recovery. A sustained risk-on rotation driven by earnings surprises or trade deal resolution could redirect institutional capital away from defensive positioning and toward equities.
- Scenario D: Stagflationary Trap. Rising energy costs maintaining elevated interest rates while capping real income growth creates a mixed-signal environment where gold's traditional role as an inflation hedge competes with elevated real yield headwinds.
Five Enduring Structural Drivers Supporting the Bull Case
- Persistent U.S. fiscal deficit expansion with no credible medium-term consolidation pathway in sight.
- Long-term questions surrounding U.S. dollar reserve currency dominance and the accelerating pace of central bank diversification.
- Ongoing sovereign accumulation well above pre-2022 norms, confirming institutional preference for gold as a reserve asset.
- Stretched equity market valuations creating persistent portfolio hedging demand from multi-asset managers.
- Sustained geopolitical instability across multiple simultaneous theatres reinforcing safe-haven gold demand as a baseline portfolio requirement rather than a tactical trade.
Frequently Asked Questions: Gold Price Momentum and Geopolitical Risk
Does geopolitical conflict always push gold prices higher?
Not automatically. Geopolitical events influence gold prices most powerfully when they alter inflation expectations, weaken the dollar, or prompt monetary policy shifts. Conflicts that raise energy prices and sustain elevated interest rates can paradoxically cap gold's upside by keeping real yields elevated and reducing the retail purchasing power that drives physical demand in key markets. Morningstar's market turmoil analysis offers further perspective on this nuanced relationship.
Why did central bank gold purchases fall in 2025 if the structural case remains intact?
The 2025 decline primarily reflected portfolio rebalancing after three consecutive years of purchases exceeding 1,000 tonnes. At 848 tonnes, the absolute level remains significantly above pre-2022 averages, confirming the long-term diversification trend is unbroken rather than reversed.
What is driving physical investment demand ahead of jewellery?
High gold prices have eroded jewellery affordability and triggered substitution toward cheaper alternatives. Simultaneously, economic uncertainty has elevated the appeal of tangible store-of-value assets among retail investors, particularly in China and India, where cultural and economic motivations align powerfully with bar and coin accumulation.
Is the $5,000 per ounce forecast realistic?
Major institutional forecasters, including J.P. Morgan, have cited $5,000 per ounce as achievable under conditions of continued ETF inflows, sustained central bank buying, dollar weakness, and unresolved geopolitical tensions. The forecast is contingent on the macro environment not shifting materially toward risk-on sentiment or significant Federal Reserve policy tightening.
How does recycling supply affect gold price momentum?
Higher recycling volumes increase total supply, which can exert mild downward pressure on prices. The 2025 recycling surge to a 13-year high did not derail the price rally, however, suggesting that investment demand growth was more than sufficient to absorb the additional supply entering the market.
Key Takeaways for Investors and Market Observers
- Gold's 2025 performance was the strongest since 1980, driven by a convergence of monetary, fiscal, and geopolitical forces rather than any single catalyst.
- Supply fundamentals remain broadly supportive: mine production growth is modest, costs are rising sharply, and recycling gains are structurally constrained by near-market stock depletion and safe-haven retention behaviour.
- The demand architecture is undergoing a historic shift, with physical investment replacing jewellery as the primary consumption category for the first time on record.
- Central bank buying, while lower in 2025, remains structurally elevated above pre-2022 norms, with the diversification trend firmly intact.
- The 2026 average price forecast of $4,920 per ounce depends on Middle East conflict resolution and continued macro uncertainty, both plausible but not guaranteed scenarios.
- Geopolitical risk is a secondary rather than primary price driver; real yields, dollar direction, and rate expectations remain the dominant variables determining gold's medium-term trajectory.
- Investors should treat short-term price consolidation as psychologically challenging but structurally consistent with sustained bull markets, particularly given the enduring nature of the macro drivers underpinning current gold price momentum amid geopolitical headwinds.
Disclaimer: This article is for informational purposes only and does not constitute financial or investment advice. All price forecasts and projections cited are drawn from third-party research and are subject to material uncertainty. Past performance of any asset class is not indicative of future results. Readers should conduct independent research and consult qualified financial advisers before making investment decisions.
Readers seeking additional perspectives on gold market dynamics and precious metals investment trends may find value in exploring industry commentary published by the World Gold Council and Metals Focus, both of which regularly publish accessible market outlook reports and demand data summaries. Mining Weekly's gold sector coverage at miningweekly.com also offers ongoing reporting on supply-side developments and producer economics.
Want to Position Yourself Ahead of the Next Major ASX Gold Discovery?
While gold's structural bull market is driven by macro forces, the most significant wealth-creation moments often occur when a major mineral discovery is announced — and speed is everything. Discovery Alert's proprietary Discovery IQ model delivers real-time alerts on significant ASX mineral discoveries, instantly translating complex data across 30+ commodities into actionable insights for both traders and long-term investors. Explore historic discovery returns on Discovery Alert's dedicated discoveries page to understand the scale of opportunity, then begin your 14-day free trial to ensure you're never late to the next significant find.