June 11, 2026
The Real Yield Mechanism Most Investors Miss
When precious metals prices fall sharply during periods of rising inflation, the instinctive response is confusion. Inflation is supposed to be gold's friend. Yet in mid-2026, headline CPI climbed to its highest level in over three years while gold simultaneously shed a quarter of its value from its January peak. This apparent contradiction dissolves the moment you understand the mechanism that actually governs gold pricing: not inflation itself, but real yields.
Real yields represent the return on government bonds after accounting for inflation expectations. When nominal Treasury rates remain elevated and markets begin pricing out rate cuts, real yields stay restrictive even as consumer prices climb. For gold, which generates no income, a high real yield environment raises the opportunity cost of holding the metal. Investors can earn a meaningful return in bonds; gold offers nothing comparable.
That dynamic, not sentiment, not geopolitics in isolation, is the engine behind the current correction in the gold price outlook after CPI and the Fed meeting. Understanding this mechanism reframes every piece of data released in June 2026 and clarifies exactly what the upcoming FOMC meeting needs to deliver for the picture to change.
When big ASX news breaks, our subscribers know first
Two Shocks, One Transmission Channel: How Gold Lost 25% in Five Months
The Energy Supply Disruption That Started Everything
The US-Iran conflict triggered a significant disruption to oil flows through the Strait of Hormuz, a maritime chokepoint that handles roughly 20% of global oil supply [Bureau of Labor Statistics, May 2026 CPI]. Crude prices pushed past $100 and then $110 per barrel. Energy costs rose 23.5% year-on-year by May 2026, accounting for more than 60% of that month's monthly CPI increase [Bureau of Labor Statistics, Consumer Price Index, May 2026].
The cascade effect on rate expectations was swift. Higher energy inflation suppressed the probability of near-term rate cuts. Nominal yields held elevated. Real yields remained restrictive. Gold, priced in dollars and yielding nothing, became comparatively less attractive relative to interest-bearing instruments. For a broader context, gold's safe haven dynamics become particularly nuanced when energy-driven inflation dominates the headline figures.
The Labour Market Shock That Eliminated Any Remaining Doubt
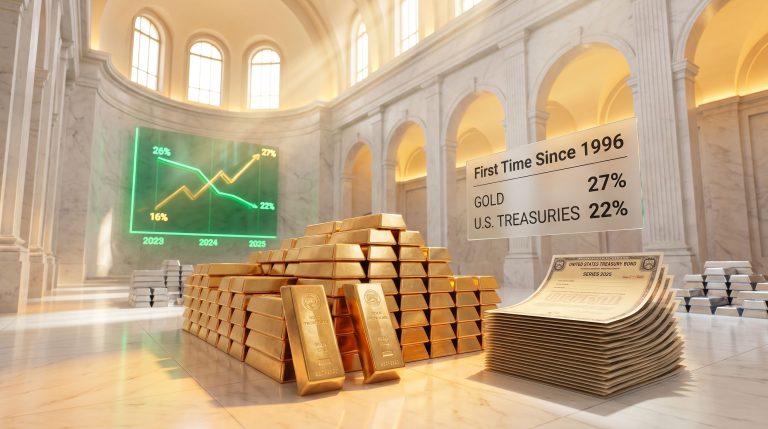
On June 6, 2026, the Bureau of Labor Statistics reported that the US economy added 172,000 jobs in May, more than double the 80,000-job consensus forecast from Dow Jones [Bureau of Labor Statistics, Employment Situation, May 2026]. A labour market performing at that level removed any remaining case for near-term monetary easing. The CME FedWatch Tool moved the probability of at least one rate hike by December 2026 to 70% [CME FedWatch Tool, June 9, 2026].
Goldman Sachs removed all 2026 rate cuts from its economic model, shifting its expected easing window to mid-2027 [Goldman Sachs Global Research, June 2026]. Gold closed below its 200-day moving average for the first time since October 2023, falling from its January 28, 2026 all-time high of $5,589/oz to $4,165/oz, a drawdown of approximately 25% [nFusion Solutions, June 10, 2026].
Key Mechanism: Both shocks fed into the same transmission channel. Energy inflation raised the headline CPI reading, which suppressed rate-cut expectations, which kept nominal yields elevated, which maintained restrictive real yields, which pressured the gold price. The route from the Strait of Hormuz to the gold chart runs through the Federal Reserve's policy calculus.
What the May 2026 CPI Report Actually Reveals
Headline vs. Core: The Number Inside the Number
The 4.2% year-on-year headline CPI figure for May 2026 was the highest reading since April 2023 [Bureau of Labor Statistics, Consumer Price Index, May 2026]. It confirmed what markets had largely anticipated and was, in many respects, already priced into rate expectations before the report was published. The more meaningful data point was core CPI, which excludes volatile food and energy components.
Core CPI rose 2.9% year-on-year with a monthly gain of just 0.2%, below the 0.3% consensus forecast [Bureau of Labor Statistics, May 2026 CPI]. That deceleration from April's monthly reading of 0.4% is a material development that received considerably less attention than the headline. According to FX Empire's gold price analysis, hot CPI readings have historically reinforced the Fed's rate hike path in ways that create outsized short-term pressure on bullion.
| CPI Component | Monthly Change | Year-on-Year | Key Observation |
|---|---|---|---|
| Headline CPI | N/A | +4.2% | Highest since April 2023 |
| Core CPI | +0.2% | +2.9% | Below 0.3% consensus; down from 0.4% in April |
| Energy | N/A | +23.5% | Accounts for 60%+ of monthly gain |
| Shelter | +0.3% | N/A | Down from +0.6% in April |
| Transportation Services | -0.6% | N/A | Deflationary signal in services |
Sources: Bureau of Labor Statistics, Consumer Price Index, May 2026
Why Monetary Policy Cannot Resolve an Oil Supply Shock
There is a fundamental mismatch between the inflation the Fed is confronting and the tools it has available to address it. Rate hikes operate by raising the cost of credit and suppressing domestic demand. They have no mechanism to increase oil production, reopen shipping lanes, or resolve geopolitical standoffs. Bond markets appeared to understand this distinction: Treasury yields moved minimally in the immediate aftermath of the CPI release, even though the headline printed at a three-year high.
Three signals within the May data that carry particular weight for the gold price outlook going forward:
- Monthly core CPI decelerated from 0.4% in April to 0.2% in May, the sharpest one-month step-down in 2026
- Shelter inflation, historically the stickiest and most persistent CPI sub-component, eased to +0.3% month-on-month from +0.6% the prior month
- Transportation services registered a -0.6% monthly decline, a deflationary signal within the services category that the Fed watches most closely
Taken together, these readings suggest the underlying domestic inflation dynamic is moderating. What remains elevated is almost entirely a function of geopolitics and energy supply, not broad-based demand pressure. This is a critical distinction for any investor interpreting the gold price outlook after CPI and the Fed meeting.
The June 16-17 FOMC: What to Watch Beyond the Rate Decision
Why the Hold Is Already Priced and the Dot Plot Is Not
Markets are pricing a 97% probability of no rate change at the June 16-17 meeting [CME FedWatch Tool, June 9, 2026]. The rate decision itself carries minimal information content precisely because the outcome is so widely anticipated. What is genuinely uncertain, and therefore where gold's next directional move will be determined, is the updated Summary of Economic Projections, or dot plot.
The dot plot is a grid showing where each Federal Open Market Committee member expects the policy rate to sit at year-end 2026, 2027, and 2028. It translates committee consensus into a visual rate path that markets immediately incorporate into pricing. A single shift in the median projection can move bond yields, the dollar, and gold more decisively than the rate decision itself. Furthermore, how central banks influence gold prices through their policy signals adds another layer of complexity to interpreting these projections.
Kevin Warsh's First Meeting as the 17th Federal Reserve Chair
Kevin Warsh was sworn in as the 17th Federal Reserve Chair on May 22, 2026 [Federal Reserve]. This is his first FOMC meeting in that capacity, and the dynamics of a new chair's inaugural press conference carry additional weight. His commentary will be parsed intensely for signals about how he frames the relationship between price stability, growth risk, and fiscal sustainability.
A critical background constraint shapes whatever preference Warsh holds: US federal debt exceeds $37 trillion, generating annual interest costs above $1 trillion [US Treasury, Fiscal Data 2026]. At that debt level, aggressive tightening carries its own systemic risks. The degree to which Warsh acknowledges this tension publicly will tell the market more about the realistic rate path than any dot.
The Three Questions That Determine Gold's Reaction
-
Where does the median 2026 dot land? A hold projection supports a gold relief rally, since current market positioning already reflects a level of hawkishness that likely exceeds what the committee will project. A shift toward one hike by December sustains dollar strength and near-term pressure on bullion.
-
How does Warsh characterise the inflation-growth tradeoff? Language acknowledging the limits of monetary policy in an energy-supply-driven inflation environment would be interpreted as relatively dovish and supportive of a gold recovery.
-
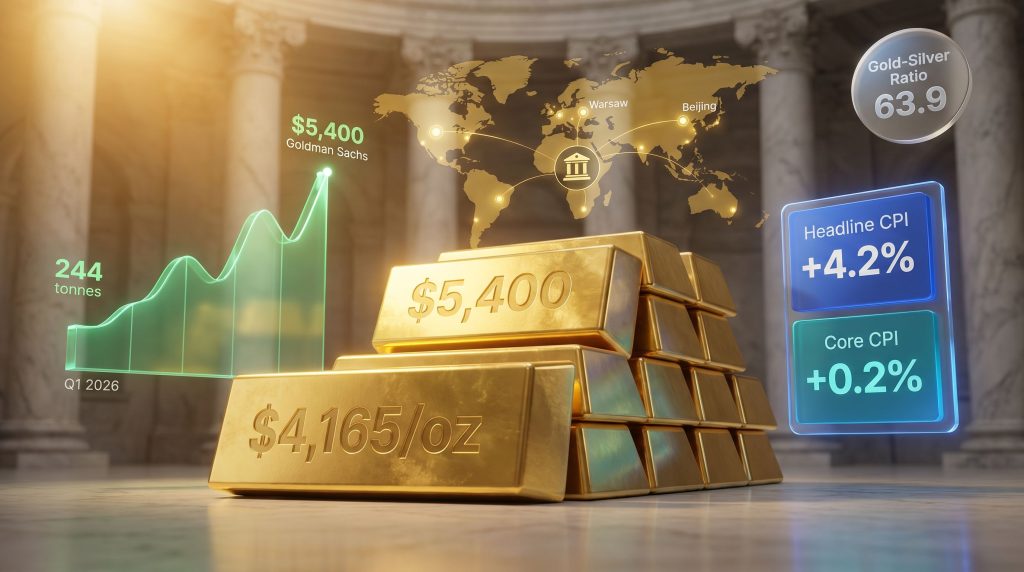
Does the committee signal awareness of stagflationary risk? Goldman Sachs simultaneously raised its hike probability to 20% and maintained its $5,400 year-end gold target [Goldman Sachs Global Research, June 2026]. That combination only makes analytical sense if stagflation is being modelled as a plausible scenario. In a stagflationary environment, gold has historically been one of the strongest-performing assets precisely because monetary policy cannot effectively address the underlying problem.
| FOMC Outcome | Likely Gold Reaction | Primary Driver |
|---|---|---|
| Hold + neutral dot plot | Rally toward $4,400-$4,500 | Hawkish positioning unwinds |
| Hold + one hike signalled | Continued pressure, $4,100-$4,300 range | Dollar and real yield support |
| Hold + dovish growth framing | Sharp rally, $4,500+ | Stagflation narrative takes hold |
| Surprise hike (approx. 3% probability) | Acute selloff, potential sub-$4,100 | Shock repricing of full rate path |
Institutional Price Targets and the Gap Between Forecasts and Spot
Where the Major Banks Stand on Year-End 2026
One of the most striking features of the current correction is that not a single major institutional gold forecast has been withdrawn. Every published year-end target for 2026 sits materially above the current spot price of $4,165. In addition, JPMorgan's outlook on gold prices highlights the structural drivers that underpin these elevated long-term targets even amid near-term volatility.
| Institution | Year-End 2026 Target | Implied Upside from $4,165 | Status |
|---|---|---|---|
| Goldman Sachs | $5,400 | +29.7% | Maintained; all 2026 rate cuts removed from model |
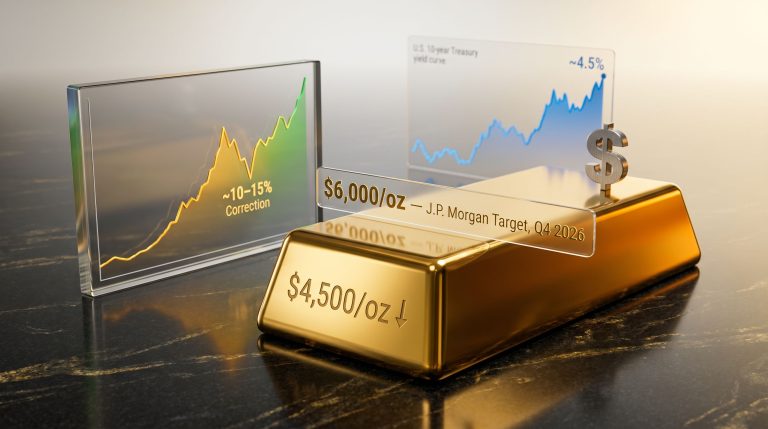
| JPMorgan | ~$6,000 | +44.1% | Full-year average trimmed to $5,243; directional target intact |
| Morgan Stanley | $5,200 | +24.8% | Revised down from $5,700 on real yield headwinds |
| UBS | $5,500 | +32.0% | Trimmed from $5,900; yield concerns cited |
| LBMA Consensus (28 analysts) | $4,742 | +13.8% | Full-year average; spot currently below this midpoint |
Sources: Goldman Sachs Global Research May 2026; JPMorgan Global Research May 18, 2026; Morgan Stanley Commodities Research April 2026; UBS Global Research May 27, 2026; LBMA Forecast Survey 2026
What Goldman's Unchanged Target Reveals About the Structural Thesis
Goldman Sachs removing all 2026 rate cuts from its economic model while leaving its $5,400 gold target untouched is a significant data point. It signals that the firm's gold bull case rests not on low rates, but on structural central bank demand as a persistent price floor. When the rate tailwind is removed from the model entirely and the gold target does not move, the implication is that sovereign accumulation is doing more work in the price framework than monetary policy ever was.
The LBMA consensus of $4,742 is the aggregated view of 28 professional analysts surveyed at the start of 2026. With gold currently trading below that midpoint, the market is effectively pricing a more pessimistic outcome than the professional forecasting community's central view.
Sovereign Gold Accumulation: The Demand Floor That Corrections Cannot Dislodge
Q1 2026 Central Bank Buying: Scale and Consistency
Central banks purchased a net 244 tonnes of gold in Q1 2026, a figure that came in above both the prior quarter and the five-year average [World Gold Council, Gold Demand Trends Q1 2026, April 29, 2026]. A brief pause in March, driven by Turkey's gold/USD swap maturities generating net sales, temporarily raised questions about whether institutional demand was softening. April's data answered clearly.
Central banks returned to net buying in April with 17 tonnes purchased across the month [World Gold Council, Central Bank Gold Statistics, June 3, 2026]. Two buyers dominated the headline figures:
| Central Bank | April 2026 Purchase | Year-to-Date Total | Current Reserves | Reserve Share |
|---|---|---|---|---|
| Poland (NBP) | 14 tonnes | 45 tonnes | 595 tonnes | ~30% of total holdings |
| People's Bank of China | 8 tonnes | 18 consecutive months of net buying | 2,322 tonnes | ~9% of total reserves |
Source: World Gold Council, Central Bank Gold Statistics, June 3, 2026
The Reserve Allocation Gap and Why It Points to Multi-Year Accumulation
The numbers above become more significant in a comparative context. The US and major European central banks hold between 60% and 70% of their reserves in gold. China's allocation of 9% and Poland's 30% both sit far below that benchmark. Poland has a publicly stated target of 700 tonnes; at 595 tonnes currently, meaningful accumulation remains ahead. China's 18-consecutive-month buying streak is the longest sustained accumulation period on record for the People's Bank of China.
The macro backdrop reinforces this trajectory. The IMF's data on the composition of global official reserves shows a sustained, multi-decade decline in the US dollar's share [IMF, Currency Composition of Official Foreign Exchange Reserves, 2026]. Central banks diversifying away from dollar-denominated instruments need an alternative store of value. Gold, with no counterparty risk and no exposure to any single issuer's fiscal position, fits that function in a way no other asset class can replicate.
Reserve managers operate on timelines measured in decades, not quarters. A 25% price correction over five months does not constitute a strategic trigger to reduce gold allocations. For institutions with reserve targets still well below prevailing Western norms, it may represent an opportunity to accumulate at a lower average cost. Consequently, the gold market investment outlook for the medium term remains structurally supported by this sovereign demand dynamic.
The next major ASX story will hit our subscribers first
The Gold-Silver Ratio at 63.9: Reading Silver's Relative Value Signal
How the Ratio Works and Why It Matters Now
The gold-to-silver ratio measures the number of silver ounces required to purchase one ounce of gold. With gold at $4,165 and silver at $65.24 on June 10, 2026, the ratio sits at approximately 63.9 [nFusion Solutions, June 10, 2026]. That is up sharply from 55.16 in early May, marking the highest reading of the year and signalling that silver has cheapened considerably relative to gold over a short period. The gold-silver ratio analysis provides further historical context for interpreting these elevated readings and their implications.
| Ratio Range | Historical Interpretation | Context |
|---|---|---|
| Below 50 | Silver historically expensive relative to gold | Not applicable in 2026 |
| 55-65 | Moderate dislocation; silver relatively undervalued | Early 2026 range: 55-60 |
| 65-80 | Elevated dislocation; silver measurably cheap | Current level approaching upper bound |
| Above 80 | Extreme dislocation; historically preceded silver outperformance | Briefly seen during 2020 crisis |
Silver's Two Independent Demand Engines
Understanding the ratio requires separating silver's two fundamentally different demand sources:
-
Monetary demand: Responds to real yields, dollar direction, and inflation expectations. Moves in close correlation with gold and is suppressed by the same rate-hike fears currently weighing on precious metals broadly.
-
Industrial demand: Driven by solar panel manufacturing, electric vehicle production, AI data centre infrastructure, and consumer electronics. This demand operates independently of Federal Reserve policy and does not pause during FOMC meetings.
When the monetary engine is suppressed by rate expectations, silver underperforms gold in the near term. That is precisely what the ratio elevation reflects. However, industrial buyers remain active regardless of rate expectations, providing a demand floor that pure monetary instruments do not have. Historically, ratios in the 60-70 range have been followed by periods of silver outperformance during bull market recoveries, as the monetary headwind eases and industrial demand reasserts simultaneously.
Scenario Framework: Gold's Probable Pathways Through Year-End 2026
Modelling the Range of Outcomes
| Scenario | Key Conditions | Gold Price Range | Assessment |
|---|---|---|---|
| Bull Case | Neutral Warsh dot + Hormuz resolution + sustained central bank buying | $5,000-$5,400 | Moderate-to-high probability |
| Base Case | Hold maintained + hawkish language + gradual core disinflation | $4,400-$4,800 | Highest probability |
| Bear Case | December hike confirmed + oil stays elevated + fiscal repricing | $3,800-$4,100 | Lower probability |
| Stagflation Case | Rate hike into decelerating growth + persistent energy inflation | $5,000+ (gold outperforms) | Low-to-moderate probability |
The stagflation scenario deserves particular attention because it is the one outcome where gold's performance is most divorced from the conventional rate-hike-is-bad-for-gold logic. When a central bank raises rates into an economy already weakened by an external supply shock, the result is not reduced inflation but reduced growth alongside persistent price pressure. Fiscal stress compounds the problem. In that environment, gold functions less as an inflation hedge and more as a hedge against systemic policy failure. Goldman Sachs maintaining both a 20% hike probability and a $5,400 gold target simultaneously reflects exactly this analytical framework [Goldman Sachs Global Research, June 2026]. Furthermore, the gold bonds and economic cycles relationship becomes especially relevant when modelling stagflationary outcomes of this kind.
Frequently Asked Questions: Gold Price Outlook After CPI and the Fed Meeting
Why Is Gold Falling When Inflation Is At a Three-Year High?
Gold prices are driven by real yields, not the nominal inflation rate. When energy-driven CPI rises and markets respond by pricing out rate cuts, nominal Treasury yields stay elevated. If those nominal yields rise faster than inflation expectations shift, real yields remain restrictive, and the opportunity cost of holding gold increases relative to interest-bearing assets. The May 2026 CPI spike was geopolitical and energy-specific in origin, not a sign of broad demand overheating, yet its effect on the rate expectations path was sufficient to maintain downward pressure on bullion [Bureau of Labor Statistics, Consumer Price Index, May 2026].
What Are the Major Institutional Gold Forecasts for Year-End 2026?
As of June 2026, major year-end targets include Goldman Sachs at $5,400, JPMorgan at approximately $6,000, Morgan Stanley at $5,200, and UBS at $5,500 [Goldman Sachs Global Research; JPMorgan Global Research; Morgan Stanley Commodities Research; UBS Global Research, 2026]. The LBMA's consensus survey of 28 analysts places the full-year average at $4,742 [LBMA Forecast Survey 2026]. With gold at $4,165, all published professional targets sit between 13.8% and 44.1% above current spot.
What Will the June FOMC Meeting Mean for the Gold Price?
A rate hold is effectively certain, priced at 97% probability [CME FedWatch Tool, June 9, 2026]. The market-moving variable is the updated dot plot and Chair Warsh's press conference framing. A neutral median projection keeping the year-end 2026 rate at hold would likely prompt a relief rally as hawkish positioning unwinds. A dot plot showing one hike by December would sustain near-term pressure. Either way, six weeks of rate-path uncertainty resolves by June 18, removing one of the primary headwinds for precious metals positioning. This resolution is central to the gold price outlook after CPI and the Fed meeting for the remainder of 2026.
Are Central Banks Still Buying Gold Despite the Price Decline?
Yes. Net central bank purchases totalled 244 tonnes in Q1 2026, above the five-year average, and buying resumed in April with 17 tonnes after a brief March pause [World Gold Council, April 29 and June 3, 2026]. China extended its buying streak to 18 consecutive months while Poland accumulated toward a stated 700-tonne reserve target. The structural case for sovereign accumulation, anchored in dollar reserve diversification and the long-run decline in USD's share of global reserves, remains intact independent of near-term price movements [IMF, Currency Composition of Official Foreign Exchange Reserves, 2026].
What Does a Gold-Silver Ratio of 63.9 Signal for Investors?
A ratio of 63.9 indicates that gold costs approximately 64 times the price of silver, the highest reading of 2026 and elevated relative to the 55-60 range that characterised the January through April period. Historically, ratios in the 60-70 band have preceded silver outperformance relative to gold during bull market recovery phases. Silver's industrial demand base in solar manufacturing, electric vehicles, and electronics provides a structural floor that supports the metal regardless of rate expectations. At current levels, silver presents the most compelling relative value entry point of the year so far.
Disclaimer: This article is for informational purposes only and does not constitute financial or investment advice. All figures, forecasts, and institutional targets are sourced from publicly available research and government data as cited. Past performance is not indicative of future results. Readers should consult a qualified financial adviser before making any investment decisions. Scenario projections represent analytical frameworks, not guarantees of future outcomes.
Want To Track The Next Major Mineral Discovery Before The Broader Market Does?
Discovery Alert's proprietary Discovery IQ model delivers real-time alerts on significant ASX mineral discoveries, turning complex data across 30+ commodities into clear, actionable opportunities for both short-term traders and long-term investors — start your 14-day free trial today and explore how historic discoveries have generated extraordinary returns for those who positioned early.