June 6, 2026

When Bull Markets Breathe: Understanding Gold's Corrective Phases
Secular bull markets in gold do not move in straight lines. History shows that even the most powerful multi-year uptrends are interrupted by sharp, disorienting pullbacks that test investor conviction and flush out speculative positioning. These corrections are not signs of structural failure. They are, in fact, a necessary mechanical feature of sustained price appreciation, serving to reset sentiment, rebuild technical foundations, and create the conditions from which the next major advance can launch.
For investors trying to navigate the current gold price outlook final drop before the uptrend resumes, the critical question is not whether a correction is underway, but whether it represents a temporary pause or something more structurally damaging. The evidence from multiple analytical frameworks suggests the former is far more likely.
When big ASX news breaks, our subscribers know first
Why Mid-Cycle Corrections Are a Feature, Not a Flaw
The Historical Blueprint for Precious Metals Pullbacks
During the gold bull market that ran from roughly 2001 to 2011, prices experienced multiple corrections of between 10% and 30% before ultimately reaching their cycle peak. The mid-cycle consolidation between 2006 and 2007 is particularly instructive. After a sharp rally, gold pulled back significantly, shook out weaker holders, and then launched into one of the most powerful legs of the entire decade-long advance.
This pattern reflects a principle deeply embedded in market structure:
- Rapid price advances create overextension relative to moving averages
- Profit-taking and repositioning compress momentum indicators
- Support levels are tested, confirming or denying the structural integrity of the trend
- Once sellers are exhausted, the path of least resistance returns to the upside
The 2006 parallel is particularly relevant to the current environment. Technical cycle analysts tracking gold's current behaviour have noted structural similarities between where gold sits today and where it stood at a comparable stage in that prior bull cycle. Based on this framework, a potential low forming around the $4,000 level in July has been identified as the most probable near-term base formation window, with prices subsequently targeting $7,500 over the following 12 to 18 months. For further context, the broader gold price forecast supports this longer-term bullish trajectory.
Corrections of 10% to 20% within a broader precious metals uptrend are statistically common and have historically preceded the most powerful continuation phases of the cycle.
The 2025 Rally Sets the Stage for Digestion
Gold's performance through 2025 was exceptional by any historical measure. Assets that appreciate sharply over compressed timeframes almost always require consolidation periods before the next sustained advance can begin. The current pullback is consistent with this dynamic, representing a digestion phase rather than a trend reversal.
Momentum exhaustion, rotation out of high-performing assets, and shifting macro expectations around Federal Reserve policy have combined to create the conditions for this corrective phase. None of these factors, on their own or in combination, constitute a structural break in the long-term gold thesis.
What Is Driving the Current Pullback Across Precious Metals
Employment Data and the Rate Expectations Feedback Loop
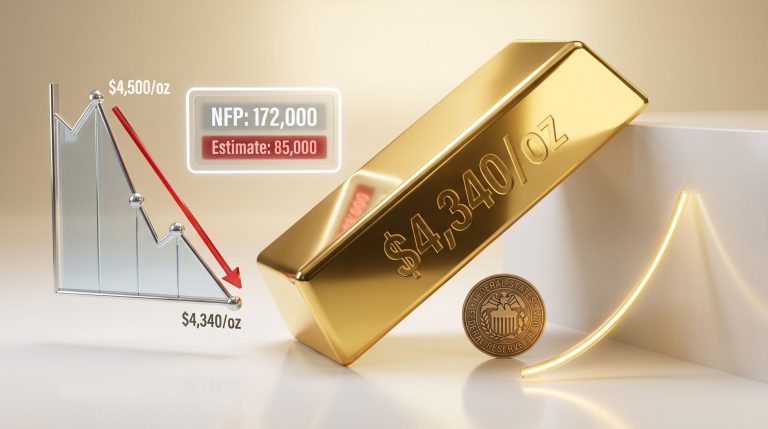
The proximate trigger for the current weakness in metals and mining equities has been stronger-than-expected employment data. Better-than-forecast jobs figures reduce market confidence in near-term Federal Reserve rate cuts, which in turn pushes real yields higher. The relationship between real yields and gold is well established: rising real yields increase the opportunity cost of holding non-yielding assets like gold, creating short-term headwinds for the metal.
Dollar strength compounds this dynamic. A stronger US Dollar Index (DXY) applies mechanical downward pressure on all USD-denominated commodities, including gold and silver, as foreign buyers effectively face higher prices in their local currencies.
Technical Breakdown Across the Complex
The technical picture across precious metals and their associated equities reflects a broad-based corrective phase:
| Asset | Key Support Level | Downside Target | Critical Level |
|---|---|---|---|
| Gold | ~$4,000 | $3,700–$3,800 (bearish scenario) | 200-day MA |
| Silver | $70.00 | ~$55.00 | 200-day MA |
| Platinum | ~$1,600 (gap fill) | Under review | 200-day MA |
| GDX (Senior Miners) | Target zone | ~$72.00 | 200-day MA |
| GDXJ (Junior Miners) | March low | ~$90.00 | 200-day MA |
Gold is testing key support levels after failing to hold recent highs. Silver has become particularly vulnerable: sustained daily closes below $70.00 could trigger an accelerated decline toward approximately $55.00, representing the final washout before a base forms. Platinum has slipped beneath its 200-day moving average and is expected to fill a price gap near $1,600 before establishing a cyclical low.
Senior mining equities tracked through the GDX have broken below their 200-day moving average, with downside targets pointing toward $72.00. Junior miners tracked through GDXJ are approaching the March low, with a maximum downside scenario near $90.00. Silver junior miners in the SILJ index are testing their own 200-day moving average, with a continued breakdown considered the higher-probability near-term outcome.
It is worth noting that gold and mining equities typically see miners lead metals at both cyclical bottoms and tops. Their current weakness may therefore be a leading indicator of the final corrective phase rather than evidence of a structural reversal in the broader bull market.
What Cycle Analysis Reveals About a July Low
Recurring Seasonal and Multi-Year Patterns in Gold
Cycle analysis in precious metals involves identifying recurring temporal patterns in price behaviour, both seasonal and across multi-year timeframes. Rather than predicting specific price levels with certainty, this methodology identifies probability windows where cyclical forces are most likely to produce inflection points.
The 2006 historical parallel, cited frequently by technical analysts examining the current environment, maps the current corrective phase onto a comparable stage of the prior gold bull cycle. At that point in 2006, gold experienced a meaningful mid-cycle correction that ultimately resolved into a powerful continuation of the uptrend. The current setup shares several structural characteristics with that period, supporting July as a high-probability timing window for a cyclical low.
Cycle analysis does not generate guaranteed outcomes. It identifies probability windows where multiple historical patterns and technical signals converge, making a particular scenario more or less credible depending on how the evidence lines up.
The Mechanics of a Higher Low
For the longer-term bull market thesis to remain intact following a corrective phase, the next low must form at a level above the previous significant trough. This technical concept, known as a higher low, confirms that buyers are willing to step in at progressively elevated price points, which is the defining characteristic of an ongoing uptrend.
Confirmation signals that investors should monitor include:
- Reversal candlestick formations or momentum divergences at key support levels
- Higher trading volume on advancing days compared to declining days following the low
- A reclaim of the 200-day moving average by both metals and mining equities
- Compression in the gold-silver ratio analysis, with silver beginning to outperform gold, which is a classic early-bull signal
Gold Price Scenarios: Near-Term Through Long-Range
The World Gold Council's 2026 Scenario Framework
The World Gold Council has outlined three distinct macro pathways for gold in 2026, providing a structured framework for evaluating the range of possible outcomes:
| Scenario | Macro Conditions | Gold Price Implication |
|---|---|---|
| Bullish | Slower growth, rate cuts, risk-off sentiment | +5% to +15% |
| Base Case | Mixed macro signals, rangebound environment | Flat to modest gains |
| Bearish | High real yields, strong USD, risk-on sentiment | -5% to -20% |
Source: World Gold Council 2026 Outlook Framework
The bullish scenario requires a combination of slowing economic growth, falling real yields, and elevated geopolitical risk to materialise. The bearish scenario, which would see gold decline between 5% and 20% from recent highs, requires sustained yield pressure and continued dollar strength. The current pullback is consistent with macro conditions that are temporarily tilting toward the bearish scenario, without necessarily confirming it as the dominant long-term pathway.
Medium-Term Recovery and New All-Time Highs
Technical analysts tracking the 2006 parallel project a recovery path that ultimately targets $7,500 for gold over the following 12 to 18 months once the July base is established. This projection is supported by several structural factors:
- Central bank accumulation: Central bank gold demand has seen global central banks acting as net buyers at historically elevated levels, providing a demand floor that did not exist in prior cycles. Central banks flipped back to gold buying in April 2026 following brief pauses, reinforcing this structural bid.
- De-dollarisation trends: A growing number of sovereign entities are diversifying reserve assets away from US dollar instruments, with gold being the primary beneficiary.
- Fiscal dynamics: Expanding government deficits in major economies reduce the credibility of fiat currencies over extended timeframes, supporting the long-term case for monetary metals.
The Long-Range Projection to 2031
Longer-term cycle analysis suggests the current bull market may have approximately five years remaining, with gold potentially reaching $14,000 by 2031 under a sustained favourable macro environment. Furthermore, analysts at FX Empire have outlined comparable scenarios that align with the gold price outlook final drop before the uptrend resumes thesis, noting the structural drivers remain firmly intact.
Important disclaimer: Long-range price targets of this magnitude carry substantial uncertainty. Projections in the $14,000 range require a highly specific combination of macro conditions, including persistent fiscal expansion, sustained central bank buying, and ongoing de-dollarisation, to align over multiple years. These projections should be treated as scenario modelling rather than forecasts, and investors should not make capital allocation decisions based solely on long-range price targets.
Key risks that could invalidate the long-term bull case include a structural shift toward credible monetary tightening, sustained dollar strength driven by a return to US fiscal discipline, or a deflationary shock that collapses commodity demand broadly.
Silver's Asymmetric Risk-Reward Profile
Dual Demand Dynamics Create Unique Volatility
Silver occupies a unique position in the precious metals complex, functioning simultaneously as a monetary metal and an industrial input with critical applications in solar energy, electronics, and electric vehicle manufacturing. This dual role means silver's demand profile is more complex than gold's and creates price dynamics that can diverge significantly from the yellow metal, particularly during transitions between risk-on and risk-off environments.
The gold-to-silver ratio, which measures how many ounces of silver are required to purchase one ounce of gold, has historically been a useful valuation tool. Elevated ratios suggest silver is relatively undervalued compared to gold, while compressed ratios indicate the opposite. At stages where the ratio peaks and begins to compress, silver has historically delivered substantially larger percentage gains than gold in the subsequent advance.
Silver Price Scenarios Across Timeframes
The range of plausible outcomes for silver across different time horizons is wide:
- Near-term downside: A sustained breach of $70.00 support opens a technical path toward approximately $55.00, representing the final corrective low before a base forms
- Medium-term recovery: A breakout above $120.00 becomes the key technical inflection point confirming the resumption of the primary uptrend
- Long-range scenario: Under a sustained precious metals bull market, projections extend into the $300 to $500 range by 2031, though this represents a high-variance scenario requiring highly specific macro conditions to materialise
In addition, platinum may offer superior upside potential relative to gold over the remainder of this bull cycle, given its deeper correction relative to its 200-day moving average and its historically undervalued position compared to the other precious metals.
The next major ASX story will hit our subscribers first
Mining Equities: Operational Leverage as a Double-Edged Sword
Why Miners Amplify Both Corrections and Recoveries
The operational leverage embedded in mining company economics means that changes in metal prices have a disproportionate impact on earnings and cash flows. A 20% rise in gold prices does not translate into a 20% increase in miner profitability. Depending on a company's cost structure, the same gold price move can generate 40% to 60% earnings growth, or more, because fixed operating costs are spread across a larger revenue base.
This same leverage operates in reverse during corrections, amplifying drawdowns relative to the underlying metal. The current breakdown in GDX and GDXJ is therefore consistent with the corrective dynamics affecting the entire complex, rather than being a standalone warning signal.
Junior Miners: Highest Risk, Highest Potential Reward
Junior miners, tracked through indices such as GDXJ and SILJ, represent the highest-risk, highest-potential-reward segment of the precious metals equity complex. Their smaller balance sheets, earlier-stage project profiles, and lower liquidity make them more volatile during corrections. However, the junior miners upside potential in the later stages of a precious metals bull market is historically significant. GDXJ is currently testing its March low, with maximum downside near $90.00 before a potential base forms in July.
Historically, junior miners have delivered the largest percentage gains in the later stages of a precious metals bull market. If the July low scenario plays out as the gold price outlook final drop before the uptrend resumes framework suggests, junior mining equities may represent the highest-leverage entry point across the entire complex for patient investors with appropriate risk tolerance.
Following years of capital discipline enforced by a prolonged period of low gold prices, balance sheets across the sector have improved meaningfully. This structural improvement means that the operational leverage on the upside is not being offset by excessive financial leverage in the way it was in prior cycles.
Bitcoin vs. Gold: Diverging Safe-Haven Narratives
Bitcoin's Technical Position and What It Implies
The multi-month recovery in Bitcoin appears to have exhausted itself at its 200-day moving average, which is consistent with patterns observed during prior bear market phases in the asset. Historical precedent suggests that after testing this key moving average in bearish cycles, Bitcoin has subsequently declined by an additional 60% before establishing a durable bottom. Current technical analysis points to $40,000 as the base case target, with $33,000 or lower representing a tail risk scenario if selling pressure intensifies.
This dynamic contrasts sharply with gold's behaviour. During genuine risk-off episodes, gold tends to attract safe-haven capital flows while Bitcoin frequently sells off alongside equities, behaving more like a risk asset than a monetary hedge. This distinction matters for portfolio construction and challenges the narrative of Bitcoin as a structural replacement for gold in a diversified allocation.
Navigating Entry Timing During a Correction
Staged Entry as a Risk Management Strategy
Attempting to identify the precise bottom of a corrective phase is less productive than establishing a high-probability entry zone and building a position systematically as price approaches it. The concept of scaled or staged entry, deploying capital in tranches across a defined support zone rather than committing fully at a single price point, reduces the risk of buying too early while also avoiding the psychological trap of waiting indefinitely for a perfect entry that may never come.
The $4,000 gold level and the July timing window provide a practical framework for this approach. Investors who combine the technical support analysis with the cycle timing framework have a more robust basis for decision-making than those relying on either methodology in isolation.
Key risk management considerations include:
- Sizing positions relative to the genuine uncertainty about both the timing and depth of the final corrective phase
- Placing stop-losses below key support levels to limit downside if the correction extends beyond current projections
- Monitoring key macro variables, including Federal Reserve rate decision timelines, the DXY trend, and central bank gold purchase data, that would confirm or challenge the bullish scenario
- Distinguishing between short-term volatility driven by data releases and positioning shifts versus structural changes in the macro backdrop that would warrant a reassessment of the long-term thesis
Consequently, those who remain disciplined in their approach to the current gold price outlook final drop before the uptrend resumes scenario are best positioned to capitalise when the cycle turns, as the structural case for precious metals remains firmly intact across multiple timeframes.
This article is for informational and educational purposes only. Nothing contained herein constitutes financial advice or a recommendation to buy or sell any security or financial instrument. All projections and price targets discussed represent scenario modelling with significant uncertainty. Past market patterns do not guarantee future outcomes. Investors should conduct their own due diligence and consult a qualified financial advisor before making any investment decisions.
Want to Be First When the Next Major Gold or Silver Discovery Hits the ASX?
Discovery Alert's proprietary Discovery IQ model scans ASX announcements in real time, instantly identifying significant mineral discoveries across gold, silver, and 30-plus commodities — turning complex data into actionable opportunities for both short-term traders and long-term investors. Explore how historic discoveries have generated extraordinary returns and begin your 14-day free trial today to position yourself ahead of the market when the next major cycle move unfolds.