
May 11, 2026
When Falling Prices Signal Opportunity: Reading a Gold Correction With Precision
Across every major commodity supercycle in recorded financial history, the moments of greatest long-term opportunity have rarely arrived during periods of euphoria. They arrive during pullbacks, when short-term noise drowns out the underlying structural signal. For sophisticated precious metals investors, understanding how to distinguish between a meaningful trend reversal and a temporary price sale is one of the most valuable skills in portfolio management.
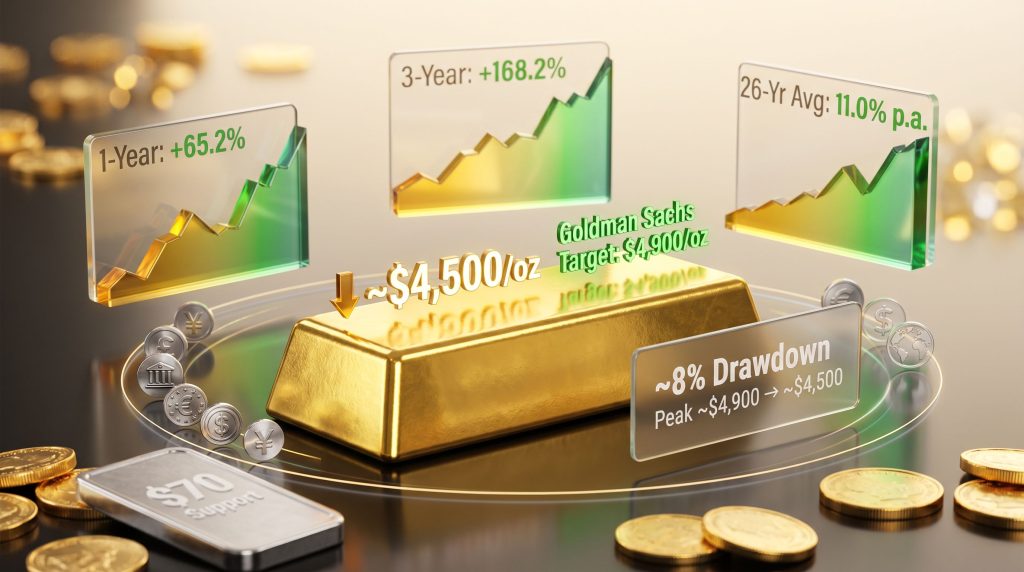
The current gold market presents precisely this kind of inflection point. With gold pulling back approximately 8% from recent highs near $4,900 per ounce to a trading range around $4,500 per ounce, the question every investor is asking is whether this constitutes a genuine gold price sale is it time to buy, or whether it represents the early stages of something more consequential.
The answer, as with most intelligent investing questions, depends heavily on how you ask it.
When big ASX news breaks, our subscribers know first
The Structural Case for Gold Has Not Changed
Before examining entry mechanics, it is worth anchoring the analysis in context. Gold has appreciated approximately 65.2% over the past 12 months and an extraordinary 168.2% across the past three years. These are not the numbers of a metal in structural decline.
Over a 26-year period, gold has delivered an average annual return of 11.0%, meaningfully outpacing the 8.1% average annual return of US equities over the same timeframe. This long-cycle performance data is not widely cited in mainstream financial media, where gold is often dismissed as a non-yielding relic. The reality embedded in the numbers tells a different story.
The macro environment underpinning this performance includes:
- Persistent global inflationary pressure driven by simultaneous supply shocks across energy, food, and manufacturing sectors
- Erosion of fiat currency credibility, particularly as debt monetisation becomes a structurally embedded feature of major economies
- Central bank reserve diversification, with sovereign institutions globally reducing their US Treasury allocations in favour of gold
- Geopolitical fragmentation driving demand for politically neutral stores of value
Furthermore, central bank gold demand has emerged as one of the most consequential structural forces shaping the current bull cycle, with sovereign institutions collectively accelerating their accumulation programmes well beyond historical averages.
Goldman Sachs set its December 2026 gold price target at $4,900 per ounce, reflecting continued institutional confidence in gold's structural demand drivers rather than any speculative positioning.
These forces do not evaporate during an 8% price correction. What changes during a correction is sentiment, not fundamentals.
What the Current Correction Actually Tells Us
Quantifying the Pullback Against Historical Norms
An 8% drawdown within a multi-year bull market is, by historical standards, relatively modest. Gold's long-cycle advances have routinely included corrections of 10 to 20% without interrupting the primary trend. The table below places the current situation in quantitative context:
| Metric | Current Data |
|---|---|
| Recent Peak Price | ~$4,900/oz |
| Current Trading Range | ~$4,500/oz |
| Correction Magnitude | ~8% |
| 1-Year Price Appreciation | 65.2% |
| 3-Year Cumulative Growth | 168.2% |
| Goldman Sachs Dec 2026 Target | $4,900/oz |
| Gold's 26-Year Avg Annual Return | 11.0% vs. 8.1% (US equities) |
The critical nuance here is that while the percentage decline is manageable, the absolute price level matters enormously for entry quality. Buying into a metal that has already appreciated 168% over three years requires a fundamentally different risk framework than buying early in a cycle. Reviewing a detailed gold price forecast helps contextualise whether current levels represent genuine value or simply a pause within an extended advance.
Important note for investors: At historically elevated valuation levels, entry strategy and position sizing carry far greater weight than they do at cycle lows. Investors seeking short-term gains face a structurally compressed upside window following such an extended advance.
How Technical Indicators Define the Quality of a Buy Signal
The Stochastics Oscillator as a Tactical Tool
Technical analysis, when applied to commodity markets, functions most effectively as a probability tool rather than a prediction mechanism. The 14,7,7 series Stochastics oscillator is among the most widely respected momentum indicators in precious metals trading, and its current readings carry meaningful implications for entry timing.
The Stochastics oscillator works by comparing a security's closing price to its price range over a defined lookback period, then smoothing that reading across two additional time periods. When the lead line reaches deeply oversold territory, it historically signals that selling momentum is exhausting itself, creating conditions where a price reversal becomes statistically more probable.
Crucially, however, an oversold oscillator reading alone is not sufficient justification for a high-conviction position. The framework that separates speculative entries from strategic ones requires an additional component: structural price support.
Why Support Convergence Is the Decisive Factor
A particularly instructive precedent occurred in a prior cycle where three conditions aligned simultaneously:
- The Dow Jones Industrial Average held major structural support at the 45,000 level
- Gold maintained its $4,400 per ounce support zone
- The Stochastics oscillator reached deeply oversold territory across the precious metals complex
The result of that convergence was remarkable. The COPX copper mining ETF surged approximately 30% within a single month from that buy zone. Select junior mining stocks recorded gains of 100% or more across the same period. In addition, understanding how gold and mining equities interact during these convergence events is essential for calibrating position sizing across the broader resource complex.
The current environment features the oscillator signal but lacks the confirmed structural support floors in gold and broader equity markets. This distinction defines the entire entry quality debate.
Classifying Your Entry: A Framework
| Entry Classification | Required Conditions | Appropriate Position Size |
|---|---|---|
| Speculative / Tactical | Oscillator oversold signal only | Small, capital preservation focus |
| Strategic / Investor-Grade | Oscillator oversold + major price support | Larger, conviction-based |
| High-Conviction Accumulation | Multi-asset support convergence | Full allocation deployment |
Based on current conditions, most precious metals positions initiated today fall squarely in the speculative to tactical category.
Silver, Copper Miners, and Junior Stocks: Relative Opportunity Assessment
Silver's Marginal Technical Advantage
Within the current precious metals landscape, silver presents a marginally stronger technical case than gold itself. The metal has pulled back from approximately $83 per ounce to the $70 level, representing a correction of roughly 16%, which is twice the percentage decline seen in gold.
Critically, silver is holding above its most recent cycle low, and the $70 support zone represents an identifiable technical floor that gold currently lacks. This combination of an oversold oscillator reading and the presence of a structural support level elevates silver's entry quality relative to gold in the current environment. Monitoring the gold-silver ratio provides additional context for assessing relative value between the two metals at this stage of the cycle.
Silver's dual identity as both a monetary metal and an industrial input creates a more layered demand profile:
- Monetary demand tracks gold's performance during periods of currency instability
- Industrial demand is driven by solar panel manufacturing, electronics, and EV battery applications
- Investment demand via ETFs and physical bullion has grown significantly in recent years
Copper-Linked Mining Equities
Copper mining stocks, tracked via instruments such as the COPX ETF, currently sit in a technical buy zone based purely on oscillator positioning. The oscillator setup, viewed in isolation, looks constructive. However, the absence of confirmed support in both gold and broader equity indices means this entry lacks the convergence that produced the prior cycle's exceptional 30% one-month return.
For investors considering copper mining exposure at current levels, this is a speculative entry only, and position sizing should reflect that classification.
Junior Miners: The Highest-Leverage Play Requires the Most Patience
Junior mining stocks occupy a unique position in the precious metals ecosystem. When confirmed buy zones emerge with full technical convergence, junior miners historically amplify gold's price moves in extraordinary fashion. A 10% appreciation in gold has translated into 100% or more for select junior mining stocks during high-conviction buy zones.
The leverage dynamic operates symmetrically in both directions, which is why position discipline is non-negotiable in this segment.
The Canadian Venture Exchange (CDNX) serves as a reliable proxy for junior miner sentiment. At the time of this analysis, the CDNX Stochastics oscillator had not yet reached full oversold territory, suggesting the optimal entry signal remained several trading days away.
Strategic note: Junior resource stocks are not appropriate for all investor profiles, particularly in large allocations. Within a diversified precious metals portfolio, selective junior exposure during confirmed buy zones has historically delivered outsized returns relative to senior miners and ETFs. The current environment calls for patience rather than urgency.
Senior Gold Miners: Measured Accumulation in a Partial-Signal Environment
Senior gold mining equities, tracked via instruments such as the GDX index, function as a middle-ground exposure between physical gold and speculative junior positions. They offer more predictable cash flow profiles, established operational histories, and lower company-specific risk than their smaller counterparts, but they sacrifice the exponential upside potential that junior miners can deliver during confirmed bull cycles.
The current technical setup for senior miners mirrors the broader precious metals complex: oscillator positioning is constructive, but the absence of major structural support floors argues for measured rather than aggressive accumulation.
A comparative overview of current entry quality across the precious metals complex:
| Asset Class | Signal Strength | Price Support Present? | Recommended Approach |
|---|---|---|---|
| Physical Gold | Oscillator oversold | No clear floor | Small tactical entry |
| Silver | Oscillator oversold | Yes, ~$70 zone | Small-to-moderate entry |
| Copper Mining ETFs | Oscillator positioned | No convergence | Speculative only |
| Silver Mining ETFs | Oscillator strong | No major floor | Small tactical entry |
| Junior Miners (CDNX) | Near oversold | Approaching signal | Wait for confirmation |
| Senior Mining Equities | Constructive | No convergence | Small accumulation |
The next major ASX story will hit our subscribers first
Building a Decision Framework Based on Your Investor Profile
Long-Term, Buy-and-Hold Investors
For investors operating on a 10-year or longer horizon, the precision of any individual entry point matters far less than consistency of participation. Dollar-cost averaging (DCA) across defined time intervals remains the empirically supported strategy for long-cycle precious metals accumulation.
Gold's 26-year annual return of 11.0% has been captured overwhelmingly by consistent holders rather than tactical traders attempting to time exact bottoms. This is a crucial insight that often gets lost in the excitement of short-term price action.
Most credible financial planning frameworks suggest limiting gold and precious metals exposure to somewhere between 5% and 15% of a total portfolio, depending on risk tolerance and inflation sensitivity requirements. Conservative guidance often starts at 2% to 3% as a minimum hedge position. Understanding the distinctions between physical gold vs ETFs is equally important when deciding how to structure that allocation across different vehicles.
Tactical and Active Investors
For investors who actively manage positions, the current oscillator signals justify partial position construction, with the following principles applied:
- Deploy capital in tranches rather than single lump-sum entries
- Define exit criteria before entering any speculative precious metals position
- Recognise that the current environment is a partial-signal environment, not a full-conviction setup
Investors New to Precious Metals
Beginning with physical gold or broad gold ETFs provides lower-risk exposure to the asset class before progressing to miners or junior stocks. Understanding that gold's primary function in most portfolios is wealth preservation and inflation hedging rather than aggressive capital appreciation is foundational knowledge that should precede any position in the mining equity complex. For instance, JP Morgan's commodities research provides institutional-grade context on the macro forces currently driving gold's performance.
Portfolio principle: Long-term historical data consistently supports time-in-market over timing-the-market. Gold's 26-year average annual return of 11.0% represents performance captured by consistent holders, not tactical traders optimising entry points.
Macro Forces That Could Extend or Interrupt the Bull Cycle
Structural Tailwinds Supporting Continued Appreciation
The macro environment underpinning this gold bull market is not a single-variable story. Multiple reinforcing forces create a persistent demand structure:
- Real purchasing power erosion across most major fiat currencies continues to drive demand for hard asset alternatives
- Sovereign reserve diversification away from USD-denominated assets is a multi-decade structural shift that central bank data consistently confirms
- US fiscal trajectory including long-term deficit expansion and debt monetisation concerns supports demand for inflation-resistant assets
- Geopolitical realignment creates persistent demand for stores of value that carry no counterparty risk or political jurisdiction
Risks That Could Derail the Cycle
No structural bull market is immune to reversal. Honest risk assessment requires acknowledging scenarios that could interrupt gold's trajectory:
- A sharp, unexpected reversal in US dollar strength driven by aggressive monetary tightening
- A deflationary shock that temporarily restores fiat currency appeal relative to hard assets
- Forced liquidation across all asset classes during a severe equity market dislocation
- Coordinated central bank gold reserve selling (historically rare but not without precedent)
Scenario Modelling Through End of 2026
| Scenario | Primary Catalyst | Implied Price Range | Relative Probability |
|---|---|---|---|
| Bull Continuation | Stagflation deepens, central bank buying accelerates | $4,700 to $5,200/oz | Moderate-High |
| Consolidation Phase | Macro uncertainty stabilises, USD firms modestly | $4,200 to $4,700/oz | Moderate |
| Corrective Pullback | Risk-off liquidation, deflationary shock | $3,800 to $4,200/oz | Lower |
The above scenario projections are speculative in nature and should not be interpreted as financial forecasts or investment advice. All scenarios carry inherent uncertainty.
Frequently Asked Questions: Gold Price Sale and Buying Strategy
Is the Current Gold Price Decline a Genuine Buying Opportunity?
The approximately 8% pullback from recent highs creates a tactical entry point, particularly for long-term investors. However, the absence of a major structural price support floor means current signals classify as speculative rather than strategic. Position sizing discipline is essential.
What Is the Goldman Sachs Price Target for Gold in 2026?
Goldman Sachs raised its December 2026 gold price target to $4,900 per ounce, reflecting continued institutional confidence in structural demand drivers including central bank accumulation and sustained macroeconomic instability.
How Much of a Portfolio Should Be Allocated to Gold?
Conservative frameworks typically recommend 2% to 5% as a minimum inflation hedge, while more aggressive precious metals advocates suggest 10% to 15% for meaningful inflation protection. Your specific allocation should align with your risk tolerance, time horizon, and overall portfolio construction. Morningstar's analysis on whether gold is on sale offers additional independent perspective on valuation at current price levels.
What Is the Difference Between Physical Gold and Mining Stocks?
Physical gold delivers direct price exposure with no operational risk. Mining stocks provide leveraged exposure that amplifies both gains and losses relative to the underlying metal, while also introducing company-specific risks including management quality, production costs, and jurisdictional considerations.
What Technical Conditions Create the Highest-Conviction Buy Signals?
Analysts using momentum-based approaches identify the strongest buy signals when oversold oscillator readings converge simultaneously with a confirmed structural price support level across multiple assets. The current environment features the oscillator component but lacks the support convergence that has historically produced the most decisive precious metals rallies.
Key Takeaways: Navigating This Gold Price Sale Strategically
-
The current ~8% correction from ~$4,900 to ~$4,500 per ounce represents a tactical opportunity, but the absence of a major price support floor limits high-conviction entry justification
-
Silver presents a marginally stronger technical case due to an identifiable support zone near $70 per ounce that gold currently lacks
-
Junior mining stocks on the CDNX were approaching but had not yet reached full oversold territory, suggesting that additional patience of several trading days may yield a higher-quality entry point
-
All current precious metals buy signals are best characterised as speculative to tactical rather than strategic-grade, arguing for reduced position sizes
-
Long-term investors are best served by DCA strategies rather than attempting to precisely time corrections within a multi-year bull market
-
The structural macro case for gold — including stagflation dynamics, dollar debasement pressure, and sustained central bank demand — remains fundamentally intact regardless of short-term price volatility
This article is intended for informational and educational purposes only and does not constitute financial advice. Precious metals investing involves significant risk, including the potential loss of all invested capital. Past performance is not indicative of future results. Readers should consult with qualified financial advisors before making any investment decisions.
Further analysis on gold market dynamics and precious metals investment strategy is available at Gold-Eagle.com, which publishes ongoing commentary from a range of market analysts covering both technical and fundamental approaches to precious metals investing.
Want to Know When the Next Major ASX Mineral Discovery Hits the Market?
Discovery Alert's proprietary Discovery IQ model delivers real-time alerts on significant ASX mineral discoveries, instantly translating complex geological data into actionable insights for investors across all experience levels — the same kind of decisive, early-mover intelligence that has historically driven extraordinary returns in junior mining stocks during confirmed precious metals bull cycles. Explore Discovery Alert's dedicated discoveries page to see how historic mineral discoveries have generated substantial market returns, and begin your 14-day free trial to position yourself ahead of the broader market.