August 1, 2026
The Invisible Hand Shaping Gold Markets: When Macro Cycles Override Price Signals
Few market environments test investor discipline more severely than one where short-term signals point upward while the broader structural trend pulls in the opposite direction. This tension between tactical opportunity and strategic caution sits at the heart of precious metals analysis. In the gold market of mid-2026, a gold price exclusive update reveals that tension is not theoretical — it is playing out in real time across price charts, cycle models, and currency dynamics simultaneously.
When big ASX news breaks, our subscribers know first
Why Reading Gold With a Single Lens Fails in Complex Markets
Most retail participants approach gold pricing through a single filter, whether that is the spot price itself, a moving average crossover, or a news-driven narrative about inflation and central bank gold demand. Each of these inputs carries partial truth, but none tells the complete story. Professional technical analysts have long argued that gold requires a layered methodology, combining cycle timing tools, trend direction indicators, sentiment gauges, and intermarket relationships to generate reliable read-outs of where the market sits within its broader structure.
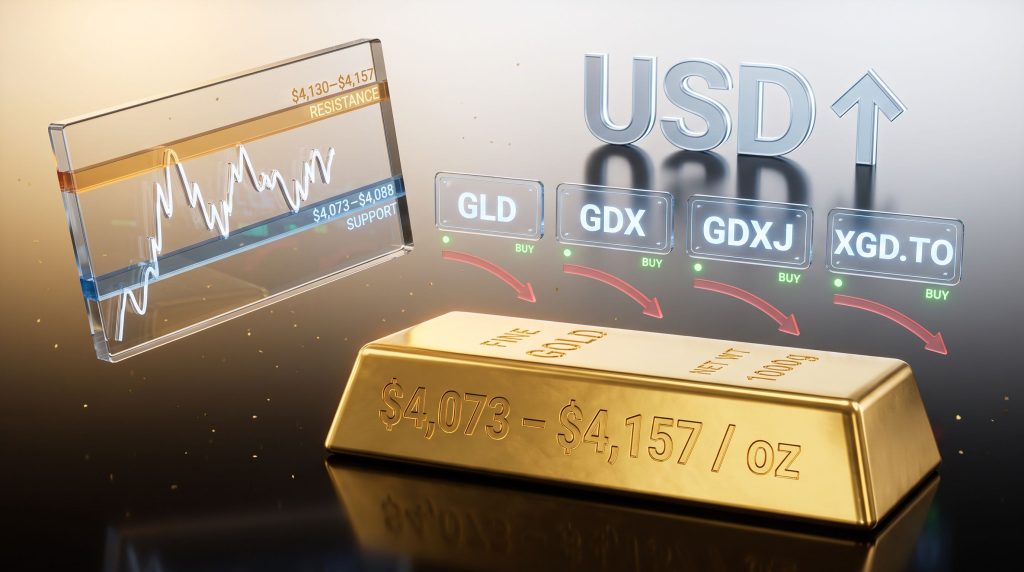
The current gold price exclusive update environment makes this case compellingly. Spot prices have consolidated in the $4,073 to $4,157 per ounce range across major platforms, but the raw price level alone reveals almost nothing about whether that consolidation represents a coiling spring before a breakout or a pause before a fresh leg lower. The answer to that question requires examining multiple signals in combination.
How Cycle Indicators, Trend Models, and USD Dynamics Work Together
Proprietary cycle indicators are designed to do something that standard oscillators and momentum tools struggle to achieve consistently: they attempt to identify where a market sits within its recurring rhythmic structure, separate from the noise of daily price action. When a cycle model reads bearish, it is asserting that the probabilistic weight of the current environment favours downside pressure over the medium term, even if brief tactical rallies interrupt that trajectory.
Trend models operate on a complementary but distinct basis. Where cycle tools measure rhythmic position, trend models measure directional persistence. A confirmed downtrend in gold means that successive price peaks and troughs are forming lower than their predecessors, and that selling pressure is structurally outweighing demand at prevailing price levels. Understanding gold's secular cycles is therefore essential for any investor trying to distinguish short-term noise from meaningful structural shifts.
The USD relationship adds a third dimension entirely. Gold is priced in US dollars globally, which means that when the dollar strengthens in sustained fashion, gold faces a mechanical headwind that operates independently of supply, demand, or geopolitical conditions. Historically, periods of confirmed dollar uptrends have coincided with extended gold corrections or prolonged sideways consolidation phases.
Current Spot Price Landscape: What the Numbers Are Telling Traders
As of early August 2026, gold spot prices vary meaningfully across platforms, a reflection of bid-ask spreads, data sourcing methodologies, and the timing of price feeds. Furthermore, the spread across sources is not a data anomaly — it reflects genuine differences in how pricing is accessed across markets.
| Source | Spot Price (USD/oz) | 24-Hour Change |
|---|---|---|
| Monex | $4,073.00 | -$32.00 |
| BullionVault | $4,157.07 | Varies |
| Investing.com | $4,130.20 | Mixed |
| Trading Economics (July 7, 2026) | $4,132.28 | -0.78% |
| Bloomberg Range (Late June 2026) | $4,088-$4,096 | Varies |
For those wanting to track movements in real time, live gold price data can provide a useful reference alongside longer-term analytical frameworks. Physical gold buyers and ETF investors operate in different pricing environments, and the gap between wholesale interbank pricing and retail-accessible quotes can be meaningfully wide during periods of elevated volatility.
The $32 intraday decline observed on the Monex feed signals that sellers are maintaining active pressure at the upper end of this range, consistent with the broader bearish cycle reading.
Price consolidation between $4,073 and $4,157 creates a deceptively calm visual impression on charts. The absence of a sharp directional move does not indicate equilibrium between buyers and sellers. In many historical instances, compressed price ranges of this type have preceded accelerated directional moves once the consolidating structure resolves.
Signal Divergence: Short-Term Buys Within a Bearish Macro Structure
One of the most analytically important dynamics in the current gold market is the divergence between short-term instrument signals and the macro cycle backdrop. GLD, GDX, GDXJ, and XGD.TO have all generated short-term buy signals. Yet the overarching cycle indicator remains pointed downward.
| Instrument | Short-Term Signal | Macro Trend |
|---|---|---|
| GLD (Gold ETF) | Buy | Down |
| GDX (Gold Miners ETF) | Buy | Down |
| GDXJ (Junior Miners ETF) | Buy | Down |
| XGD.TO (TSX Gold Index) | Buy | Down |
This configuration is not a contradiction. It is a well-documented feature of bear cycle environments: periodic short-term rallies generate tactical buy signals that can be exploited by active traders without invalidating the longer-duration bearish structure. The critical distinction lies in how each market participant uses these signals relative to their own time horizon and risk tolerance.
A short-term buy signal in a confirmed downtrend is a tactical tool, not a trend reversal confirmation. Treating it as the latter is one of the most common and costly errors made by investors who apply trading-oriented signals to long-term portfolio decisions.
Speculative Sentiment at Bear Market Valuations: What This Means in Practice
Current speculative positioning in gold sits at levels consistent with bear market valuations. This is a condition that experienced technical analysts monitor closely because it carries a dual implication that is not always well understood. Indeed, the relationship between gold and economic cycles helps explain why depressed sentiment at cycle lows does not automatically signal a floor has been reached.
On one hand, depressed speculative sentiment reduces the pool of marginal sellers. When leveraged speculative longs have largely been washed out, the immediate downside pressure from forced liquidation diminishes. This is what creates the conditions for short-term tactical rallies to develop, even within a structurally bearish cycle.
On the other hand, bear market speculative valuations do not automatically signal that a floor has been reached. Counter-trend buy conditions had not been confirmed as of the August 2026 gold price exclusive update. This distinction matters enormously for investors making allocation decisions with multi-month or multi-year time horizons.
The USD Uptrend: Gold's Most Persistent Structural Headwind
The confirmed uptrend in the US dollar represents the single most important intermarket factor suppressing gold pricing momentum in the current environment. The relationship between dollar strength and gold weakness is well-established in historical data, but the mechanism deserves closer examination.
When the USD strengthens against a basket of major currencies, it effectively raises the real cost of gold for buyers operating in those currencies. This reduces international demand at the margin, contributing to lower price ceilings even when domestic US demand for gold remains relatively firm. Additionally, a rising dollar typically reflects tightening financial conditions or positive economic momentum perceptions, both of which reduce the urgency of safe-haven allocations.
Federal Reserve policy uncertainty has added complexity to this picture throughout mid-2026. Markets have been recalibrating interest rate expectations repeatedly, and each recalibration has produced a corresponding ripple through gold pricing. Higher-for-longer rate expectations reinforce dollar strength and suppress gold, while any signal of easing tends to produce a short-lived gold spike that fades once the dollar reasserts its trend.
Historical Precedents From Technical Cycle Analysis
The analytical methodology being applied to the current gold market has a documented track record of identifying major inflection points across asset classes. Specific historical examples of confirmed cycle turning points include:
- The identification of the new gold bull market at its inception in 2001
- A confirmed sell signal at the equity market top in 2007, preceding the global financial crisis correction
- Recognition of the US dollar bottom in 2011, which corresponded with the peak of the gold bull run that year
- A NASDAQ peak warning issued in 2000, ahead of the dot-com collapse
These precedents do not guarantee that current cycle readings will prove equally accurate. Markets evolve, correlations shift, and no technical model operates with perfect foresight. However, they illustrate that multi-signal cycle-based methodologies have historically captured structural turning points that single-indicator approaches missed entirely.
The next major ASX story will hit our subscribers first
Key Technical Levels: Support, Resistance, and the Consolidation Resolution
Understanding where gold is likely to find buying support and where selling pressure concentrates is essential for both traders managing active positions and investors monitoring re-entry opportunities.
| Zone | Price Range (USD/oz) | Significance |
|---|---|---|
| Near-Term Support | $4,073-$4,088 | Short-term floor based on recent session lows |
| Mid-Range Pivot | $4,100-$4,115 | Contested zone between bulls and bears |
| Resistance Cluster | $4,130-$4,157 | Breakout confirmation zone |
A sustained move below $4,073 would signal that the consolidation has resolved to the downside, opening the path toward lower support levels. Conversely, a decisive close above $4,157 on meaningful volume would challenge the bearish cycle thesis and warrant reassessment. Until either of those directional resolutions occurs, the consolidation pattern warrants patience rather than anticipatory positioning.
Gold Equities vs. Physical Gold: A Sector-Specific Risk Framework
Gold mining equities carry a layered risk profile that pure physical gold exposure does not. During confirmed downtrends in gold pricing, miners and exploration companies face compounding pressures: declining revenue assumptions, operational cost structures that remain relatively fixed, and reduced investor appetite for equity-linked commodity exposure. Consequently, the interplay between gold and mining equities demands careful attention during bearish macro environments.
Junior miners, as represented by GDXJ, carry the highest sensitivity to these dynamics. Smaller balance sheets, higher operational leverage, and limited hedging capacity mean that junior producers and developers experience amplified price swings in both directions relative to the physical metal. Senior producers, while better positioned to weather sustained downturns through hedging and diversified production profiles, still face meaningful earnings compression when gold trends lower for extended periods.
The short-term buy signals on both GDX and GDXJ should be contextualised within this structural reality. A tactical rally in mining equities during a bearish gold cycle typically reflects oversold technical conditions being relieved rather than a fundamental re-rating of sector prospects.
Positioning Strategy for the Current Environment
The appropriate response to this confluence of signals differs significantly depending on whether a participant is operating as a long-term investor or an active short-term trader.
For long-term investors: The macro cycle reading is bearish, the trend is down for both gold and gold equities, the USD trend is upward, and counter-trend buy conditions remain unconfirmed. Maintaining cash or hedged exposure reduces drawdown risk while preserving the ability to re-enter at more technically favourable levels when conditions shift. Monitoring the gold-silver ratio analysis can also provide additional context for timing re-entry decisions across precious metals broadly.
For active traders: Short-term buy signals across GLD, GDX, GDXJ, and XGD.TO present defined tactical opportunities. These should be approached with:
- Clearly defined entry points aligned with cycle bottom signals
- Predetermined exit targets near cycle tops rather than open-ended holding periods
- Disciplined stop-loss placement to limit downside if the macro trend accelerates lower
- Position sizing that reflects the counter-trend nature of the trade — smaller than primary trend positions
Speculative positioning in a bearish gold cycle requires a fundamentally different mindset than investing during a confirmed bull cycle. The objective shifts from riding momentum to harvesting short-duration dislocations, and the risk management framework must reflect that distinction.
Frequently Asked Questions: Gold Price Signals in August 2026
What does it mean when a gold cycle indicator turns down?
A bearish cycle reading indicates that the probabilistic weight of the current market structure favours continued downside or limited upside over the medium term. It does not mean gold cannot rally in the short term. It means that the primary directional bias remains negative until cycle conditions shift.
Can gold ETFs like GLD and GDX still be profitable during a downtrend?
Yes, but only through disciplined tactical trading between cycle inflection points, not through passive holding. Short-term buy signals within downtrends create tradeable rallies, but they require active management and defined exits to generate net positive returns.
What is the difference between a counter-trend buy and a primary trend buy?
A primary trend buy occurs when the macro cycle, trend model, and sentiment indicators all align bullishly. A counter-trend buy is a tactical entry against the prevailing trend direction, made when oversold conditions are severe enough to anticipate a temporary recovery. The latter carries significantly higher risk and requires stricter risk management.
Key Takeaways for August 2026
- The macro cycle indicator for gold remains bearish, making capital preservation the appropriate primary strategy for long-term investors
- Short-term buy signals across GLD, GDX, GDXJ, and XGD.TO represent tactical opportunities within a larger bearish structure, not trend reversal confirmation
- The confirmed USD uptrend is the dominant intermarket headwind suppressing gold and gold equity momentum
- Gold is consolidating in the $4,073 to $4,157 per ounce range, with directional resolution approaching
- Speculative sentiment sits at bear market valuation levels, reducing but not eliminating further downside risk
- Counter-trend buying conditions remain unconfirmed, making premature strategic re-entry a high-risk proposition
Disclaimer: This article is for informational and educational purposes only. It does not constitute financial advice, investment recommendations, or a solicitation to buy or sell any financial instrument. All technical analysis, cycle models, and price data referenced involve inherent uncertainty. Past performance of technical indicators is not a reliable guide to future outcomes. Readers should conduct independent research and consult qualified financial advisers before making any investment decisions. Gold and gold equity investments carry significant risk, including the potential loss of principal.
Want to Stay Ahead of the Next Major ASX Mineral Discovery?
While macro cycles and technical signals shape gold markets, the biggest wealth-creation moments in the resources sector often come from significant new discoveries — and timing is everything. Discovery Alert's proprietary Discovery IQ model scans ASX announcements in real time, delivering instant alerts on high-potential mineral discoveries across 30-plus commodities, so subscribers can act before the broader market catches on. Explore historic discovery returns that demonstrate just how transformative early positioning can be, and begin a 14-day free trial today at Discovery Alert to gain your market-leading edge.