June 6, 2026
When Cycles Turn: Reading the Bearish Signals Emerging Across the Gold Market
Precious metals markets operate in rhythms. Decades of price history reveal that gold does not trend in a straight line, even during structural bull markets. Instead, it moves through defined cycles of expansion and contraction, with each phase carrying distinct implications for how traders position themselves and how investors interpret risk. Understanding where gold sits within its current cycle is often more actionable than fixating on long-term fundamentals alone.
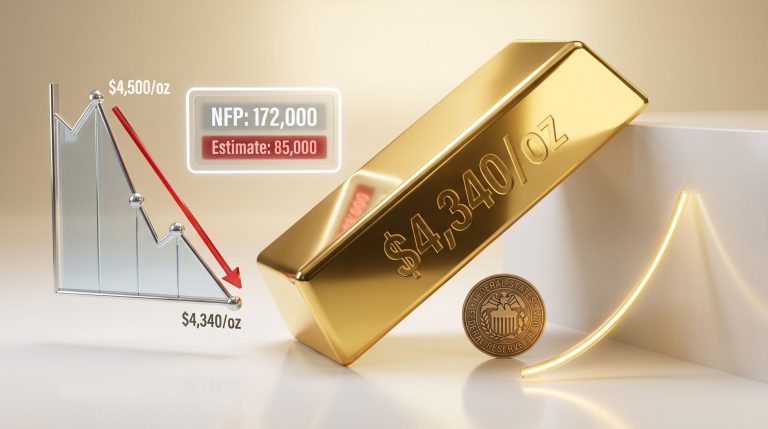
Right now, the technical picture for gold is flashing a consistent set of warnings across multiple instruments, timeframes, and analytical frameworks. A gold price update bearish signal is not simply a single indicator misfiring; it is a convergence across cycle tools, price action, currency dynamics, and speculative positioning data that collectively point toward near-term downside risk.
When big ASX news breaks, our subscribers know first
The Cycle Indicator Has Flipped: What That Actually Means
Cycle-based technical analysis treats price movement as a series of repeating oscillations rather than random noise. When a proprietary cycle indicator transitions from an upward phase to a downward phase, it reframes the probability distribution for near-term price outcomes.
Practically speaking, this shift matters differently depending on your investment horizon:
- Long-term investors typically accumulate positions during upward cycle phases, building exposure with the intention of holding through short-term volatility. When the cycle turns down, they reassess whether to add to holdings or simply hold existing positions without adding new capital.
- Short-term traders operate with a more surgical approach, targeting entry near confirmed cycle bottoms and exiting near cycle tops. For this group, a downward cycle classification is a direct signal to step aside or reduce exposure until a new bottom forms.
The critical nuance here is that a cycle moving into a down phase is not automatically a declaration that the long-term bull market has ended. Historical gold bull runs, including the multi-year advance from 2001 through 2011, contained numerous corrective phases where cycle indicators turned bearish before the larger uptrend eventually reasserted itself. Furthermore, reviewing the broader gold market outlook helps contextualise whether these cycle shifts represent temporary pauses or deeper structural concerns.
What the Technical Levels Are Telling Traders
Price structure analysis provides a concrete framework for evaluating where gold stands relative to key decision points. The current setup shows a metal struggling beneath multiple layers of resistance while the trajectory of weekly closes trends lower.
Key Price Levels to Monitor
| Technical Level | Significance | Current Status |
|---|---|---|
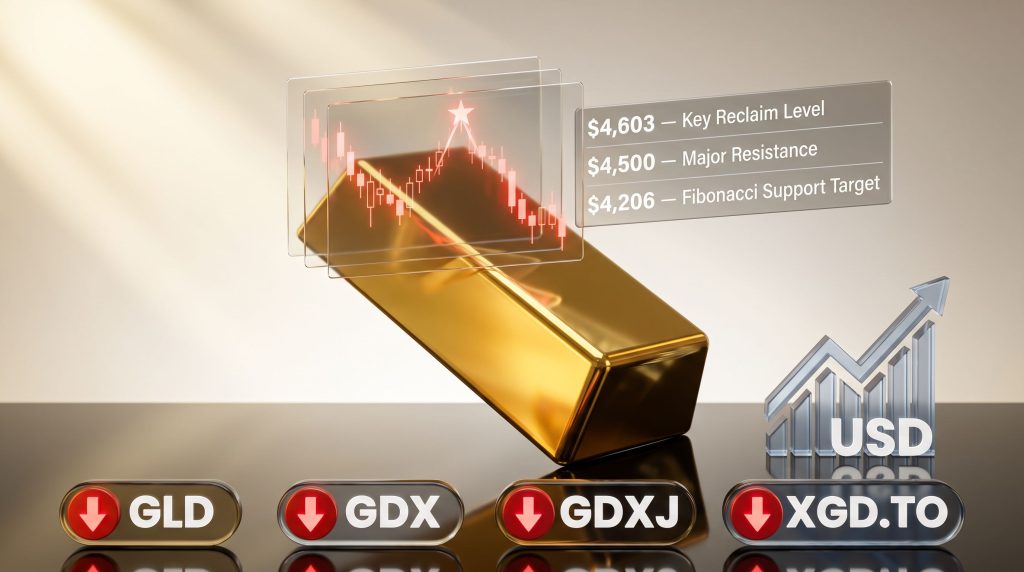
| $4,603 | Critical reclaim level for bullish reassertion | Price trading below |
| $4,500 | Major resistance zone, repeated failure point | Unbroken resistance |
| 100-Day Moving Average | Medium-term trend filter | Acting as overhead cap |
| $4,331 to $4,463 | June 5, 2026 trading range | Active downside zone |
| $4,206 | Fibonacci support target on further weakness | Downside risk level |
The failure to reclaim $4,500 is particularly telling. When a previously important level converts from support to resistance, it signals a meaningful shift in the balance of buying and selling pressure. Sellers have repeatedly defended this zone, preventing rallies from gaining traction.
The appearance of a shooting-star candlestick pattern on recent charts reinforces seller conviction. This pattern, characterised by a long upper wick and small real body near the session low, indicates that buyers attempted to push prices higher but were aggressively overwhelmed before the close. It is one of the more reliable single-candle reversal signals in technical analysis, particularly when it appears at or near established resistance zones.
A shooting-star formation near resistance does not guarantee further downside, but it does raise the probability that sellers are more motivated than buyers at current price levels. Combined with a declining cycle indicator, it strengthens the bearish case considerably.
Broad Instrument Alignment: Not Just a Gold Problem
One of the more significant aspects of the current gold price update bearish signal environment is how consistently it appears across the full spectrum of gold-related instruments. This is not a case of spot gold weakening while miners hold up, or vice versa. The weakness is uniform.
| Instrument | Asset Class | Current Signal | Trend Direction |
|---|---|---|---|
| GLD | Physical Gold ETF | Short-term sell | Down |
| GDX | Senior Gold Miners ETF | Short-term sell | Down |
| GDXJ | Junior Gold Miners ETF | Short-term sell | Down |
| XGD.TO | TSX Gold Index | Short-term sell | Down |
The alignment across GLD, GDX, GDXJ, and XGD.TO is worth examining more closely because each of these instruments carries a different risk profile and responds to slightly different market forces.
GDX, which tracks senior gold producers, tends to move with a leverage ratio of roughly 2x to 3x relative to gold spot price. When gold declines, miners often fall further because their profit margins compress at lower gold prices, amplifying the downside. In addition, understanding gold miners' sensitivity to price moves is essential for positioning across the equity spectrum during bearish phases.
GDXJ, the junior miners ETF, carries even greater sensitivity. Junior companies typically have smaller balance sheets, higher operating costs relative to revenue, and less hedging capacity. Their elevated beta means they can fall sharply during bearish phases, making them particularly high-risk instruments when the overall trend is negative.
XGD.TO, the Canadian gold sector index, reflects the large number of gold mining companies listed on the Toronto Stock Exchange. Canada hosts some of the world's most significant gold producers, and alignment between XGD.TO and its US counterparts signals that the bearish sentiment is genuinely global rather than geographically isolated.
The USD Uptrend: A Structural Headwind That Cannot Be Ignored
Gold is denominated in US dollars on global markets. This creates a mechanical inverse relationship: when the dollar strengthens, gold's price in USD terms tends to fall, even if demand conditions remain otherwise unchanged.
The current technical picture shows the USD in an uptrend, which creates a persistent headwind for gold pricing. Beyond the mechanical effect, a rising dollar also suppresses demand from international buyers. When the dollar is strong, gold becomes more expensive in local currency terms for buyers in Europe, Asia, and elsewhere, reducing the volume of purchasing interest that might otherwise support prices.
When the gold-to-USD ratio moves onto a sell signal simultaneously with a rising dollar trend, it confirms that the pressure on gold is not simply a temporary fluctuation. It reflects a meaningful shift in relative value dynamics between the two assets.
This interplay between currency momentum and commodity pricing is a well-established relationship in macroeconomic analysis. Federal Reserve policy decisions, US inflation data, and Treasury yield movements all influence USD direction, which in turn feeds back into gold's price trajectory. Consequently, gold safe-haven demand can be significantly undermined during periods of sustained dollar strength, even when other fundamental drivers remain supportive.
Speculative Positioning Has Reached Bear Market Valuation Levels
Beyond price action and currency dynamics, the positioning data adds another layer of concern. Speculative interest in gold has declined to levels consistent with bear market valuations. This is a meaningful observation because speculative positioning often acts as a sentiment gauge, reflecting how aggressively the market is leaning in one direction.
When speculative positioning falls sharply, it can be interpreted in two different ways depending on context:
- As a contrarian buy signal, if the decline in speculation coincides with a cycle bottom and oversold conditions, suggesting that weak hands have exited and the market is primed for recovery.
- As a confirming bearish signal, if the positioning decline is still in progress and cycle indicators remain pointed downward, suggesting further liquidation pressure ahead.
Given that the cycle indicator is currently down and price has not yet found a confirmed bottom, the current speculative positioning data aligns more closely with the second interpretation. For further technical context, current gold price data provides a useful reference for monitoring where these speculative dynamics are playing out in real time.
The next major ASX story will hit our subscribers first
The Breakout Cycle Has Concluded: Context for Long-Term Bulls
Technical analysts who use cycle frameworks often distinguish between different types of upward phases within a broader bull market. A breakout cycle refers to a period of particularly strong and sustained upward momentum that pushes prices to new highs decisively and with expanding volume.
The observation that the prior breakout cycle of the gold bull market has now concluded does not mean the entire bull market is over. It means the most aggressive phase of recent upside momentum has run its course, and the market is likely entering a corrective or consolidation period before the next leg potentially develops.
Historical analogies are instructive here. Gold's bull market between 2008 and 2011 included multiple corrective phases of 10% to 20% before ultimately reaching its peak. Investors who understood that these pullbacks were cycle-phase events rather than trend reversals were able to maintain or rebuild positions at more favourable levels.
What Would Reverse the Bearish Setup?
Technical bearish configurations can be invalidated by both price-based events and fundamental developments. Traders monitoring the current situation should watch for:
- A convincing close above $4,603, which would signal that buyers have reclaimed the critical level needed to reassert bullish control
- Formation of a confirmed cycle bottom on the proprietary cycle indicator, which would give short-term traders a defined re-entry signal
- A reversal in USD momentum tied to shifts in Federal Reserve policy, particularly if rate cut expectations accelerate
- A sharp escalation in geopolitical risk events that drives safe-haven demand for gold beyond current levels
- Evidence of central bank gold demand acceleration, which represents structural demand that can absorb selling pressure over time
- Inflation re-acceleration data that surprises markets to the upside, reigniting gold's role as a monetary hedge
None of these catalysts are currently dominant in the technical picture, which is why the baseline remains bearish until signals change.
Positioning Strategy Across Different Investor Profiles
How traders and investors should respond to the current setup depends heavily on their time horizon and risk tolerance.
| Investor Type | Recommended Approach | Trigger for Action |
|---|---|---|
| Short-Term Trader | Hold cash, await cycle bottom confirmation | Confirmed cycle low formation |
| Long-Term Accumulator | Maintain existing positions, monitor support | Structural trend reversal evidence |
| Risk-Averse Investor | Reduce speculative exposure | Cycle indicator turns upward |
For short-term traders, patience is the operative discipline right now. Attempting to catch a falling knife by entering long before a cycle bottom is confirmed historically produces poor risk-adjusted outcomes. Waiting for the cycle indicator to bottom and then confirm a new upward phase significantly improves the probability of a successful trade entry.
For long-term investors, the situation is less urgent but still warrants attention. Existing positions built during prior upward cycles can be held within a framework of managing overall portfolio exposure, however adding new speculative positions ahead of a confirmed bottom carries elevated risk. It is also worth monitoring the gold-silver ratio as a secondary indicator, since shifts in this relationship often precede or confirm broader turning points in precious metals sentiment.
FAQ: Understanding the Current Gold Bearish Signal Environment
What does a short-term sell signal on gold actually mean?
A short-term sell signal indicates that the near-term directional bias favours lower prices based on the current technical configuration. It does not mean gold will fall indefinitely. It means the probability distribution for the next price move leans bearish until the signal reverses.
Can gold be bearish short-term while remaining in a long-term bull market?
Yes. Long-term bull markets in gold have historically included multiple corrective phases, some lasting weeks to months, before the uptrend resumed. Short-term bearish signals are a normal feature of bull market cycles, not necessarily evidence that the structural trend has changed.
Why does a rising USD pressure gold prices?
Gold is priced in US dollars globally. When the dollar strengthens, it mechanically reduces gold's price in USD terms because it takes fewer dollars to purchase the same amount of gold. Additionally, dollar strength makes gold more expensive for international buyers, compressing demand from non-US markets.
What does speculative positioning at bear market levels indicate?
It signals that speculative interest has retreated significantly from recent highs. Depending on cycle positioning, this can be either a contrarian buying opportunity or a confirming bearish indicator. In the current context, where cycle indicators remain pointed downward, it leans toward the latter. Analysts tracking these dynamics have noted growing bearish signals building across multiple timeframes, reinforcing the cautious stance.
What price levels should traders monitor most closely right now?
The most critical levels are $4,603 on the upside as the reclaim target for bullish recovery, $4,500 as the unbroken resistance zone, and $4,206 as the Fibonacci-derived downside support target if weakness continues. This gold price update bearish signal environment reinforces the importance of respecting these defined technical thresholds rather than anticipating reversals prematurely.
This article is intended for informational and educational purposes only. It does not constitute financial or investment advice. All technical analysis involves inherent uncertainty, and past signal performance does not guarantee future results. Readers should conduct their own research or consult a licensed financial adviser before making investment decisions.
Want To Be First When Gold's Next Major Discovery Hits the ASX?
While navigating gold's bearish technical signals requires patience, the next significant mineral discovery can emerge at any time — and speed is everything. Discovery Alert's proprietary Discovery IQ model delivers real-time alerts on significant ASX mineral discoveries, instantly translating complex data into actionable insights for traders and investors alike. Explore historic discovery returns on Discovery Alert's dedicated discoveries page and begin your 14-day free trial today to ensure you're positioned ahead of the broader market when the cycle turns.