
July 22, 2026
The Hidden Architecture Behind Gold's Record Price Surge
Few financial phenomena are as counterintuitive as a market trading at all-time highs while simultaneously flashing short-term warning signals. This gold price exclusive update covers spot prices ranging between $4,500 and $4,725 per ounce across major bullion platforms in mid-May 2026, whilst short-term technical trends point decidedly downward. For investors accustomed to treating price levels as the primary signal, this environment demands a more sophisticated analytical framework.
Understanding what is actually driving this divergence requires separating two distinct forces operating simultaneously: the long-cycle structural demand architecture that has pushed gold to record nominal territory, and the shorter-term mechanical pressures that are temporarily constraining upward momentum. These forces are not contradictory; they represent different timeframes operating within the same market.
The Macro Architecture Supporting Elevated Gold Prices
The scale of central bank gold demand over recent years represents a fundamental shift in how sovereign reserve managers approach monetary stability. Rather than treating gold as a legacy asset from the Bretton Woods era, central banks across emerging and developed markets have repositioned the metal as an active hedge against the weaponisation of the US financial system through sanctions and payment system exclusions.
Several structural forces have converged to create gold's current price environment:
- Central bank reserve diversification from USD-denominated assets has created a persistent institutional demand floor that retail sentiment cannot replicate or eliminate
- Geopolitical fragmentation across multiple theatres has embedded a durable risk premium into gold's price that differs fundamentally from the episodic spikes seen in previous decades
- Monetary policy uncertainty remains elevated, with real interest rates still functioning as gold's most reliable medium-term macro predictor despite the relationship becoming more complex
- Sovereign debt expansion across G7 nations has intensified long-term concerns about purchasing power erosion, reinforcing gold's structural appeal as a fixed-supply monetary asset
The current gold market is not responding to a single catalyst. It reflects a convergence of monetary policy uncertainty, persistent geopolitical risk premiums, and multi-decade structural demand cycles from institutions whose buying behaviour creates price floors rather than speculative spikes.
The Chinese central bank's accumulation trajectory illustrates this dynamic concretely. Since late 2022, the People's Bank of China has substantially increased gold reserves whilst simultaneously reducing US Treasury holdings. This demonstrates how gold has become integral to financial sovereignty strategies for nations seeking to reduce exposure to external financial system vulnerabilities. Furthermore, similar patterns have emerged across Thailand, India, Kazakhstan, and multiple smaller emerging market central banks, creating a geographically distributed demand base that previous bull markets never featured.
When big ASX news breaks, our subscribers know first
How Proprietary Cycle Indicators Work in Gold Market Analysis
The Timing Mechanism Behind Cycle-Based Trading Frameworks
Cycle indicators in commodity markets are built around identifying rhythmic price oscillations — the recurring periods of institutional accumulation and distribution that repeat across different timeframes with enough regularity to be exploitable. Unlike fundamental analysis, which asks why prices should move, cycle models focus exclusively on when conditions favour entry or exit, functioning as timing filters rather than valuation tools.
Technical analyst Jack Chan of Simply Profits, who has been active in markets since purchasing his first mining stock in 1979, has published cycle-based gold market updates through Gold-Eagle.com for many years. His proprietary framework distinguished itself by identifying the NASDAQ top in 2000, the new gold bull market in 2001, the stock market top in 2007, and the US dollar bottom in 2011 — a track record that lends credibility to his methodology even when individual signals carry uncertainty.
The framework operates around two primary participant types with distinct strategic applications:
| Participant Type | Cycle Signal Interpretation | Strategic Application |
|---|---|---|
| Long-Term Investor | UP cycle = accumulation phase | Build and hold positions through dips |
| Short-Term Trader | UP cycle + buy signal = timed entry | Enter at cycle bottoms, exit at cycle tops |
| Risk-Averse Allocator | Mixed trend signals | Wait for trend confirmation before committing |
What the Current UP Cycle Reading Means in Practice
As of May 16, 2026, the proprietary cycle indicator registered an UP reading, signalling that the market has entered or is sustaining an accumulation phase. For long-term investors, this supports building or maintaining positions and treating short-term price weakness as an entry opportunity rather than a reason to reduce exposure.
For active traders, cycle turning points define the tactical windows for short-duration positions, with cycle bottoms representing preferred entry conditions and cycle tops defining exit targets for profit-taking. Monitoring the gold price outlook alongside these cycle signals provides a more complete picture of where momentum may be heading.
The critical limitation that experienced practitioners acknowledge is that cycle signals are directional filters, not standalone trade triggers. Volatility can temporarily override cyclical patterns, producing short-term whipsaws that shake out positions established on cycle signals alone. The current environment, where the cycle reads UP against a downward price trend, represents one of the more demanding conditions for cycle-based analysis.
Short-Term Buy Signals Across Major Gold Instruments
A Broad-Based Technical Alignment
The May 16, 2026 analysis documented short-term buy signals across four major gold investment vehicles simultaneously — a degree of technical alignment that amplifies the signal's significance whilst also raising the analytical stakes if the signals fail to resolve bullishly.
The four instruments carrying active buy signals are:
- GLD (SPDR Gold Shares ETF) — the world's largest physically-backed gold ETF, providing direct price exposure without counterparty risk from derivative structures
- GDX (VanEck Gold Miners ETF) — capturing senior gold producer equities, which amplify gold price movements through operational leverage tied to fixed production costs against variable gold revenues
- XGD.TO (iShares S&P/TSX Global Gold Index ETF) — providing exposure to Canadian-listed and globally diversified gold mining companies, with particular weighting toward large-cap North American producers
- GDXJ (VanEck Junior Gold Miners ETF) — the highest-beta vehicle in the group, tracking smaller exploration and development-stage companies whose valuations respond most dramatically to gold price movements
Why Junior Miners Carry a Fundamentally Different Risk Profile
The presence of a buy signal in GDXJ warrants specific attention because junior miners do not simply amplify gold price movements; they represent a structurally different investment category with unique drivers and risks. Understanding gold miners leverage is therefore essential before committing capital to this segment of the market.
Junior miners typically operate without significant production revenue, meaning their valuations derive almost entirely from the perceived value of their resource base and the probability of project advancement. During gold bull markets, this creates explosive upside as exploration success and resource upgrades generate disproportionate value increases. During corrections, however, the same dynamics produce amplified drawdowns as liquidity evaporates and project financing becomes constrained.
A short-term buy signal in GDXJ during an UP cycle phase historically corresponds to some of the highest short-term return potential across all gold investment vehicles, but it also carries the greatest risk of capital impairment if the broader gold price trend fails to confirm the signal.
Gold mining equities broadly tend to lead gold prices at cycle turning points because institutional portfolio managers begin repositioning mining stocks before physical gold demand data confirms the shift. This makes buy signals in GDX and GDXJ potentially valuable early indicators of broader market recovery, though this characteristic equally means false signals in equities are more common than in the physical metal itself.
The Critical Divergence: When Cycle and Trend Tell Different Stories
Understanding the Three-Way Market Conflict
The most analytically significant feature of gold's current market structure is a simultaneous condition that experienced technicians treat with particular care:
- An upward cycle indicator suggesting accumulation conditions
- A downward price trend in both gold and gold equities
- An upward trend in the US Dollar Index (DXY)
This configuration typically characterises a counter-trend rally scenario: a short-term upward movement occurring within a broader corrective phase. It does not automatically signal that a new long-term bull leg has commenced; rather, it suggests tactical trading opportunities exist within a corrective structure that may have further to run. Consequently, understanding gold-stock cycles becomes particularly valuable when navigating these periods of conflicting signals.
The USD-Gold Inverse Relationship and Why Dollar Strength Is the Primary Headwind
Gold's pricing in US dollars creates a structural sensitivity to currency movements that operates independently of supply and demand fundamentals. When the dollar strengthens, gold becomes relatively more expensive for international buyers priced in other currencies, suppressing global demand and creating price resistance regardless of underlying market conditions.
| USD Condition | Typical Gold Market Impact |
|---|---|
| Rising USD trend | Headwind for gold; international demand compressed |
| Falling USD trend | Powerful tailwind; purchasing power expands globally |
| USD at technical resistance | Potential inflection point; watch for reversal signals |
| USD breakout to new highs | Sustained pressure on gold prices likely |
The current upward USD trend therefore represents the primary macro headwind limiting gold's ability to sustain rallies even when cycle indicators are positive. In addition, gold and real rates interact directly with dollar movements, meaning historical pattern analysis consistently shows that gold's most powerful and durable bull runs occur when the cycle is up and the USD trend is declining simultaneously — a dual confirmation that has not yet materialised in the current setup.
Support Levels as the Binary Validation Test
With the cycle UP but the trend DOWN, the integrity of key support levels becomes the critical test that determines whether the short-term buy signals lead to meaningful gains or prove premature. According to the May 16, 2026 analysis, support must hold to validate any emerging breakout thesis.
This creates a straightforward binary framework for assessment:
- Support holds and price action confirms above key levels: buy signals validated, breakout thesis intact
- Support breaches and price action deteriorates further: signals invalidated, corrective phase likely has further to run
Traders should treat these support levels as active monitoring points rather than passive observations, adjusting positioning promptly if price behaviour contradicts the cycle signal.
The Long-Term Investment Case: Why Structural Demand Remains Intact
Four Pillars Supporting Gold's Multi-Year Bull Market
Short-term technical caution does not diminish the long-term structural demand drivers that have carried gold to its current elevated price territory. Four interconnected forces continue to underpin the multi-year investment thesis:
1. Central Bank Reserve Diversification
Central banks globally have systematically increased gold allocations as a direct hedge against what policy analysts describe as the weaponisation of the US financial system. Nations that observed Russia's foreign exchange reserves being frozen following the 2022 Ukraine invasion drew important conclusions about the systemic risks of holding reserves primarily in USD-denominated instruments. Gold's absence from any national payment system makes it uniquely resistant to sanctions-based asset freezes, a characteristic that has elevated it from reserve management afterthought to strategic priority.
2. Geopolitical Risk Premium
Unlike previous gold bull markets where geopolitical spikes were episodic and mean-reverting, the current global environment features structural fragmentation across trade relationships, military alliances, and monetary systems. This persistent rather than episodic character of geopolitical risk creates a more durable embedded premium in gold's price floor.
3. Monetary Policy Uncertainty
The Federal Reserve's rate trajectory remains one of the most consequential variables for gold's medium-term direction. Real interest rates, calculated as nominal rates minus inflation expectations, remain the most historically reliable macro predictor of gold's direction. Any pivot toward easing would remove a significant headwind that has periodically capped gold's rally potential throughout 2025–2026.
4. Currency Debasement Concerns
Expanding sovereign debt loads across G7 nations, with debt-to-GDP ratios at historically elevated levels, fuel structural concerns about the long-term purchasing power of major fiat currencies. Gold's fixed total supply, with global mine production adding only approximately 1.5–2% annually to above-ground stocks, makes it structurally attractive as a monetary hedge in an environment of accelerating currency issuance.
Navigating Mixed Signals: A Framework for Different Investor Profiles
Matching Strategy to Time Horizon
The coexistence of an UP cycle signal, short-term buy signals across major instruments, and downward price trends demands that investors define their time horizon clearly before interpreting any single technical update as actionable guidance. The same market conditions produce entirely different strategic implications depending on whether an investor operates across days, months, or years. For current pricing context, resources such as live gold price data can help investors stay informed as conditions evolve.
For Long-Term Investors:
- Recognise that short-term trend weakness does not negate the structural bull case built on central bank demand, geopolitical risk premiums, and currency debasement concerns
- Use UP cycle phases as accumulation windows, treating price dips as relatively better entry conditions rather than exit signals
- Avoid over-leveraging during trend-cycle divergence periods, as the absence of confirmed breakout setups increases the probability of drawdowns before eventual recovery
- Maintain diversified exposure across physical gold, broad ETFs such as GLD, and senior producer ETFs such as GDX to balance stability and leverage
For Active Traders:
- The simultaneous buy signals across GLD, GDX, XGD.TO, and GDXJ provide tactical entry conditions with defined risk parameters
- Position sizing should reflect the uncertainty created by the downward price trend working against the cycle signal
- Support levels must be monitored as active trip wires; a breach invalidates the short-term bullish thesis and requires immediate reassessment
- No confirmed breakout setups are currently present, making patience a legitimate and disciplined tactical posture
For Risk-Averse Allocators:
- The absence of breakout confirmation suggests incremental position building is more appropriate than full capital deployment
- The USD trend serves as a useful leading indicator; a reversal in dollar strength would materially improve the gold outlook and provide additional confirmation before increasing exposure
- Consider the gold-to-gold-stocks ratio as an additional filter, as buy signals in this ratio can indicate when mining equities are positioned to outperform the physical metal
The next major ASX story will hit our subscribers first
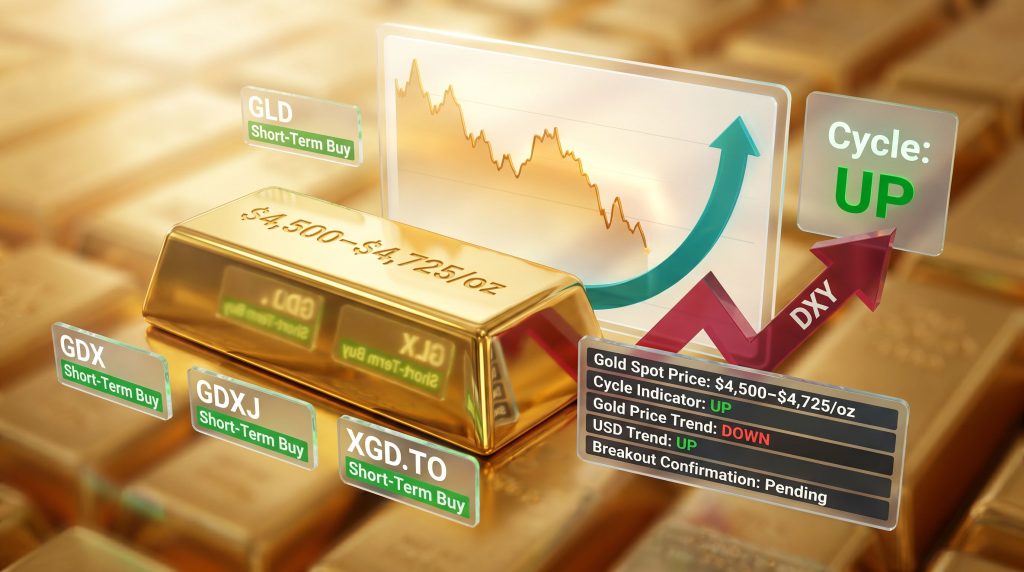
Gold Market Snapshot: Key Metrics at a Glance (Mid-May 2026)
| Indicator | Current Reading | Investment Implication |
|---|---|---|
| Gold Spot Price | $4,500–$4,725/oz | Historically elevated; near nominal record highs |
| Proprietary Cycle Indicator | UP | Favours accumulation and long positioning |
| Gold Price Trend | DOWN | Short-term corrective pressure persists |
| Gold Stocks Trend | DOWN | Miners underperforming relative to gold price |
| USD Trend | UP | Structural headwind limiting rally potential |
| GLD Signal | Short-Term Buy | Tactical entry opportunity confirmed |
| GDX Signal | Short-Term Buy | Senior miners showing relative buy conditions |
| GDXJ Signal | Short-Term Buy | High-beta opportunity with amplified risk |
| XGD.TO Signal | Short-Term Buy | Canadian and global miner exposure confirmed |
| Breakout Confirmation | Pending | Support must hold to validate bullish thesis |
| Confirmed Buy Setups | None | Disciplined patience warranted before entering |
Frequently Asked Questions: Gold Price Technical Analysis
What does it mean when gold's cycle is up but the price trend is down?
This divergence typically characterises a counter-trend rally phase, where a short-term upward movement is occurring within a broader corrective structure. It creates tactical trading opportunities for disciplined participants but does not confirm that a new long-term bull leg has begun. Validation requires the price trend to reverse and key support levels to hold against selling pressure.
Why are gold stocks on buy signals when gold itself is in a downtrend?
Mining equities often lead gold prices at cycle turning points because of their leveraged sensitivity to gold price expectations rather than current spot prices alone. Buy signals in GDX and GDXJ preceding a gold price trend reversal can function as early indicators of broader market recovery, though they carry elevated risk if the underlying gold price trend fails to improve within a reasonable timeframe.
How does a rising US Dollar directly affect gold prices?
Since gold is globally priced in US dollars, currency strength creates a mechanical headwind by making gold more expensive for buyers using other currencies, which suppresses international demand. Conversely, a weakening dollar expands the effective purchasing power of international buyers, creating one of the most powerful and historically reliable tailwinds for gold price appreciation.
What is the most important technical level to watch right now?
The current analytical focus centres on support level integrity. The May 16, 2026 analysis specifically identified that support must hold to validate any emerging breakout. If current support zones absorb selling pressure and hold, the short-term buy signals gain credibility. A definitive breach of support would suggest the corrective phase has further to run and would likely invalidate the current cycle-based bullish readings.
Is the long-term case for gold still intact despite short-term technical weakness?
Based on structural fundamentals — including persistent central bank accumulation, structurally embedded geopolitical risk premiums, monetary policy uncertainty, and sovereign debt-driven currency debasement concerns — the long-term investment case for gold remains firmly intact. Short-term technical caution reflects near-term mechanics, not a dismantling of the multi-year demand architecture that has driven gold to record nominal prices. Investors with clearly defined long time horizons can treat technical weakness as a feature rather than a warning. For broader market perspectives, gold price news from specialist sources can supplement technical analysis with fundamental commentary.
Key Takeaways: What This Gold Price Exclusive Update Tells Us
- Gold is trading within the $4,500–$4,725/oz range as of mid-May 2026, reflecting record nominal valuations driven by deep structural demand forces
- The proprietary cycle indicator is UP, supporting an accumulation bias for long-term investors and identifying tactical entry conditions for active traders
- Short-term buy signals are confirmed across GLD, GDX, GDXJ, and XGD.TO, though no confirmed breakout setups are currently present
- A meaningful divergence exists between the upward cycle signal and the downward price trends in both gold and gold equities
- The rising USD trend remains the single most important macro headwind, with gold's most powerful rallies historically requiring a concurrent decline in dollar strength
- Support level confirmation represents the binary near-term test for the bullish thesis
- The structural demand pillars — comprising central bank buying, geopolitical risk premiums, monetary policy uncertainty, and currency debasement concerns — remain firmly intact regardless of short-term technical complexity
Disclaimer: This article is intended for informational and educational purposes only and does not constitute financial advice, investment recommendations, or a solicitation to buy or sell any securities or financial instruments. Gold markets involve significant risk, and past technical signal performance does not guarantee future results. Cycle indicators and technical buy signals are probabilistic tools, not deterministic forecasts. Investors should conduct independent research and consult a qualified financial adviser before making any investment decisions. All price figures and market data referenced reflect conditions as of mid-May 2026 and are subject to change.
Readers seeking additional technical perspectives on gold market analysis and price forecasting can explore independent commentary available at Gold-Eagle.com, which publishes regular analysis from multiple independent market technicians and precious metals specialists.
Want to Capitalise on the Next Major ASX Gold Discovery?
While structural forces continue driving gold toward record territory, Discovery Alert's proprietary Discovery IQ model delivers real-time alerts on significant ASX mineral discoveries — instantly translating complex data into actionable opportunities for both short-term traders and long-term investors. Explore historic discovery returns on Discovery Alert's dedicated discoveries page and begin your 14-day free trial today to position yourself ahead of the broader market.