June 21, 2026
The current geopolitical landscape presents a fascinating paradox for precious metals investors, as the US-Iran conflict impact on gold prices defies conventional market wisdom. Despite escalating tensions in the Middle East, gold has experienced unexpected weakness, challenging decades of established safe-haven investment theory. This anomaly forces a fundamental reassessment of how modern markets respond to international crises.
What Drives Gold's Contradictory Behavior During Geopolitical Crises?
The Traditional Safe-Haven Paradigm vs. Modern Market Realities
Historical precedent established gold's reputation as the ultimate crisis hedge following the collapse of the Bretton Woods system in 1971. For decades, investors could rely on precious metals to provide portfolio protection during periods of international tension, monetary instability, and economic uncertainty. This relationship became so ingrained in market psychology that entire investment strategies were built around gold's defensive characteristics.
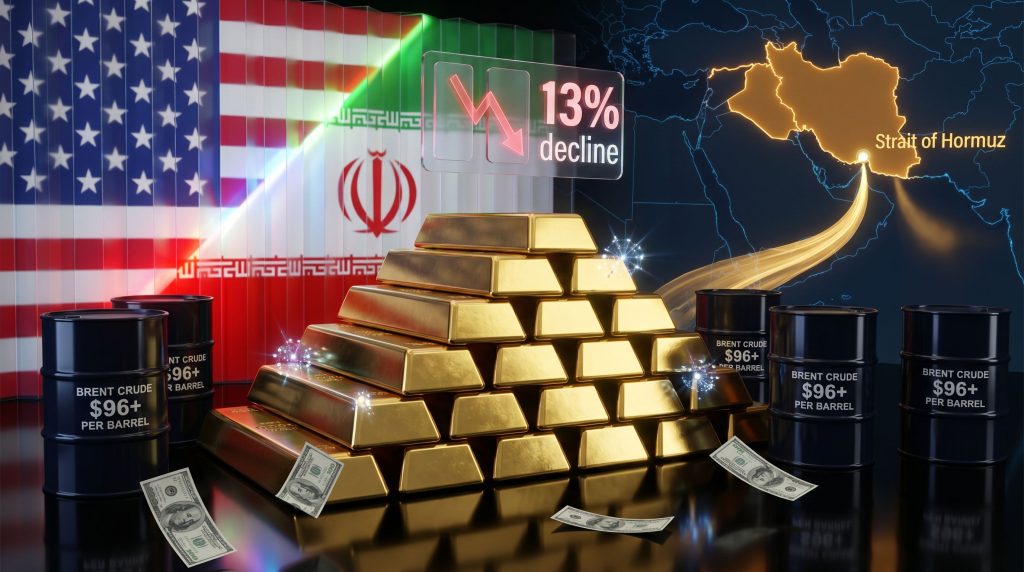
Recent market behavior challenges these assumptions fundamentally. Despite escalating tensions between the United States and Iran, gold experienced a 13% decline from its recent peaks, contradicting every traditional model of safe-haven asset behavior. This anomaly forces investors to reconsider whether historical correlations remain relevant in today's interconnected, digitally-driven markets.
| Conflict Period | Gold Performance | Duration | Market Context |
|---|---|---|---|
| 1973 Oil Crisis | +67% | 12 months | Bretton Woods collapse aftermath |
| 1979 Iranian Revolution | +126% | 18 months | High inflation environment |
| 1990 Gulf War | +8% | 6 months | Recession concerns dominant |
| 2003 Iraq Invasion | -5% | 3 months | Dollar strength prevailed |
| 2020 Iran Tensions | +4% | 2 months | COVID uncertainty masked effect |
| 2026 US-Iran Conflict | -13% | Ongoing | Rate hike expectations dominate |
The digital trading era fundamentally alters market dynamics through several mechanisms. Algorithmic execution prioritises momentum and technical signals over fundamental analysis. High-frequency trading amplifies short-term volatility while dampening sustained directional moves. ETF structures create artificial demand patterns divorced from physical metal markets. Social media sentiment drives rapid consensus shifts among retail investors.
Competing Safe-Haven Assets in 2025
The US dollar's enhanced reserve currency status represents perhaps the most significant challenge to gold's traditional role. Following the monetary policy responses to global crises since 2020, dollar demand from international institutions has strengthened considerably. Central banks worldwide maintain larger USD reserves than historically typical, creating structural bid support during uncertainty periods.
Treasury yields offering attractive real returns provide a compelling alternative to non-yielding gold positions. With 10-year yields trading above inflation expectations, opportunity costs for holding precious metals reach levels not seen since the early 2000s. Professional portfolio managers face increasing pressure to justify gold allocations when risk-free government bonds deliver positive real returns.
"Modern portfolio theory assumes stable correlation matrices, but the introduction of cryptocurrency as a legitimate asset class, combined with central bank digital currencies and algorithmic trading strategies, creates new market dynamics that historical models cannot capture. The result is correlation breakdown precisely when investors need stability most."
Cryptocurrency adoption among institutional investors represents a generational shift in store-of-value preferences. Digital assets, while volatile, offer portfolio diversification benefits that appeal to younger investment professionals. Bitcoin's correlation with gold during stress periods has varied dramatically, sometimes providing complementary exposure and other times moving in direct opposition.
When big ASX news breaks, our subscribers know first
How Do Rising Interest Rates Override Geopolitical Premiums?
Federal Reserve Policy Transmission Mechanisms
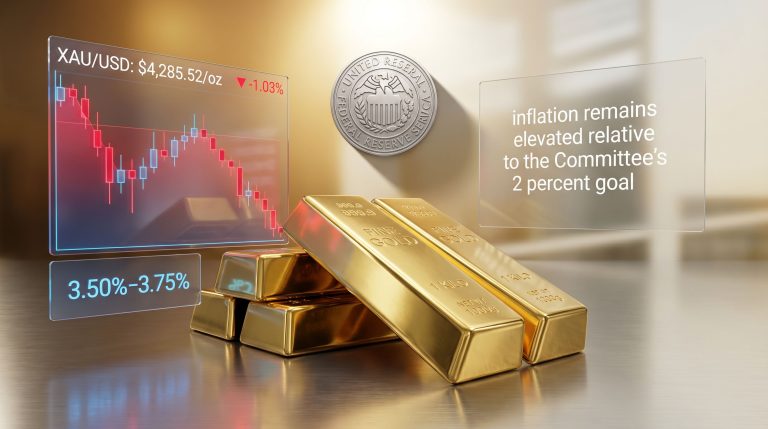
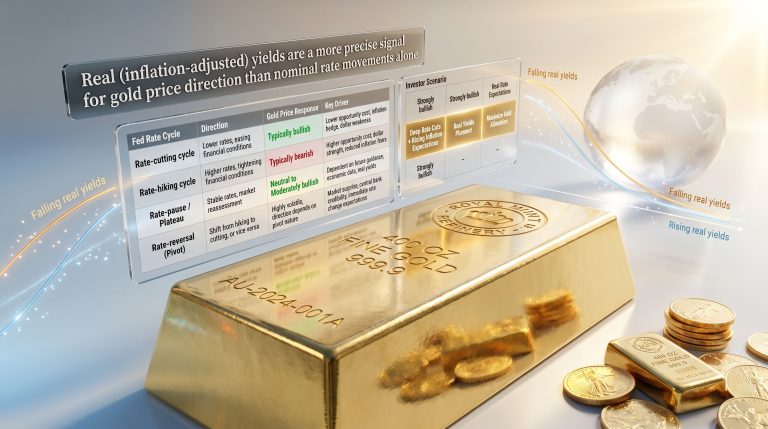
Real interest rate calculations reveal the mathematical disadvantage facing gold investors in the current environment. With nominal rates elevated and inflation expectations moderating, opportunity costs for holding non-yielding assets reach multi-decade highs. The formula for gold's attractiveness inverts when real rates exceed 2%, creating systematic selling pressure regardless of geopolitical developments.
Inflation expectations versus monetary tightening cycles create competing forces that professional traders must navigate carefully. While energy price spikes typically drive inflation concerns higher, the Federal Reserve's commitment to restrictive policy acts as a countervailing force. Furthermore, the gold prices record highs of previous periods occurred in very different rate environments than today's conditions.
"When real 10-year Treasury yields exceed 2.5%, gold faces structural headwinds regardless of geopolitical tensions. The current environment, with real yields approaching 3%, creates the strongest mathematical case against precious metals ownership in over two decades."
Central Bank Gold Demand vs. Private Investment Flows
Official sector purchases continue providing price floor support despite private investor scepticism. Central banks added approximately 1,037 tonnes of gold to reserves in 2025, maintaining demand patterns established over the previous decade. This institutional buying creates technical support levels that prevent complete collapse during private investor liquidation phases.
ETF outflows during crisis periods highlight the disconnect between professional money management and retail precious metals enthusiasm. Large institutional investors treat gold ETFs as tactical positions rather than strategic allocations, creating volatile flows that can overwhelm physical market dynamics during stress periods. This contrasts with the gold market trends that suggest sustained institutional demand.
Key central bank gold policies shaping 2024-2025 markets include:
- People's Bank of China: Continued strategic accumulation targeting 4% of total reserves
- Bank of Russia: Maintaining gold purchases despite sanctions limitations
- European Central Bank: Stable holdings with no active buying or selling programs
- Federal Reserve: No change to gold certificate arrangements with Treasury
- Emerging Market Central Banks: Collective net buying averaging 50 tonnes quarterly
What Role Does Oil Price Volatility Play in Gold Market Dynamics?
Energy-Inflation-Monetary Policy Nexus
Brent crude's surge to $96+ per barrel creates inflationary pressures that historically would benefit precious metals, yet the transmission mechanism operates differently in today's economy. Energy represents a smaller percentage of total consumer spending compared to previous decades, while monetary policy makers demonstrate greater willingness to tolerate temporary price spikes without abandoning restrictive stances.
Stagflation scenarios require careful analysis of both inflationary pressures and economic growth trajectories. Current oil price increases stem from geopolitical supply concerns rather than demand-driven growth, creating different implications for precious metals positioning. Gold technical analysis reveals that supply-driven inflation episodes typically resolve more quickly than demand-driven cycles, limiting sustained gold rally potential.
How Oil Shocks Transmit to Gold Markets:
- Initial Price Impact: Crude oil supply disruption drives immediate price increases
- Inflation Expectation Adjustment: Market participants revise upward inflation forecasts
- Central Bank Response Assessment: Investors evaluate likelihood of policy accommodation
- Real Rate Recalculation: Changes in inflation expectations alter opportunity cost calculations
- Portfolio Rebalancing: Investment flows adjust based on revised risk-return profiles
- Gold Price Discovery: Precious metals markets incorporate net effect of all factors
Supply Chain Disruption Risk Assessment
Strait of Hormuz chokepoint analysis reveals vulnerability in global energy transportation networks that could dramatically alter precious metals dynamics. Approximately 21% of global liquefied natural gas and 20% of total petroleum liquids transit this waterway, making it perhaps the world's most critical energy chokepoint. Military conflict in this region creates tail risks that traditional market models struggle to quantify.
Alternative energy transition impact on commodity correlations introduces new variables into precious metals analysis. As renewable energy infrastructure reduces petroleum dependence, the traditional oil-gold correlation may weaken further. Solar panel and wind turbine manufacturing requires significant silver inputs, potentially creating new fundamental drivers for precious metals that operate independently of energy price shocks.
Hypothetical Extended Middle East Conflict Outcomes:
- Best Case Scenario: Limited engagement, oil prices retreat to $85-90 range, gold finds support at $4,500
- Base Case Scenario: Intermittent conflict, sustained $90-100 oil, gold consolidates $4,600-4,900 range
- Stress Case Scenario: Strait closure, oil spikes above $120, gold rallies to $5,500+ on supply shock
- Worst Case Scenario: Regional war expansion, prolonged supply disruption, precious metals enter new bull market phase
Why Are Traditional Gold-Dollar Correlations Failing?
Currency Market Structural Changes
The dollar's enhanced reserve currency status post-2020 represents a fundamental shift in international monetary architecture. Global central banks hold higher USD reserve ratios than historical averages, creating structural demand that operates independently of traditional safe-haven flows. This institutional foundation provides dollar strength that can override typical crisis-driven depreciation patterns.
Emerging market currency volatility drives additional USD demand through multiple channels. Corporate debt servicing requirements, trade settlement needs, and capital flight dynamics all contribute to sustained dollar strength that competes directly with gold's safe-haven appeal. The gold price forecast 2025 must account for these structural currency market changes.
| Time Period | Gold-Dollar Correlation | Volatility Environment | Dominant Factor |
|---|---|---|---|
| 1980-2000 | -0.65 | Moderate | Interest rate cycles |
| 2001-2008 | -0.72 | Low to High | Housing bubble/crisis |
| 2009-2015 | -0.58 | Declining | QE policies |
| 2016-2020 | -0.43 | Moderate | Trade war uncertainty |
| 2021-2025 | -0.28 | High | Multiple competing factors |
| 2026 YTD | +0.15 | Very High | Correlation breakdown |
Liquidity Preference Shifts
Institutional cash hoarding strategies reflect fundamental changes in risk management practices across the investment management industry. Following multiple crisis periods since 2008, professional investors maintain higher cash allocations and demonstrate greater willingness to hold dollars during uncertainty rather than alternative stores of value. This behavioural shift reduces automatic gold demand during stress periods.
Margin call dynamics in leveraged markets create forced selling pressure that can overwhelm fundamental demand. When portfolio volatility increases, institutional investors face margin requirements that necessitate position liquidation regardless of underlying asset attractiveness. Gold ETFs often represent easily liquidated holdings that get sold to meet margin calls, creating downward pressure during periods when fundamental analysis would suggest buying opportunities.
"Traditional portfolio optimisation models assume stable return distributions and correlation structures. In reality, these relationships shift dramatically during crisis periods, often when portfolio protection is most needed. Sophisticated institutional investors increasingly use dynamic hedging strategies rather than static precious metals allocations to manage portfolio risk."
How Do Technical Trading Patterns Influence Crisis Response?
Algorithmic Trading Impact on Precious Metals
High-frequency trading volume analysis reveals the extent to which computer-driven strategies dominate precious metals price discovery. Approximately 75% of daily gold futures volume stems from algorithmic sources, creating market dynamics that prioritise technical signals over fundamental developments. These systems respond to momentum indicators, moving averages, and volatility measures rather than geopolitical news flow.
Moving average resistance levels in the $4,670-$4,880 range create technical barriers that algorithmic systems reinforce through systematic selling. When prices approach these levels, automated trading programs execute predetermined strategies that can generate substantial selling pressure independent of fundamental considerations. The result is technical resistance that becomes self-fulfilling through computerised execution.
50-Day vs. 200-Day Moving Average Signals:
The 50-day moving average currently sits at $4,720, while the 200-day moving average rests at $4,580. This configuration creates a bearish technical setup that algorithmic trading systems interpret as sell signals. When both moving averages trend downward and price action remains below the shorter-term average, momentum-based strategies generate systematic selling pressure that can override fundamental buying interest. External analysis from Reuters confirms these technical patterns contributing to gold's weakness during the conflict.
Market Microstructure During Volatility Spikes
Bid-ask spread widening patterns during volatile periods reveal liquidity challenges that affect gold's crisis performance. When geopolitical tensions increase, market makers reduce position sizes and widen spreads to manage inventory risk. This liquidity reduction can create price gaps and execution challenges that discourage institutional participation precisely when historical models suggest increased demand.
Futures market backwardation and contango signals provide insights into forward-looking supply and demand dynamics. Current gold futures curves display mild contango, suggesting that forward markets price in adequate supply availability despite geopolitical tensions. This contrasts with historical patterns where crisis periods typically drove curves into backwardation as investors competed for immediate physical delivery.
"Key technical reversal signals include sustained trading above the 50-day moving average ($4,720), volume expansion on upward moves, and futures curve shifts toward backwardation. Additionally, the gold-silver ratio breaking below 65:1 historically indicates precious metals sector strength, though this relationship has also become less reliable in recent years."
What Investment Strategies Work During Geopolitical Uncertainty?
Portfolio Diversification in Crisis Periods
Risk-parity allocation models require substantial recalibration given the breakdown of traditional correlation assumptions. Portfolio managers using these strategies face challenges as asset classes that historically provided diversification benefits now move in similar directions during stress periods. Therefore, gold investment strategies must evolve to address changing market dynamics.
Precious metals versus real assets comparison reveals relative attractiveness across different inflation scenarios. Real estate investment trusts (REITs), infrastructure investments, and commodity-producing equities offer inflation protection with income generation capabilities that gold cannot match. However, these alternatives carry different liquidity profiles and correlation risks that must be carefully evaluated.
Five Gold Investment Vehicles Ranked by Volatility:
- Gold Mining Equities: Highest volatility, leverage to underlying metal prices
- Gold Futures Contracts: High volatility, maximum liquidity and leverage options
- Gold ETFs: Moderate volatility, easy access with minimal tracking error
- Physical Gold Coins: Lower volatility, storage and insurance considerations required
- Gold Certificates/Allocated Accounts: Lowest volatility, institutional custody solutions
Timing Considerations for Physical vs. Paper Gold
Storage costs and insurance implications significantly impact total return calculations for physical precious metals ownership. Annual storage fees ranging from 0.5% to 1.5% of holdings value, combined with insurance premiums, create ongoing expense burdens that paper alternatives avoid. These costs become particularly relevant during extended periods of sideways price action.
ETF tracking efficiency during market stress periods varies considerably across different fund structures. Physically-backed ETFs typically maintain tighter tracking during volatile periods compared to synthetic or futures-based alternatives. However, all paper gold investments carry counterparty risks that physical ownership eliminates entirely. Investing.com reports highlight these tracking differences during the current conflict period.
Building Crisis-Resistant Precious Metals Position:
- Assess Total Portfolio Risk: Determine appropriate precious metals allocation (typically 5-15%)
- Choose Investment Vehicles: Balance liquidity needs against storage costs and counterparty risks
- Implement Gradually: Use dollar-cost averaging to reduce timing risk during volatile periods
- Monitor Correlations: Track relationship changes between precious metals and other holdings
- Rebalance Systematically: Maintain target allocations through disciplined rebalancing
- Plan Exit Strategies: Establish clear criteria for reducing or eliminating positions
The next major ASX story will hit our subscribers first
How Might Silver's Volatility Patterns Inform Gold Outlook?
Gold-Silver Ratio Analysis
The historical 70:1 gold-silver ratio versus current levels provides insight into relative value between the precious metals. Recent trading has seen this ratio fluctuate between 60:1 and 75:1, suggesting neither metal demonstrates clear relative strength. When the ratio approaches extreme levels (below 50:1 or above 80:1), it often signals sentiment extremes that precede reversals in precious metals sector direction.
Industrial demand factors affecting silver premiums create fundamental differences between the two metals that investors must consider. Silver's significant industrial applications, particularly in solar panel manufacturing and electronics production, provide demand support that operates independently of investment flows. This industrial component can create price floors during financial market liquidation phases.
| Precious Metal | 6-Month Price Target | Volatility Expectation | Key Risk Factors |
|---|---|---|---|
| Gold | $4,400-5,200 | Moderate (15-20%) | Interest rate policy, dollar strength |
| Silver | $65-95 | High (25-35%) | Industrial demand, mining supply |
| Platinum | $950-1,150 | Moderate (20-25%) | Auto sector demand, supply constraints |
| Palladium | $800-1,200 | Very High (30-40%) | Russian supply, EV transition |
Correlation Breakdown During Market Stress
Independent price discovery mechanisms between gold and silver create opportunities for relative value trades during volatile periods. When correlations break down, sophisticated investors can potentially benefit from mean reversion strategies that capitalise on temporary pricing inefficiencies between the metals. However, these strategies require careful risk management given the potential for extended correlation breakdowns.
Mining supply constraints impact both metals but through different mechanisms. Gold mining faces geological limitations and increasingly challenging extraction environments, while silver production often depends on base metal mining operations where silver represents a byproduct. These different supply dynamics can create divergent price pressures during various economic scenarios.
Silver as Gold Market Leading Indicator Case Study:
Historical analysis suggests silver often leads gold at major turning points due to its higher volatility and retail investor participation. During the March 2026 precious metals correction, silver declined first and more severely, reaching its low point approximately one week before gold found its bottom. This pattern, while not infallible, provides early warning signals for precious metals investors who monitor both markets carefully.
What Are the Long-Term Implications for Gold's Safe-Haven Status?
Structural Market Evolution Factors
Cryptocurrency adoption among institutional investors represents a generational shift that challenges gold's monopoly on alternative store-of-value status. Digital assets offer portability, divisibility, and transaction capabilities that physical precious metals cannot match. While regulatory uncertainty and volatility limit widespread adoption, the trajectory toward digital value storage appears irreversible over longer time horizons.
Climate transition impact on mining operations creates both challenges and opportunities for precious metals markets. Environmental regulations increase extraction costs and limit new mine development, potentially constraining future supply. Simultaneously, renewable energy infrastructure requires significant silver inputs, creating new fundamental demand drivers that could reshape precious metals markets over the coming decade.
"Baby boomer generation accumulated substantial precious metals holdings based on historical precedent and personal experience with monetary instability. As wealth transfers to younger generations with different risk preferences and technological comfort levels, demand patterns for traditional safe-haven assets may shift dramatically. Younger investors often prefer liquid, technology-enabled investment solutions over physical asset ownership."
Geopolitical Realignment Effects
BRICS currency initiatives and gold backing proposals represent attempts to challenge dollar hegemony in international trade settlement. While these efforts face significant technical and political obstacles, successful implementation could create new fundamental demand for precious metals as central banks prepare for alternative monetary systems. The timeline for such changes extends across decades rather than years.
Western sanctions driving alternative reserve assets create incentives for non-aligned nations to diversify away from traditional dollar-denominated holdings. Gold offers politically neutral value storage that cannot be frozen or confiscated through financial system controls. This dynamic provides structural support for official sector demand regardless of private investor sentiment.
"Long-term projections suggest gold will retain safe-haven characteristics but potentially at reduced premiums compared to historical levels. Competition from digital assets, changing demographics, and evolving monetary systems will likely compress the crisis premium while maintaining baseline demand from central banks and conservative investors seeking portfolio diversification."
US-Iran Conflict and Gold Price Dynamics: Frequently Asked Questions
Why didn't gold prices surge when the US-Iran conflict escalated?
Multiple competing factors including dollar strength and interest rate expectations overwhelmed traditional safe-haven demand. Modern financial markets feature algorithmic trading systems that prioritise technical momentum over fundamental geopolitical analysis, creating price action that contradicts historical precedent. Additionally, investor expectations that the conflict would remain limited in scope and duration reduced demand for crisis hedging positions.
How long do geopolitical premiums typically last in gold markets?
Historical analysis shows geopolitical premiums in gold markets typically persist for 3-6 months following initial crisis events, with premium magnitude depending on conflict duration and economic impact. Current Middle East tensions show different characteristics, with markets pricing in limited escalation probability despite ongoing military activities. If conflict expands beyond current parameters, premium duration could extend significantly.
Should investors buy gold during Middle East tensions?
Risk-adjusted return considerations favour a nuanced approach rather than automatic precious metals accumulation during geopolitical crises. Current interest rate environments create mathematical headwinds for non-yielding assets, while alternative hedging strategies may provide superior risk management characteristics. The US-Iran conflict impact on gold prices demonstrates that traditional correlations may no longer provide reliable guidance for investment decisions.
Investment Outlook: Navigating Precious Metals in Uncertain Times
Short-Term Price Projections (3-6 months)
Technical resistance and support level analysis suggests gold will likely remain range-bound between $4,500-5,000 absent major fundamental catalyst changes. Key resistance levels at $4,880 and $5,200 require significant volume expansion to overcome, while support exists at $4,400 and $4,100 based on previous consolidation patterns.
Event-driven catalyst calendar for the remainder of 2026 includes Federal Reserve policy meetings, Middle East diplomatic developments, and Chinese economic data releases that could shift precious metals sentiment. The most significant potential catalyst remains escalation or resolution of US-Iran tensions, which could break current trading ranges decisively in either direction.
| Scenario | Probability | Gold Price Target | Timeline | Key Assumptions |
|---|---|---|---|---|
| Base Case | 45% | $4,600-4,900 | 6 months | Limited conflict escalation, steady rates |
| Bull Case | 25% | $5,200-5,800 | 3-4 months | Major supply disruption or Fed pivot |
| Bear Case | 20% | $4,000-4,400 | 6-9 months | Conflict resolution, continued rate hikes |
| Tail Risk | 10% | $3,500 or $6,500+ | Variable | Extreme scenarios either direction |
Long-Term Strategic Considerations (1-3 years)
Monetary policy normalisation timeline remains the dominant factor shaping precious metals outlook over intermediate time horizons. Federal Reserve commitment to maintaining restrictive policy until inflation reaches target levels creates structural headwinds for gold regardless of geopolitical developments. Policy pivot timing depends on economic data evolution rather than crisis events.
Structural inflation factors beyond energy include housing costs, service sector wage pressures, and demographic trends that could support precious metals over longer periods. These fundamental forces operate independently of cyclical monetary policy and may provide underlying demand support even during periods of higher interest rates.
"Conservative investors should limit precious metals exposure to 5-10% of total portfolios, focusing on physically-backed ETFs for liquidity. Moderate risk investors can increase allocations to 10-15% while incorporating mining equities for additional upside potential. Aggressive investors might consider 15-20% allocations with greater emphasis on silver and smaller precious metals for enhanced volatility and return potential."
Investment Disclaimer: This analysis contains forward-looking statements and speculative projections based on current market conditions and historical precedent. Precious metals investments carry significant risks including price volatility, storage costs, and correlation breakdown during stress periods. Past performance does not guarantee future results, and investors should conduct independent research and consider their individual risk tolerance before making investment decisions. Geopolitical events can create unpredictable market outcomes that may differ substantially from any projections contained herein.
Ready to Capitalise on the Next Major Mineral Discovery?
Whilst geopolitical tensions create uncertainty in traditional safe-haven assets, Australia's mineral exploration sector continues uncovering extraordinary opportunities that can deliver exceptional returns regardless of global market conditions. Discovery Alert's proprietary Discovery IQ model provides instant notifications on significant ASX mineral discoveries, transforming complex geological announcements into actionable investment insights that position subscribers ahead of broader market recognition. Begin your 14-day free trial today and explore how major mineral discoveries have historically generated substantial returns for early investors.