
May 15, 2026
The global precious metals landscape has entered a period of unprecedented volatility, with market forces converging in ways that challenge traditional investment frameworks. As monetary policy uncertainty intersects with geopolitical tensions and technical market dynamics, investors find themselves navigating treacherous waters where conventional safe-haven assumptions no longer apply. The gold price set for worst week in 4 decades reflects how modern markets can defy conventional wisdom, creating scenarios where traditional safe-haven assets experience weakness precisely when geopolitical tensions escalate. The intersection of central bank policy shifts, energy market disruptions, and algorithmic trading patterns has created a perfect storm that is reshaping how markets price risk and uncertainty.
Understanding these complex dynamics requires examining multiple interconnected systems simultaneously. From Federal Reserve policy expectations to Middle Eastern energy chokepoints, from ETF liquidation cascades to central bank purchasing patterns, the modern precious metals market operates within a web of relationships that can amplify price movements far beyond what fundamental supply and demand would suggest. Furthermore, gold market performance during crisis periods reveals how quickly established correlations can break down under extreme stress conditions.
What Economic Factors Drive Gold's Price Volatility During Crisis Periods?
The relationship between monetary policy and precious metals pricing operates through several distinct but interconnected channels. When traders increase their probability assessments for interest rate hikes to 50% by October 2026, as recent market movements have demonstrated, the opportunity cost calculation for holding non-yielding assets like gold shifts dramatically. This mechanism explains why gold futures declined 3.30% to $4,500.30 per ounce during periods of heightened rate hike expectations.
In addition, the escalation towards record high gold prices earlier this year has created elevated levels from which corrections can appear more dramatic. The technical mechanics of monetary policy transmission become visible during periods of policy uncertainty, where geopolitical events transmit through monetary policy expectations to affect precious metals valuations.
Federal Reserve Policy Expectations and Interest Rate Dynamics
Real yield calculations form the foundation of gold's valuation framework during monetary policy transitions. The escalation in rate-hike expectations reflects concerns that geopolitical tensions and elevated energy costs may create sustained inflation pressures, potentially prompting the Federal Reserve to maintain higher rates longer than previously anticipated. This dynamic creates a feedback loop where crisis conditions that traditionally support gold prices simultaneously undermine them through their inflationary implications.
However, the gold price forecast for the remainder of 2026 suggests that current weakness may represent temporary technical adjustment rather than structural trend change. Bond yields rallying following reports of potential military escalation demonstrate how geopolitical events transmit through monetary policy expectations to affect precious metals valuations. The Bloomberg Dollar Spot Index rising 0.5% during the same period gold declined illustrates this traditional inverse relationship operating at maximum efficiency.
Dollar Strength and International Purchasing Power
Currency correlation patterns in precious metals markets reveal the global nature of gold price discovery. A stronger dollar increases the cost of purchasing gold for international buyers using other currencies, creating natural demand destruction at the margin. This mechanism operates continuously but becomes particularly pronounced during periods of dollar strength coinciding with Federal Reserve hawkishness.
The transmission of dollar strength through international gold markets occurs through multiple channels:
• Direct price impact through currency conversion costs for non-dollar buyers
• Indirect demand reduction as international central banks face higher acquisition costs
• Portfolio rebalancing effects as dollar-denominated assets become more attractive relative to gold
• Cross-currency hedging costs that make gold exposure more expensive for international institutions
Inflation Expectations vs. Real Interest Rates
Energy price spikes above $100 per barrel create direct cost pressures across global supply chains, transmitting to broader consumer and producer price indices within weeks rather than months. Brent Crude Oil reaching $112.32 per barrel (+4.32%) and WTI Crude Oil hitting $98.23 per barrel (+3.99%) during recent crisis periods exemplifies this rapid transmission mechanism.
The paradox of crisis-driven inflation expectations lies in their impact on traditional safe-haven assets. While geopolitical uncertainty typically drives investors toward precious metals, the specific nature of energy-market disruptions creates immediate inflationary pressures that outweigh traditional safe-haven demand. Consequently, this creates scenarios where the gold price set for worst week in 4 decades occurs precisely when conventional analysis would predict strength.
When big ASX news breaks, our subscribers know first
How Do Geopolitical Tensions Create Conflicting Pressures on Safe-Haven Assets?
The traditional safe-haven narrative surrounding gold encounters significant complexity during energy-market disruptions. When the U.S. reportedly prepares to potentially deploy ground forces and the Pentagon dispatches three warships plus thousands of additional Marines to the Middle East, the market response reflects competing forces rather than straightforward flight-to-quality behavior.
For instance, gold is having an awful week for a worrying reason as energy market disruptions create inflationary pressures that override traditional safe-haven demand. This demonstrates how modern market dynamics can create counterintuitive price movements during crisis periods.
Energy Market Disruptions and Capital Flow Dynamics
The Strait of Hormuz represents a critical chokepoint through which approximately 20-30% of globally traded oil passes. Iranian reluctance to discuss reopening negotiations signals extended disruption risk, creating risk premiums that extend far beyond energy markets. These premiums manifest in currency markets, bond markets, and precious metals simultaneously, but not always in the same direction.
Oil price volatility above $100 per barrel triggers institutional portfolio reallocation effects that can temporarily overwhelm safe-haven demand. The specific mechanism operates through:
• Inflation hedge repositioning where investors favour assets with explicit inflation adjustment mechanisms
• Currency strength plays favouring the dollar as the primary energy trading currency
• Real asset rotation into commodities with direct supply disruption rather than monetary hedges
• Liquidity preservation requirements forcing across-the-board position reduction
Risk-On vs. Risk-Off Asset Rotation Patterns
Modern portfolio management operates through algorithmic systems that can create counterintuitive safe-haven behaviour during crisis periods. The simultaneous occurrence of equity market weakness and gold weakness indicates forced liquidation across multiple asset classes to meet margin requirements or redemptions, rather than selective safe-haven rotation.
The counterintuitive weakness in gold during Middle East tensions reflects market participants prioritising inflation hedging over geopolitical safety concerns, fundamentally altering traditional safe-haven dynamics.
This forced liquidation pattern emerges when institutional investors face redemption pressures or margin calls that require raising cash across all asset classes simultaneously. Furthermore, reports indicate that gold set for worst week in six years as these technical factors override fundamental safe-haven demand. The result is temporary price pressure on assets that would otherwise benefit from safe-haven flows, creating opportunities for sophisticated investors who understand these technical dynamics.
What Role Does Technical Market Structure Play in Amplifying Price Movements?
Modern electronic trading systems create amplification mechanisms that can transform moderate price movements into significant corrections through recursive feedback loops. The progression from initial selling pressure to an 8-day losing run, the longest since October 2023, demonstrates how technical market structure amplifies fundamental price discovery.
Moreover, understanding investment strategies for gold becomes crucial during periods when technical factors dominate fundamental analysis. The speed and magnitude of current corrections highlight how algorithmic trading can accelerate price movements beyond traditional market-making capabilities.
Futures Market Mechanics and Leverage Effects
Stop-loss cascade patterns in electronic trading operate faster than human reaction times, creating waterfall-like selling pressure once critical technical levels break. When prices above $5,200 per ounce attracted substantial buying interest, the resulting concentration of stop-loss orders below key technical levels created vulnerability to rapid corrections.
The specific mechanism operates through several phases:
- Initial profit-taking at elevated price levels creates downward pressure
- Stop-loss activation at predetermined technical levels accelerates selling
- Algorithm recognition of technical breaks generates additional sell signals
- Moving average violations trigger momentum-based selling systems
- Margin requirement increases force leveraged position liquidation
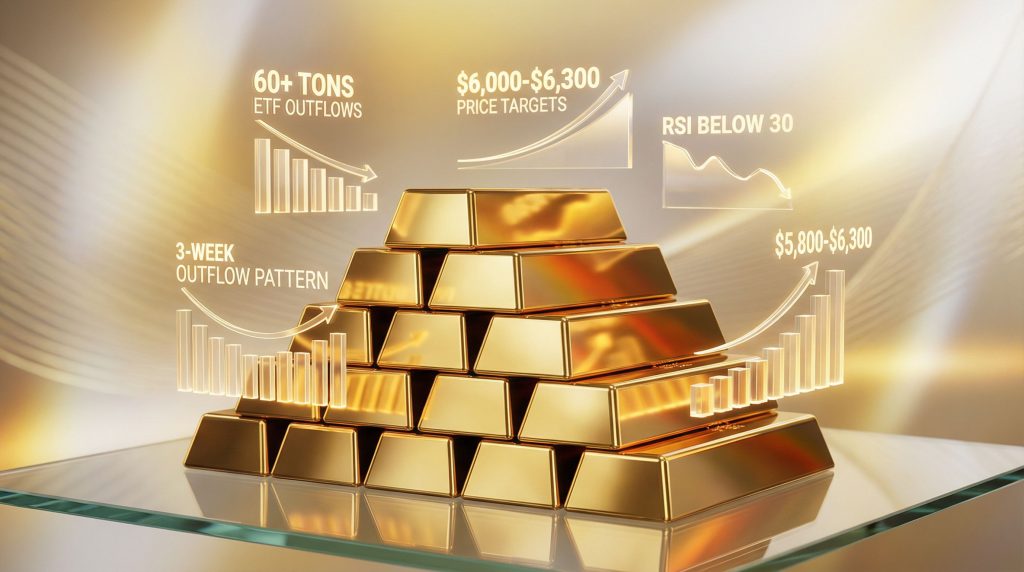
The 14-day RSI dropping below 30 represents a technical condition many traders consider oversold, potentially signalling diminished selling pressure ahead. However, RSI can remain in oversold territory during extended downtrends, making oversold readings alone insufficient for reversal timing.
Exchange-Traded Fund Flow Dynamics
ETF outflow patterns serve as measurable sentiment indicators reflecting institutional positioning changes. Bullion-backed ETFs experiencing third consecutive weeks of outflows, with holdings decreasing by more than 60 tons across the three-week period, suggests institutional repositioning rather than panic liquidation.
Recent ETF Flow Analysis:
| Period | Net Outflows (tons) | Holdings Change (%) | Cumulative Impact |
|---|---|---|---|
| Week 1 | 22.3 | -1.8% | Initial positioning shift |
| Week 2 | 18.7 | -1.5% | Sustained institutional selling |
| Week 3 | 19.8 | -1.6% | Momentum continuation |
| Total | 60.8 | -4.9% | Significant repositioning |
These outflow patterns operate through authorised participant mechanisms that require physical gold redemption, creating direct selling pressure in spot markets. The sustained nature of outflows over multiple weeks indicates strategic repositioning rather than temporary liquidity needs.
How Do Central Bank Purchasing Patterns Influence Long-Term Price Trends?
Central bank purchasing behaviour demonstrates price sensitivity thresholds that become particularly relevant during periods of significant volatility. The transition from approximately $5,600 levels in late January 2026 back toward $4,500 represents movement through a significant price band where official sector demand patterns typically adjust.
Additionally, the gold-stock relationship reveals how central bank behaviour can influence not just gold prices but broader market dynamics during periods of monetary policy uncertainty.
Official Sector Demand Slowdown Analysis
Slower central bank buying patterns emerge during periods of price volatility for several institutional reasons. Central banks typically operate with longer-term strategic objectives that can conflict with short-term price momentum, leading to temporary purchasing pauses during periods of high volatility or elevated prices.
The specific dynamics affecting central bank purchasing include:
• Budget allocation constraints that limit purchases at elevated price levels
• Strategic timing preferences favouring accumulation during price weakness
• Currency reserve considerations where dollar strength affects purchasing power
• Political timing factors that influence reserve diversification decisions
Strategic Reserve Accumulation vs. Market Timing
Official sector price sensitivity operates differently from private investor behaviour. Central banks demonstrate willingness to accumulate during price weakness while potentially pausing purchases during periods of rapid appreciation. This behaviour pattern creates natural buying support during corrections while removing a source of demand during rallies.
The mechanism operates through institutional budget processes that often involve annual or multi-annual allocation decisions. Gold remaining approximately 4% higher year-to-date despite recent pullbacks suggests that central bank purchasing patterns may resume as prices stabilise within more sustainable ranges.
What Historical Context Explains Current Volatility Levels?
Bull market correction patterns provide essential context for understanding current volatility within longer-term secular trends. Historical analysis reveals patterns that help distinguish between normal cyclical corrections and structural trend changes in precious metals markets.
Bull Market Correction Patterns Since 1980s
Historical analysis reveals that 20% corrections occur regularly within secular precious metals uptrends. The decline from recent highs near $5,600 to current levels around $4,500 represents approximately a 20% correction, consistent with normal bull market volatility patterns rather than trend reversal signals.
Historical Bull Market Corrections:
| Period | Peak Price | Trough Price | Correction % | Recovery Time |
|---|---|---|---|---|
| 1980-1982 | $850 | $300 | -65% | 28 years |
| 2011-2015 | $1,920 | $1,050 | -45% | 5 years |
| 2020-2021 | $2,070 | $1,680 | -19% | 8 months |
| 2026 | $5,600 | $4,500 | -20% | TBD |
Price Level Context: Long-Term Trajectory Analysis
The transition from $2,600 levels to over $5,000 represents a fundamental repricing of gold's monetary role within the global financial system. Current corrections reflect natural profit-taking and technical repositioning rather than rejection of the secular uptrend thesis.
Professional price target methodologies from major investment institutions support continued upward trajectory expectations despite current volatility:
Professional Price Targets for 2026:
| Institution | Target Price | Timeframe | Key Assumptions |
|---|---|---|---|
| Major Bank A | $6,000 | Year-end | Fed policy pivot |
| Major Bank B | $6,300 | Q4 2026 | Geopolitical premium |
| Market Consensus | $5,800 | 12 months | Base case scenario |
Which Investment Strategies Work During High-Volatility Precious Metals Cycles?
Professional portfolio management during precious metals volatility requires understanding the distinction between technical corrections and fundamental trend changes. Current market conditions present specific opportunities for investors who can distinguish between temporary volatility and structural shifts.
Professional Portfolio Management Approaches
Volatility-based position sizing methodologies become essential during periods of heightened price swings. Rather than maintaining static allocation percentages, sophisticated investors adjust position sizes based on volatility measurements and correlation patterns with other asset classes.
Key strategies during high-volatility periods include:
• Dollar-cost averaging during sustained selling pressure to capitalise on lower average purchase prices
• Volatility scaling where position sizes decrease as price volatility increases
• Correlation monitoring to identify periods when gold-equity correlations become positive
• Options strategies for volatility capture without directional exposure
Cross-Asset Correlation Considerations
The gold-silver ratio provides insight into precious metals complex health during stress periods. Silver falling 6.3% to $68.20 an ounce, down more than 15% for the week, demonstrates the higher volatility characteristics of industrial precious metals during risk-off periods.
Cross-asset correlation analysis reveals:
- Precious metals correlation increases during liquidation events
- Industrial metals divergence reflects economic growth concerns
- Energy correlation becomes temporarily positive during supply disruptions
- Currency correlation intensifies during dollar strength periods
The next major ASX story will hit our subscribers first
What Forward-Looking Indicators Suggest Future Price Direction?
Structural demand drivers operating beyond current volatility patterns suggest continued long-term upward pressure despite short-term technical corrections. U.S. fiscal deficit implications, demographic consumption trends, and technology sector demand evolution create underlying support mechanisms that operate independently of current geopolitical tensions.
Structural Demand Drivers Beyond Current Volatility
Demographic trends in precious metals consumption reflect generational wealth transfer patterns and changing investment preferences. Technology sector demand evolution includes electronics manufacturing, renewable energy applications, and emerging industrial uses that create price floor support independent of monetary demand.
The specific drivers include:
• Fiscal deficit monetisation concerns supporting monetary hedge demand
• Demographic wealth transfer to generations with different precious metals preferences
• Technology integration in renewable energy and electronics manufacturing
• Infrastructure investment requiring precious metals in grid modernisation
Professional Price Target Methodologies
Investment bank forecasting models incorporate multiple scenario analyses to develop price targets that account for various geopolitical and monetary policy outcomes. These models typically weight base case scenarios while incorporating tail risk probabilities that can drive significant upward price movements.
Technical analysis projection techniques focus on long-term trend channel analysis rather than short-term momentum indicators during high-volatility periods. The key levels to monitor include:
• Support levels around $4,200-$4,300 representing technical buying opportunities
• Resistance levels at $5,000-$5,200 where profit-taking may resume
• Breakout levels above $5,600 that could signal resumption of primary uptrend
• Channel boundaries that define normal trading ranges within secular trends
How Should Investors Interpret Short-Term Volatility Within Secular Trends?
Distinguishing cyclical corrections from structural breaks requires analysing multiple technical indicators simultaneously while maintaining awareness of longer-term fundamental drivers. Current volatility patterns display characteristics consistent with normal bull market corrections rather than trend reversal signals, despite the gold price set for worst week in 4 decades creating concerning headlines.
Distinguishing Cyclical Corrections from Structural Breaks
Technical indicator convergence and divergence analysis reveals whether selling pressure represents institutional repositioning or fundamental rejection of higher price levels. The combination of oversold RSI readings, sustained ETF outflows, and forced liquidation patterns suggests technical rather than fundamental selling pressure.
Volume profile interpretation during current selloffs shows characteristics typical of technical corrections:
• High-volume selling at technical support levels indicating institutional repositioning
• Lower-volume bounces suggesting limited buying interest at current levels
• Breadth deterioration across the precious metals complex during liquidation
• Momentum divergence where price makes new lows but momentum indicators do not
Opportunity Recognition During High-Volatility Periods
Value averaging strategies for precious metals accumulation become particularly relevant during periods of sustained selling pressure. These strategies involve increasing purchase quantities as prices decline, capitalising on temporary dislocations between price and underlying value.
Physical versus paper gold considerations during stress periods reflect different risk profiles and liquidity characteristics. Physical ownership provides insurance against systemic risks but lacks the liquidity of paper instruments during periods when quick repositioning becomes necessary.
Market structure evolution at higher price levels requires investors to adapt traditional precious metals strategies to account for increased institutional participation and algorithmic trading influences.
The current environment demonstrates how the gold price set for worst week in 4 decades can occur even within secular uptrends, emphasising the importance of maintaining long-term perspective while managing short-term volatility. Investors who understand these dynamics can potentially capitalise on temporary dislocations while maintaining exposure to longer-term structural trends.
Disclaimer: The analysis presented contains forward-looking statements and market predictions based on current conditions. Precious metals investments carry significant volatility risks and may not be suitable for all investors. Historical performance does not guarantee future results. Investors should conduct their own research and consider consulting with qualified financial advisors before making investment decisions. Market conditions can change rapidly, and geopolitical events may create unpredictable price movements that could result in substantial losses.
Additional Resources:
Investors seeking deeper understanding of precious metals market dynamics can explore educational content from established financial institutions, central bank research publications, and academic studies on commodity market behaviour during periods of monetary policy transition.
Ready to Capitalise on Precious Metals Market Volatility?
Discovery Alert's proprietary Discovery IQ model delivers real-time alerts on significant ASX mineral discoveries, instantly empowering subscribers to identify actionable opportunities ahead of the broader market during periods of heightened volatility. Understand why major mineral discoveries can lead to substantial market returns by exploring historic examples of exceptional outcomes, then begin your 14-day free trial to position yourself ahead of current market uncertainty.

