August 25, 2026
The Fiscal Architecture Behind Why Gold Rallies as Debt Concerns Mount
Monetary systems rarely collapse without warning. They erode gradually, and then suddenly. The mechanism is almost always the same: governments spend beyond their means, debt accumulates faster than productive capacity, confidence in sovereign instruments weakens, and capital searches for alternatives outside the fiat universe. Understanding this sequence is essential to grasping why gold rallies as debt concerns mount with increasing intensity in 2026, and why the move appears structurally grounded rather than speculative.
When big ASX news breaks, our subscribers know first
The $2 Trillion Gap That's Repricing Gold's Role in Global Portfolios
The arithmetic of American fiscal imbalance has become impossible to ignore. U.S. government spending is estimated at approximately $7.5 trillion for the current year, set against revenues of roughly $5.5 trillion, producing an annual shortfall in the vicinity of $2 trillion. This is not a cyclical anomaly driven by a single recession or emergency stimulus event. It reflects a structural mismatch between revenue generation and expenditure commitments that has compounded across successive administrations.
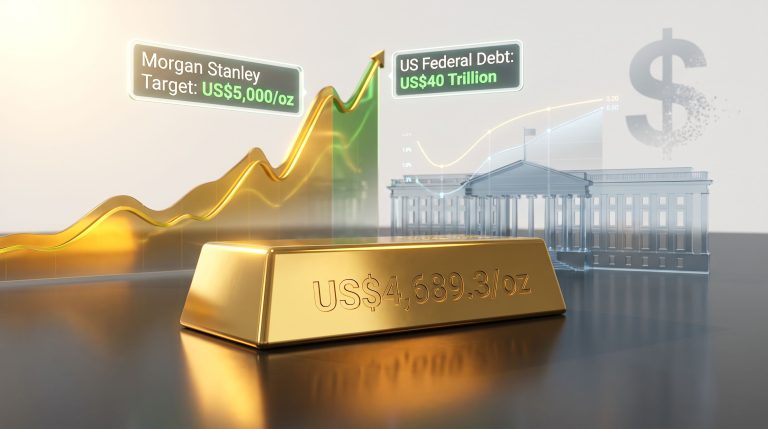
The cumulative effect of this persistent overspending is a federal debt load that has now crossed the $40 trillion threshold. Michael Peterson, a prominent fiscal policy voice, has warned that without meaningful course correction, U.S. federal debt could reach $50 trillion within six years, a trajectory that carries profound implications for long-duration bond markets and dollar credibility.
For institutional capital allocators, the $40 trillion milestone is not simply a large number. It is a signal that the marginal buyer of U.S. Treasury debt is becoming more selective, that refinancing costs will compound alongside the debt stock itself, and that the real yield environment is increasingly shaped by monetary policy accommodation rather than organic demand. All three conditions are historically associated with extended gold bull cycles. Furthermore, understanding gold-bond dynamics is essential context for interpreting these shifts accurately.
When fiscal deficits become structural rather than cyclical, gold stops behaving like a crisis hedge and starts behaving like a monetary anchor. This distinction matters enormously for portfolio construction.
Treasury Buybacks: Reading the Signal Behind the Intervention
One of the more technically significant catalysts in the current gold rally was the U.S. Treasury's announcement of accelerated buybacks targeting long-dated government bonds with maturities spanning 10 to 30 years. Markets did not receive this as routine liquidity management. Instead, the intervention was widely interpreted as evidence that organic demand from private buyers for long-duration Treasuries was insufficient to absorb supply at prevailing yields without distortion.
The transmission chain from this event to gold pricing is direct and well-documented in historical precedent:
- Buyback announcement compresses long-duration yields by injecting capital into that segment of the curve.
- Yield compression reduces the opportunity cost of holding non-yielding assets like gold.
- Dollar softens as rate differentials narrow relative to other major currencies.
- A weaker dollar expands gold's appeal among non-U.S. buyers, particularly across Asia and the Middle East, who purchase bullion in their own currencies.
- Spot gold prices rise in response to both reduced opportunity cost and expanded demand breadth.
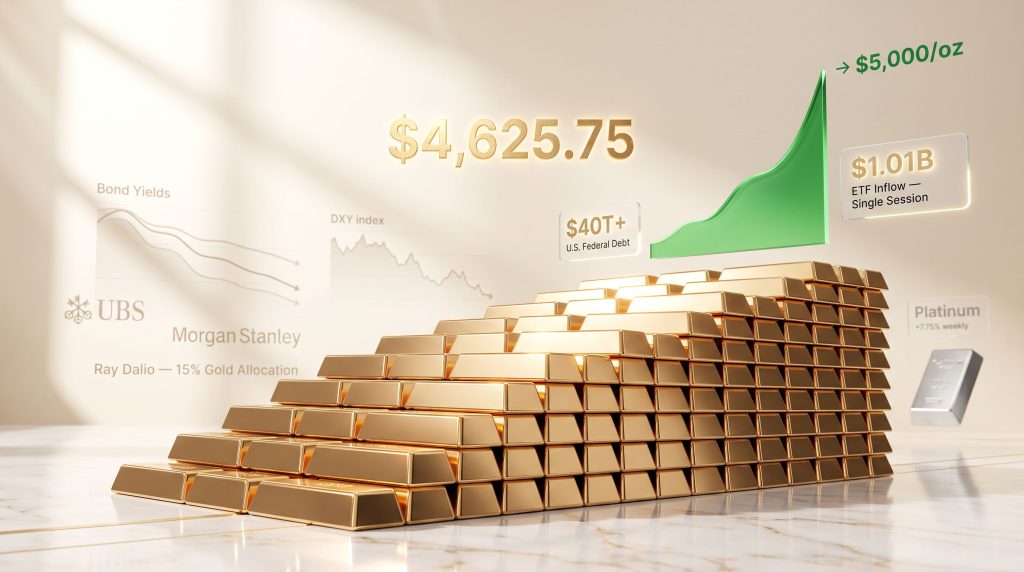
This sequence played out in near-textbook fashion following the Treasury's announcement. Spot gold surged as much as 2.4% in a single session to reach $4,625.75, locking in a third consecutive weekly gain approaching 6% and marking the metal's highest price since May. For additional context on where prices may be heading, the current gold price forecast points to continued upward momentum driven by these very structural forces.
Dollar Weakness, Debasement Risk, and the Global Repricing of Trust
A softening U.S. dollar index (DXY) is consistently one of the most reliable short-term amplifiers of gold's upside. The inverse relationship between dollar strength and gold pricing is well-established: when the dollar weakens, gold denominated in other currencies becomes cheaper relative to local purchasing power, stimulating demand from non-U.S. institutional buyers.
However, distinguishing between rate-driven dollar weakness and structurally-driven debasement risk is critical for understanding gold's durability as a trend rather than a trade. Rate-driven weakness can reverse quickly when monetary policy shifts. Debasement risk, rooted in persistent fiscal expansion, is far stickier and tends to produce sustained repricing cycles in hard assets.
The current environment contains elements of both. Fading Federal Reserve rate-hike expectations are contributing to near-term dollar softness, but the deeper structural force is the market's growing assignment of a debasement premium to gold. According to CNBC, ongoing deficit spending is broadly expected to erode the real purchasing power of dollar-denominated assets over time. This is the premium that analysts at Bloomberg Markets Live have identified as driving gold's sustained outperformance beyond what yield movements alone would predict.
What Institutional Investors Are Doing: Ray Dalio, ETF Flows, and the $5,000 Target
How Is Institutional Demand Shaping the Gold Market?
Macro investor Ray Dalio has publicly advocated for reducing bond exposure and allocating up to 15% of investment portfolios to gold as a hedge against fiscal risk. His framing of the situation is notable for its specificity: he estimates the structural revenue-expenditure gap, warns of a potential U.S. debt crisis materialising within a three-to-five year window, and points to non-government-produced stores of value as likely beneficiaries of sustained fiscal deterioration.
When allocators of Dalio's scale and public profile make such recommendations, the impact extends beyond their own portfolios. Institutional investors who anchor portfolio construction decisions to peer frameworks begin recalibrating their own gold weightings, creating a self-reinforcing demand dynamic. This is clearly visible in ETF flow data, where record gold ETF inflows have underscored the scale of institutional repositioning currently underway.
The SPDR Gold Shares ETF recorded a net inflow of $1.01 billion in a single trading session, bringing total fund assets to $146 billion. The same session saw 34,870 troy ounces added to the fund's physical holdings. These are not retail momentum flows. They represent deliberate institutional positioning at scale.
What Do the Price Targets Tell Us?
The price target landscape from major institutions reflects a broad directional consensus with important nuances:
| Institution | Price Target | Timeline | Primary Catalyst |
|---|---|---|---|
| UBS | ~$5,000/oz | H1 2027 | Breakout above key resistance zone |
| Morgan Stanley | >$5,000/oz | 2027 or earlier | Fading rate expectations, dollar weakness, central bank buying |
| Canaccord (revised) | $4,374/oz (2026) / $4,747/oz (long-term) | 2026 onward | Revised forward curve assumptions, 12-14% reduction |
The divergence between UBS and Morgan Stanley's constructive outlook and Canaccord's downward revision illustrates a critical point: even in a structurally bullish gold environment, institutional assumptions about the forward price curve vary significantly, and those differences directly affect how mining equities are valued by analysts.
The Miner Margin Problem: Why Spot Price Gains Don't Always Flow to Shareholders
One of the least discussed dynamics in gold bull markets is the growing wedge between spot price performance and mining sector profitability. According to UBS analysis, average all-in sustaining costs (AISC) for the eight largest listed gold miners rose by approximately 7%, equivalent to roughly $120 per ounce, over the most recent reporting period. Meanwhile, cash margins declined by approximately 11%, or around $400 per ounce, a significant compression even at historically elevated spot prices.
AISC is the most comprehensive cost metric in the gold mining industry, capturing not just direct mining costs but also sustaining capital expenditure, mine site overhead, royalties, and corporate-level costs. When AISC rises faster than spot prices, or when analysts revise their price deck assumptions downward, the profitability leverage that makes gold miners attractive during bull markets can evaporate quickly.
Investors should not assume that rising gold prices automatically translate into rising mining profits. Cost inflation, execution risk, and conservative analyst price assumptions can create a persistent gap between bullion performance and equity returns.
UBS specifically flagged that concerns over cost guidance escalation were most acute for miners with poor historical track records of delivering against operational targets. Consequently, gold miners' equity response to rising spot prices has been more muted than many investors anticipated, making careful stock selection increasingly important.
The next major ASX story will hit our subscribers first
Russia's Gold Liquidation and the Sovereign Reserve Divergence
While much of the narrative around central bank activity in gold markets focuses on accumulation, Russia's recent behaviour represents a notable counterpoint. Russian gold reserves declined by 1.6 million ounces year-to-date to 73.2 million ounces as of August 1, 2026, the lowest level since January 2020. The total value erosion across the seven-month period amounted to an estimated $33.7 billion.
The motivation is fiscal: Russia has been liquidating gold reserves to help finance budget shortfalls, a dynamic that illustrates how gold functions as a reserve asset of last resort for sovereigns under financial stress. This behaviour contrasts sharply with the broader pattern of central bank gold buying seen across many emerging market economies, reinforcing the point that sovereign gold strategy is not monolithic. In fact, it is precisely this divergence that makes monitoring individual country reserve data so valuable for investors.
Platinum's Structural Supply Deficit vs. Palladium's Technology Substitution Problem
The precious metals complex in 2026 is not moving as a uniform block. Platinum recorded the strongest performance across the complex with a 7.75% weekly gain, driven by a widening structural supply deficit, critically depleted above-ground inventories, and mining output constraints concentrated in South Africa. Hybrid vehicle catalysts continue to sustain industrial demand, while a notable consumer trend in China is adding a new demand dimension.
Platinum Guild International has identified a generational shift among younger Chinese consumers toward minimalist, understated jewellery aesthetics, a "quiet luxury" preference that is broadening platinum's demand profile beyond traditional bridal and wedding markets into everyday lifestyle fashion. This diversification of end-use demand is a meaningful structural positive for platinum's long-term price floor.
Palladium tells the opposite story. Its underperformance reflects an expanding supply surplus driven by rising secondary recycling volumes and the progressive substitution of palladium with platinum in automotive catalytic converters. Palladium's near-total dependence on gasoline engine applications leaves it structurally exposed to electrification trends and any fuel-mix transition, with minimal offset from jewellery or green-energy demand.
Key Risk Factors That Could Disrupt Gold's Momentum
Despite the structural tailwinds, several risk factors deserve careful attention:
- Canaccord's downward revision of gold price assumptions by 12-14% across the forward curve, with silver assumptions revised down by 12-20%, signals that not all institutional analysts share the constructive consensus.
- A genuine debt crisis, as opposed to controlled fiscal adjustment, could trigger broad risk-off liquidation that pressures all assets temporarily, including gold, before the metal reasserts its safe-haven premium.
- AISC inflation disproportionately affects miners with poor execution track records, creating significant stock-selection risk even as the gold price advances.
- Russia's ongoing reserve liquidation at scale, while modest relative to global market size, represents a source of supply-side pressure that can dampen short-term momentum.
The Forward Framework: What to Monitor as Leading Indicators
For investors tracking whether gold rallies as debt concerns mount remains a sustainable trend rather than a temporary spike, the following indicators carry the highest informational value. Furthermore, Kitco's latest analysis provides useful ongoing commentary for monitoring these signals in real time:
- Real yield trajectory: Negative or declining real yields on U.S. 10-year Treasuries remain the single most powerful structural support for gold pricing.
- DXY direction: Sustained dollar weakness amplifies non-U.S. buyer demand and extends the bull run; a sharp reversal would test gold's support levels.
- Central bank reserve data: Monthly updates from major central banks on gold purchase or sale activity provide the clearest signal of sovereign-level conviction.
- ETF flow trends: Weekly SPDR Gold Shares flow data offers a high-frequency barometer of institutional sentiment.
- AISC reporting: Quarterly cost disclosure from major miners determines whether elevated spot prices are translating into meaningful shareholder returns or being absorbed by operational inflation.
This article is intended for informational purposes only and does not constitute financial advice. Forecasts, price targets, and analyst opinions referenced herein are subject to change and involve significant uncertainty. Past performance of any asset class is not indicative of future results. Readers should conduct their own due diligence and consult a qualified financial adviser before making any investment decisions.
Want to Know When the Next Major Gold Discovery Hits the ASX?
Discovery Alert's proprietary Discovery IQ model scans ASX announcements in real time, instantly identifying significant mineral discoveries and delivering actionable insights before the broader market reacts — explore historic discovery returns to understand the scale of opportunity, then begin your 14-day free trial at Discovery Alert to position yourself ahead of the next major find.