June 16, 2026
The Mechanics Behind Gold's Multi-Session Surge
Precious metals markets have a long history of responding to the same inputs in dramatically different ways depending on the broader monetary environment. A geopolitical crisis that might have driven a brief safe-haven spike in 2018 or 2019 can produce a structurally different outcome today, when central-bank reserve strategy, real yield dynamics, and currency positioning all interact simultaneously. That layered complexity is precisely what makes the current gold rally on the US-Iran deal and Fed outlook so analytically interesting, and so difficult to trade with confidence.
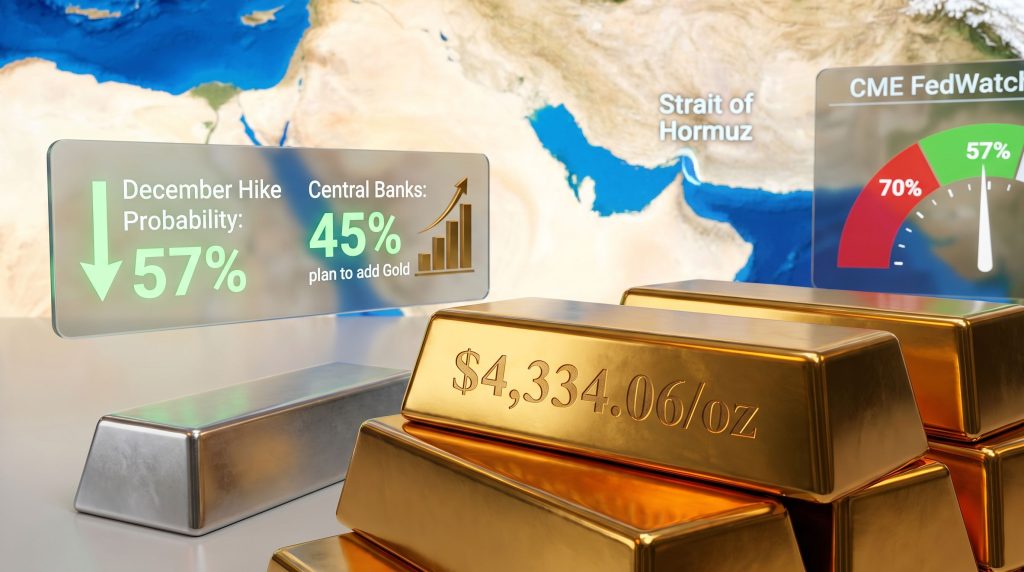
Rather than a single-catalyst price move, gold's climb to $4,334.06 per ounce reflects the simultaneous operation of at least three distinct forces: a geopolitical de-escalation that carries its own paradoxical bullish implications, a measurable compression in Federal Reserve rate-hike expectations, and a structural demand floor built by years of central-bank accumulation. Each of these forces would be meaningful in isolation. Together, they explain why bullion has posted four consecutive sessions of gains to reach a one-week high.
When big ASX news breaks, our subscribers know first
How the US-Iran Preliminary Agreement Created a Paradox for Gold
Why Peace Can Be More Bullish Than Conflict
The instinctive read on geopolitical de-escalation is bearish for gold. If risk subsides, safe-haven demand should fade, and prices should retrace. That logic holds in simple, isolated scenarios. The current situation is considerably more complex.
The preliminary agreement between the United States and Iran to end the Persian Gulf conflict and reopen the Strait of Hormuz triggered an immediate 0.6% spot gold gain to $4,334.06/oz. August gold futures added 0.1% to $4,355/oz, while silver held at $70.12/oz. Critically, the deal had already contributed approximately 3% in cumulative gold gains in the sessions preceding the formal announcement, and Bloomberg reported a single-session intraday move of as much as 1.4% on deal-related headlines.
The reason peace is bullish here runs through a transmission mechanism that bypasses safe-haven logic entirely. Furthermore, understanding this chain of causation is essential for interpreting gold safe-haven dynamics in the current environment:
- Reopening the Strait of Hormuz relieves one of the world's most critical oil supply chokepoints
- Global crude supply increases, pushing energy prices lower
- Energy-driven inflationary pressure eases, softening headline inflation expectations
- The Federal Reserve faces reduced urgency to maintain or accelerate its hiking cycle
- Real yields decline as the rate outlook softens
- The opportunity cost of holding non-yielding gold falls, expanding demand for bullion
This chain of causation means gold benefits from the Iran deal not because of the conflict itself, but because of what its resolution implies for oil prices, inflation, and ultimately, the Fed's next move.
The Unresolved Risk Embedded in an Unsigned Agreement
The preliminary deal carries a significant caveat: it remains unsigned, and its full terms will not be publicly disclosed until a formal signing ceremony. This creates a binary risk profile that investors cannot price with standard probability tools.
| Scenario | Trigger | Expected Gold Impact |
|---|---|---|
| Truce formalised as planned | Signing ceremony proceeds smoothly | Geopolitical premium fades; Fed dynamics dominate |
| Truce collapses or terms rejected | Ceremony fails or leaks negatively | Safe-haven demand surges; sharp spike higher |
| Partial agreement with unresolved clauses | Weak or ambiguous terms confirmed | Elevated volatility; mixed directional signal |
Edward Meir of Marex noted that the gold price outlook could extend through to the formal signing ceremony, with traders pricing in successful deal implementation before key terms have been made public. That front-running behaviour introduces meaningful reversal risk. If the ceremony disappoints, positions built on implementation optimism could unwind rapidly.
Federal Reserve Policy and the Compression of December Hike Odds
Understanding the CME FedWatch Shift
The second and arguably more durable driver of the current gold move is the shift in Federal Reserve rate expectations. This is where the gold rally on US-Iran deal and Fed outlook becomes particularly nuanced for investors tracking real-rate dynamics.
CME FedWatch data shows December 2026 rate-hike probability has fallen from approximately 70% before the Iran deal news to 57% at the most recent reading, a compression of 13 percentage points. This shift has contributed to the U.S. dollar hovering near 10-day lows, reducing the cost of gold for buyers transacting in non-USD currencies and amplifying demand across global markets.
According to analysis from FX Empire, the Iran deal has meaningfully cut rate-hike bets, reinforcing the bullish momentum building beneath the current gold rally.
"Every percentage-point decline in rate-hike probability reduces the forward opportunity cost of holding non-yielding assets like gold. A 13-point compression in hike odds represents a material repricing of real rates, which is historically one of the most reliable short-term directional signals in the gold market."
Kevin Warsh's Inaugural Guidance: The Highest-Stakes Catalyst of the Week
New Federal Reserve Chair Kevin Warsh's first policy communication represents the single most consequential scheduled event for near-term gold pricing. Two scenarios define the range of outcomes:
Bull Case: Warsh signals a pause or signals toward rate cuts
- Dollar weakens further from its current 10-day low
- December hike odds compress below 50%
- Gold extends above $4,334/oz with momentum building toward $4,400
- Gold-backed ETFs and mining equities benefit from improved real-rate outlook
Bear Case: Warsh signals hawkish intent or confirms a hiking path
- December hike odds revert toward 70% or above
- Dollar strengthens, increasing gold's opportunity cost
- Gold retraces toward the $4,200 to $4,250 near-term support zone
- JP Morgan has previously warned that a combination of sticky inflation and resilient economic growth could lock in a sustained hiking cycle, which would be structurally negative for bullion
How Rate Sensitivity Has Shifted in the Current Gold Market
| Rate Environment | Gold Price Behaviour | Key Mechanism |
|---|---|---|
| Falling hike probability | Bullish | Dollar weakens; real yields decline |
| Rising hike probability | Bearish | Dollar strengthens; opportunity cost rises |
| Rate-cut expectations | Strongly bullish | Real rates turn negative; gold outperforms most assets |
| Higher-for-longer rates | Persistent headwind | Real yield competition suppresses non-yielding gold |
Central Bank Demand: The Structural Floor That Changes the Equation
Why This Gold Market Is Fundamentally Different From 2015 to 2018
One element of the current gold environment that receives insufficient attention in short-term trading analysis is the scale and durability of institutional gold accumulation. The central bank gold demand has rebuilt the structural demand floor beneath gold in a way that limits downside even during adverse monetary policy cycles.
According to the World Gold Council's most recent survey data:
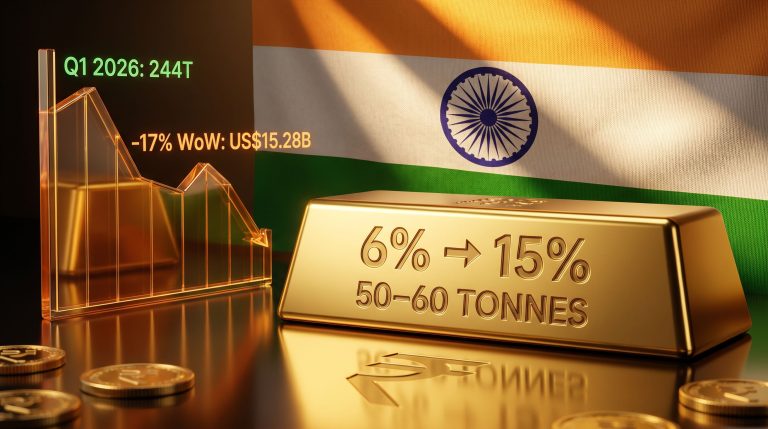
- A record 45% of central-bank reserve managers plan to increase gold allocations over the next 12 months
- 90% of respondents identified gold's performance during systemic crises as the primary rationale for holding the metal
- 85% of emerging-market respondents specifically cited gold as a hedge against political and sovereign risk
Metals Focus forecasts that central-bank purchases will decline approximately 15% in 2026 relative to recent peak years. That sounds like a headwind until the baseline is examined: even a 15% reduction from recent highs keeps institutional buying materially above pre-2022 levels, sustaining a demand floor that was simply not present during gold's prolonged consolidation between 2015 and 2018.
"The structural implication is significant. Even if the US-Iran truce holds and the Fed turns hawkish, the scale of institutional gold accumulation provides a demand buffer that reshapes gold's risk-reward profile compared to previous rate-hiking cycles."
This is not a speculative observation. The multi-year shift in reserve manager behaviour reflects a deliberate diversification away from U.S. dollar assets following the weaponisation of dollar-denominated reserves in 2022. That strategic pivot has created persistent, price-insensitive buying that absorbs supply and limits drawdown depth.
Silver's Structural Divergence: India's Import Collapse Changes the Precious Metals Calculus
A 94% Volume Drop and What It Actually Signals
While gold navigates a macro repricing story, silver is experiencing a supply dislocation of an entirely different character. The two metals are often grouped together, however their current price drivers share almost nothing in common. In addition, the precious metals market impacts of trade policy decisions are becoming increasingly visible in silver's performance relative to gold.
India's May 2026 silver import volumes collapsed 94% year-over-year to just 33 metric tons, the lowest monthly reading since February 2023. In value terms, the decline was 87% year-over-year, falling to $75.57 million. The immediate cause was a government decision to raise precious-metal import duties from 6% to 15%, while simultaneously imposing permit requirements on nearly all silver forms, including grain and powder.
The scale of this disruption matters because India sources more than 80% of its domestic silver supply through imports, drawing primarily from the UAE, the United Kingdom, and China. When that import pipeline is restricted, domestic supply cannot self-replenish, regardless of demand levels.
The Domestic Price Distortion Created by Trade Policy
The mechanics of the supply squeeze create a self-reinforcing price distortion:
- Import restrictions reduce the volume of silver entering the domestic market
- Industrial, jewellery, and solar panel fabrication demand continues at near-normal levels
- Reduced supply against steady demand pushes local Indian silver prices above international spot benchmarks
- The premium cannot be arbitraged away because the import restrictions prevent additional volume from entering
- Silver ETFs with India-linked exposure face greater near-term pricing risk than their gold-backed equivalents
India's policy rationale for the restrictions combined three objectives: reducing import demand to conserve foreign-exchange reserves, supporting the rupee during a period of elevated energy import costs, and narrowing the trade deficit. The 87% decline in silver import value has meaningfully contributed to all three objectives, but the domestic supply consequences are now creating their own dislocations.
Gold vs. Silver: Comparative Positioning in Mid-2026
For investors considering relative value, the gold-silver ratio analysis provides important context for understanding how these divergent drivers are reshaping positioning across the two metals.
| Metric | Gold | Silver |
|---|---|---|
| Spot Price | $4,334.06/oz | $70.12/oz |
| Primary Near-Term Driver | Fed outlook and US-Iran deal | India import restrictions |
| Central Bank Demand | Record high; 45% plan to add | Not applicable |
| Key Downside Risk | Hawkish Fed pivot | Prolonged Indian import curbs |
| ETF Risk Profile | Moderate, supported by institutional demand | Elevated; supply distortion ongoing |
Monitoring the Two Binary Catalysts Defining Gold's Next Directional Move
A Framework for Real-Time Decision Making
Gold's trajectory over the coming sessions is governed by two events that are both binary in outcome and largely opaque in advance. The inability to model either with high confidence means that position sizing and real-time monitoring tools become the primary risk management instruments.
Catalyst One: The US-Iran Formal Signing Ceremony
- Successful completion shifts the focus entirely to Fed policy dynamics; geopolitical premium gradually fades
- Collapse or delay triggers a safe-haven demand surge; gold could spike sharply above recent highs
Catalyst Two: Fed Chair Warsh's First Policy Signal
- Dovish or neutral tone weakens the dollar, compresses December hike odds further, extends the gold rally
- Hawkish guidance pushes hike odds back toward 70%, strengthens the dollar, and creates near-term correction risk toward $4,200 to $4,250
As Reuters has reported on the competing pressures between US-Iran tensions and interest rate outlook, gold continues to navigate a challenging dual-catalyst environment that makes directional confidence particularly difficult to sustain.
"Because both catalysts are binary and fall within a short timeframe, leveraged positions in gold or gold-mining equities carry asymmetric risk. A reversal in either direction could rapidly erase the gains accumulated across the four-session rally. Position sizing, not directional conviction, is the appropriate risk management response."
The Four Indicators Worth Monitoring in Real Time
- CME FedWatch Tool: Track December rate-hike probability immediately before and after Warsh's statement for the cleanest directional signal
- DXY (U.S. Dollar Index): Dollar movement post-Fed statement is the fastest proxy for gold's near-term trajectory
- 10-Year Treasury Real Yield: A rise in real yields following the Fed statement signals near-term gold headwinds
- Brent Crude: Continued oil price decline following the Iran deal reinforces the inflation-easing narrative underpinning gold's current rally
The next major ASX story will hit our subscribers first
FAQ: Gold Rally on US-Iran Deal and Fed Outlook
Why did gold rise after the US-Iran deal if geopolitical risk declined?
The rally is transmission-driven rather than sentiment-driven. The deal eases oil supply constraints through the Strait of Hormuz, which reduces energy inflation, softens the Fed's urgency to hike, compresses real yields, and lowers the opportunity cost of holding gold. The metal benefits from the downstream monetary policy implications, not the direct safe-haven effect.
What is the current December Fed rate-hike probability?
As of the most recent CME FedWatch data, the probability of a December rate hike stands at 57%, down from approximately 70% before the Iran deal news emerged. That 13-point compression has contributed to the dollar trading near 10-day lows and directly supported gold's multi-session advance.
What would reverse the current gold rally?
Two primary triggers carry reversal potential: a hawkish signal from Fed Chair Kevin Warsh that pushes December hike odds back toward 70%, or a failure of the US-Iran truce to formalise at the signing ceremony. Either outcome could erase the four-session gain relatively quickly.
Why is silver behaving so differently from gold right now?
Silver's current challenge is structural rather than macro. India raised precious-metal import duties to 15% and restricted permit access for nearly all silver forms, causing a 94% collapse in May 2026 import volumes to 33 metric tons. Since India sources more than 80% of its silver through imports, this has created domestic supply shortages and a local price premium above international benchmarks — a dynamic entirely unrelated to the Fed or geopolitical forces driving gold.
How committed are central banks to gold purchases?
The World Gold Council's survey data shows a record 45% of central-bank reserve managers plan to increase gold allocations over the next 12 months. Ninety percent cited crisis performance as their primary rationale, while 85% of emerging-market respondents identified gold specifically as a hedge against political and sovereign risk. Metals Focus projects central-bank purchases will decline approximately 15% in 2026 relative to recent peak years but remain well above pre-2022 levels.
What is the near-term technical support for gold if the rally reverses?
Based on current market structure, the $4,200 to $4,250 range represents the near-term support zone if hawkish Fed guidance triggers a pullback from the current level near $4,334/oz.
Assessing Whether the Rally Has Structural Legs or Event-Driven Fragility
The four-session rally to $4,334.06/oz reflects a genuine macro repricing, not a one-off headline response. The compression of December hike odds from 70% to 57%, the dollar's retreat to 10-day lows, and record central-bank demand collectively provide substantive support for current price levels. This is not a market trading on rumour alone.
However, two unresolved binary events — the formal US-Iran signing and Warsh's inaugural Fed guidance — mean that the rally's extension depends on outcomes that markets cannot price with confidence. The structural case for gold, anchored by institutional demand and a fundamentally altered central-bank reserve framework, remains intact regardless of how those events resolve. The near-term directional case is considerably more fragile.
Key takeaways for investors tracking the gold rally on US-Iran deal and Fed outlook:
- Spot gold at $4,334.06/oz reflects a convergence of geopolitical and monetary tailwinds, not a single event
- The Fed outlook is the more durable of the two drivers; the Iran deal is the more structurally fragile
- Silver faces an entirely different challenge rooted in Indian trade policy, not broader macro conditions
- Central-bank demand has rebuilt a structural floor beneath gold that limits downside even in hawkish policy scenarios
- Real-time monitoring of CME FedWatch, the DXY, and Brent crude remain the most effective tools for tracking directional risk in this environment
This article is for informational purposes only and does not constitute financial or investment advice. Precious metals markets involve significant risk, and past price performance is not indicative of future results. Readers should conduct their own due diligence before making any investment decisions.
Want to Know When the Next Major ASX Mineral Discovery Hits the Market?
Discovery Alert's proprietary Discovery IQ model delivers real-time alerts on significant ASX mineral discoveries, instantly translating complex geological and commodity data into actionable investment insights — no matter how fast market conditions shift. Start your 14-day free trial at Discovery Alert today, or explore how historic mineral discoveries have generated substantial returns for investors who moved early.