July 22, 2026
The Monetary Architecture Behind Sovereign Gold Accumulation
Monetary systems do not collapse suddenly. They erode gradually, through a thousand small decisions made by institutions that can see further down the road than most market participants. Understanding which countries are building gold positions, at what pace, and for what strategic purpose, offers a more revealing view of the global financial landscape than almost any other single data point available to investors today.
The gold reserves by country rankings published for Q1 2026 are best understood not as a static leaderboard, but as a dynamic strategic map reflecting decades of monetary history, current geopolitical tension, and forward-looking reserve management decisions being made right now by the world's most sophisticated institutional actors.
When big ASX news breaks, our subscribers know first
The 2026 Gold Reserves by Country Rankings: Official Holdings at a Glance
The table below presents official sovereign gold holdings as of Q1 2026, drawn from World Gold Council data and IMF International Financial Statistics. The gold-to-reserves percentage column is where the real analytical weight sits.
| Rank | Country | Gold Holdings (Tonnes) | Gold as % of Total Reserves |
|---|---|---|---|
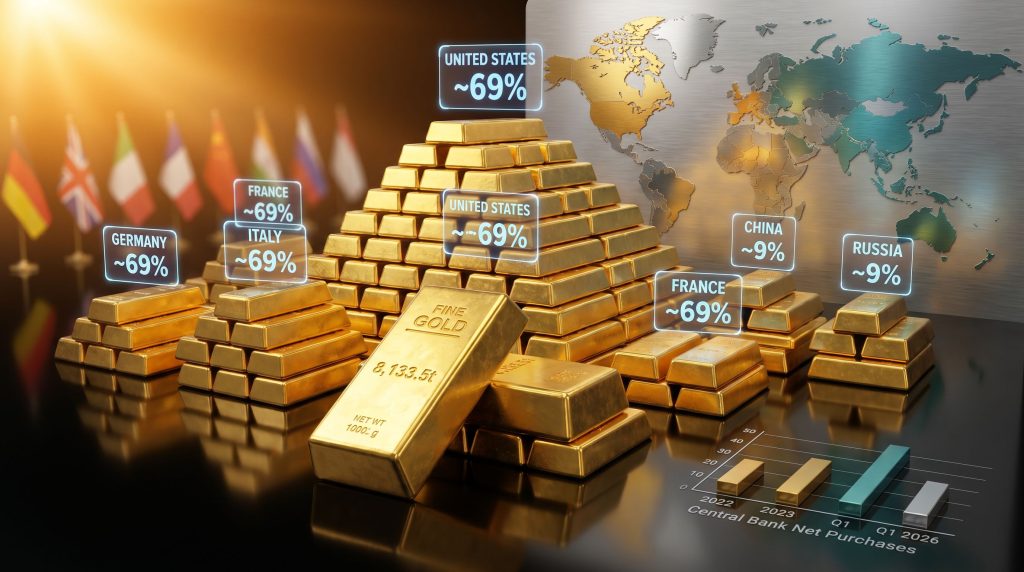
| 1 | United States | 8,133.5 | ~69% |
| 2 | Germany | 3,350.3 | ~69% |
| 3 | Italy | 2,451.8 | ~67% |
| 4 | France | 2,437.0 | ~65% |
| 5 | China | 2,313.4 | ~9% |
| 6 | Russia | 2,304.7 | ~29% |
| 7 | Switzerland | 1,039.9 | ~7% |
| 8 | India | 880.5 | ~9% |
| 9 | Japan | 845.9 | ~5% |
| 10 | Netherlands | 612.5 | ~22% |
Sources: World Gold Council; IMF International Financial Statistics, Q1 2026
The top 10 nations collectively account for approximately 70% of all officially reported global gold reserves, with the United States and Europe together representing more than 60% of that concentration (World Gold Council, 2026). Furthermore, central bank gold reserves have become an increasingly significant component of this picture as institutional demand continues to evolve.
Beyond the top 10, several holdings deserve attention:
- Poland: 582 tonnes, targeting 700 tonnes, representing the most aggressive accumulation program in the Western world
- Uzbekistan: 416 tonnes, with gold comprising approximately 87% of total foreign reserves
- IMF institutional holdings: approximately 2,814.1 metric tonnes, which would rank third globally if the institution were treated as a sovereign entity
Why Raw Tonnage Is a Lagging Indicator
The total tonnes figure tells you where a country has been. The gold-to-total-reserves ratio, combined with the rate of change in holdings, tells you where it is going.
The strategic significance of any gold reserve position depends not on tonnage alone, but on three variables operating simultaneously: the rate of accumulation, the percentage of total reserves committed to gold, and the geopolitical rationale driving each purchasing decision. Tonnage is history. Buying behavior is intent.
This distinction matters enormously when interpreting the 2026 rankings. The United States holds 8,133.5 tonnes and has not been a meaningful net buyer in decades. China holds 2,313.4 tonnes and has been buying for more than 17 consecutive months as of Q1 2026 (World Gold Council Gold Demand Trends Q1 2026). The number in the rankings is a snapshot. The trajectory is the story.
There is also a critical distinction between legacy stockpiles and active accumulation programs. Western nations built their positions under the Bretton Woods architecture, a monetary framework that made gold in the monetary system the foundation of the international order. Those positions have been largely maintained, not expanded. The active accumulation story belongs to a very different group of countries.
The 69% Versus 9% Divide: What It Reveals About Structural Demand
The most consequential number in the entire gold reserves by country dataset is not a tonnage figure. It is the gap between two percentages: the ~69% gold-to-reserves ratio held by the United States and Germany, and the ~9% ratio held by China, alongside Japan's even lower ~5%.
This divergence reflects fundamentally different monetary histories:
- High-ratio nations (US, Germany, Italy, France): Built positions under a gold-backed system and have preserved them through the fiat era. Gold is a structural inheritance.
- Low-ratio nations (China, Japan, South Korea): Accumulated reserves primarily through export surpluses, denominated overwhelmingly in US dollars. Gold is a relatively small component of an enormous reserve base.
The gap between these two groups represents the single largest identifiable structural demand driver in the global gold market. Nations furthest from the Western-legacy gold allocation are the ones buying fastest. If that convergence dynamic continues for even a fraction of the distance required to close the gap, the demand implications are substantial and multi-year in duration.
Three Consecutive Years of Elevated Central Bank Buying: The Data in Context
The scale of institutional gold accumulation since 2022 has no modern precedent. Consider the trajectory:
| Year | Net Central Bank Gold Purchases | Context |
|---|---|---|
| 2022 | ~1,082 tonnes | Highest annual total in over 50 years |
| 2023 | ~1,037 tonnes | Second consecutive year above 1,000t |
| Q1 2026 | 244 tonnes | Above prior quarter and 5-year average |
Source: World Gold Council Gold Demand Trends
Central bank gold demand has absorbed roughly one-third of annual global mine production through net purchases for three consecutive years. This is not a tactical rotation responding to short-term price signals. It is a deliberate, multi-year structural reallocation of sovereign balance sheets.
The trigger event is well-documented. In February 2022, approximately $300 billion in Russian central bank assets held within Western financial infrastructure were frozen following the invasion of Ukraine (Brookings Institution, 2025). The operational consequence for every reserve manager on earth was immediate and permanent: foreign-held dollar assets carry sovereign counterparty risk that cannot be neutralised through conventional financial hedging instruments alone.
Domestically vaulted gold carries none of that risk. It cannot be frozen, sanctioned, or subjected to foreign clearing system disruption. It requires no counterparty relationship to retain value and appreciates independently of any single nation's monetary policy. These properties moved from theoretical advantages to operationally critical considerations in a single month, and the buying data since then reflects exactly that shift.
Country-by-Country Analysis: The Active Accumulators
Poland: Fortress Reserve Construction in Real Time
Poland's accumulation trajectory is among the most striking in the world. Holdings grew from approximately 103 tonnes in 2018 to 582 tonnes by Q1 2026, an increase exceeding 460% in under eight years (World Gold Council; National Bank of Poland). In January 2026, the National Bank of Poland formally adopted a 700-tonne reserve target, making the strategic intent explicit rather than implied (National Bank of Poland, January 2026).
The rationale, articulated publicly by National Bank of Poland Governor Adam Glapiński, is grounded in geopolitical geography rather than pure monetary economics. Poland occupies NATO's eastern flank, and gold held within Polish sovereign territory cannot be subject to external interference regardless of how the geopolitical environment evolves. This is not an abstract monetary philosophy. It is a security calculation.
China: The Opacity Premium and What Official Data Cannot Capture
China's official position of 2,313.4 tonnes places it fifth in the global gold reserves by country rankings, representing approximately 9% of total reserves (World Gold Council / IMF IFS, Q1 2026). The People's Bank of China added 7 tonnes in Q1 2026, extending a documented buying streak exceeding 17 consecutive months.
However, China's historical approach to reserve disclosure warrants careful analytical attention. In July 2015, the People's Bank of China disclosed a 604-tonne increase in a single announcement, reflecting six years of accumulation that had never appeared in monthly reporting (People's Bank of China, July 2015; World Gold Council). The precedent for strategic opacity is firmly established.
Several converging signals suggest actual holdings may be considerably above the official figure:
- Shanghai Gold Exchange throughput volumes have remained consistently elevated, with physical metal flows that imply demand well above what official purchase disclosures would suggest
- Domestic mine production runs at approximately 380 tonnes per year, making China the world's largest gold producer (World Gold Council, 2024). The disposition of that domestically produced metal is not always transparently reported
- Policy architecture across multiple institutional layers actively directs gold accumulation, including through state-owned entities whose holdings may not appear in central bank reserve statistics
If actual Chinese holdings are closer to 4,000 to 5,000 tonnes, gold would represent 15 to 20% of total reserves rather than the reported 9%. At that threshold, gold-referenced trade settlement frameworks become operationally viable rather than theoretically interesting. This possibility also connects directly to a broader global monetary shift being driven in part by China's evolving reserve strategy.
Uzbekistan: The Highest Concentration Ratio Among Active Buyers
Uzbekistan added 25 tonnes in Q1 2026, lifting total holdings to 416 tonnes (World Gold Council Gold Demand Trends Q1 2026). Gold represents approximately 87% of its total foreign reserves, among the highest concentration ratios of any central bank globally. A nation allocating that proportion of its reserve base to a single asset class is making an unambiguous institutional statement about which monetary instruments it trusts to function reliably under stress.
India: Steady Accumulation as Currency Risk Management
India's 880.5 tonnes of gold reserves reflects a deliberate strategy of reducing dollar concentration and managing currency volatility across business cycles. India operates as a long-term structural buyer rather than a momentum-driven accumulator, using gold as a dynamic tool within a broader reserve management framework (World Gold Council).
The next major ASX story will hit our subscribers first
Why Western Nations Are Not Net Buyers
The United States, Germany, Italy, and France hold between 65% and 69% of their total reserves in gold, a structural inheritance from the Bretton Woods monetary architecture. These are appreciation assets, not active accumulation programs.
The scale of that appreciation is worth examining precisely:
The United States carries its 8,133.5-tonne gold stockpile at the statutory book value of approximately $37 billion, calculated at the historical $35 per troy ounce accounting price established during the Bretton Woods era. At the market price of approximately $4,450 per troy ounce as of May 2026, the same stockpile carries a market value of approximately $1.16 trillion (US Treasury; market data, May 2026). The unrealised gain on that single line item represents one of the largest mark-to-market discrepancies on any government balance sheet in the world.
The countries that designed the current dollar-based monetary architecture are sitting on enormous, largely static gold positions built across decades. The countries most actively questioning the long-term durability of that architecture are buying most aggressively. The reserve rankings reflect history. The buying behaviour reflects where these institutions believe the monetary system is heading.
The IMF's Position in the Global Gold Architecture
The IMF holds approximately 2,814.1 metric tonnes of gold (roughly 90.5 million troy ounces), sufficient to rank third globally if classified as a sovereign entity, ahead of both Italy and France (IMF Factsheet: Gold in the IMF). These holdings belong to the institution itself and are not allocated to individual member nations.
The IMF's last major disposal program ran from 2009 to 2010, covering a total of 403.3 tonnes distributed as follows:
- Reserve Bank of India: 200 tonnes
- Sri Lanka: 10 tonnes
- Bangladesh: 10 tonnes
- Mauritius: 2 tonnes
- On-market sales: 181.3 tonnes
(IMF Press Release No. 09/310; IMF Press Release No. 10/333)
No comparable disposal program has been initiated since, and the current environment of sustained central bank accumulation makes a renewed IMF sales program politically and institutionally unlikely in the near term.
The Audit Gap: What Is and Is Not Known About US Gold Holdings
The last comprehensive independent audit of United States gold reserves was conducted during the Eisenhower administration. All subsequent verification has consisted of internal audits conducted by the US Treasury and the US Mint. The Federal Reserve Bank of New York audits gold it custodies on behalf of foreign governments, but this process is entirely separate from the US sovereign holding of 8,133.5 tonnes.
The absence of a comprehensive independent audit is a transparency gap, not evidence of discrepancy. No credible evidence of any material discrepancy has emerged from the internal auditing process. However, the gap does periodically generate institutional credibility questions that are worth understanding in context. In addition, questions about London gold reserves and vault transparency reflect similarly complex custodial dynamics that analysts continue to monitor closely.
Three Scenarios for the Global Reserve Landscape Through 2030
Scenario 1: Continued Structural Accumulation (Base Case)
Central bank net purchases remain above 1,000 tonnes annually through 2027 to 2028. China's official holdings approach 3,000 tonnes within 24 months. Poland reaches its 700-tonne target ahead of schedule. Gold-to-reserves ratios among emerging market central banks converge gradually toward 20 to 25%, sustaining the structural demand floor that has absorbed approximately one-third of annual mine production since 2022.
Scenario 2: Accelerated Disclosure Events Reshape Rankings
A major economy discloses previously unreported holdings in a single announcement, consistent with China's July 2015 precedent. Official rankings shift materially within a single reporting cycle. Gold-referenced bilateral trade settlement frameworks become operational among aligned economies, increasing the monetary utility of gold reserves beyond their current role as a passive hedge against dollar system risk.
Scenario 3: Demand Reversal (Low Probability, High Consequence)
Geopolitical normalisation reduces the perceived counterparty risk associated with dollar reserves. Central bank net purchases revert toward the near-zero levels recorded during the 1990s and 2000s. The structural demand floor absorbing one-third of annual mine output is removed, with significant implications for price support.
Assessment: the conditions that produced this buying cycle, including the demonstrated willingness to weaponise dollar reserves, sustained de-dollarisation pressure, and ongoing geopolitical fragmentation, show no credible near-term reversal trajectory.
What the Gold Reserves Data Means for Individual Investors
Central banks operate on multi-decade institutional mandates. They build positions slowly, deliberately, and without the short-term urgency that characterises retail market participation. Three consecutive years of net purchases exceeding 1,000 tonnes annually represents an institutional endorsement of gold at a scale not seen in the modern era, from the reserve managers with the deepest information advantages and the longest planning horizons in the global financial system.
The analytical framework for individual investors is relatively straightforward:
- Nations furthest from the ~69% gold-to-reserves benchmark held by the US and Germany are buying fastest
- The convergence dynamic, if sustained, implies structural demand across years or decades rather than quarters
- The same ratio-gap framework applies at the individual level: what proportion of personal financial reserves is allocated outside the fiat monetary system?
Central banks think in decades and build positions at a pace that creates no urgency and generates no headlines. Individual investors who understand what those institutions are doing and why they are doing it are positioned to apply the same long-duration logic to their own reserve management decisions. For those seeking a broader overview, the World Gold Council's gold reserves data provides a regularly updated reference point across all reporting nations. Furthermore, Investing News Network's analysis offers additional context on the top holders and the strategic motivations behind their accumulation programs.
Key Statistics Summary: Gold Reserves by Country at a Glance
| Metric | Figure | Source |
|---|---|---|
| Largest sovereign gold holder | United States, 8,133.5 tonnes | World Gold Council, Q1 2026 |
| Top 10 share of global official reserves | ~70% | World Gold Council |
| US + European share of global official reserves | >60% | World Gold Council |
| Central bank net purchases, Q1 2026 | 244 tonnes | WGC Gold Demand Trends Q1 2026 |
| Central bank net purchases, 2022 | ~1,082 tonnes | World Gold Council |
| Central bank net purchases, 2023 | ~1,037 tonnes | World Gold Council |
| Russia frozen reserves (February 2022) | ~$300 billion | Brookings Institution, 2025 |
| Poland gold growth (2018 to 2026) | 103t to 582t (+460%) | World Gold Council; NBP |
| Poland official reserve target | 700 tonnes | National Bank of Poland, Jan 2026 |
| Uzbekistan gold-to-reserves ratio | ~87% | WGC Gold Demand Trends Q1 2026 |
| China consecutive buying months (to Q1 2026) | 17+ months | WGC Gold Demand Trends Q1 2026 |
| IMF institutional holdings | ~2,814.1 tonnes | IMF Factsheet: Gold in the IMF |
| US gold book value (statutory) | ~$37 billion | US Treasury |
| US gold market value (May 2026) | ~$1.16 trillion | Market data, May 2026 |
Frequently Asked Questions: Gold Reserves by Country
Which country holds the largest gold reserves in the world?
The United States leads all sovereign nations in the gold reserves by country rankings, holding 8,133.5 tonnes as of Q1 2026, stored primarily at Fort Knox and the Federal Reserve Bank of New York (World Gold Council, 2026).
Which country has the highest proportion of its reserves held in gold?
Among active accumulating nations, Uzbekistan leads with gold representing approximately 87% of total foreign reserves. Among major economies, the United States and Germany both hold approximately 69% of total reserves in gold, while China holds approximately 9%, Japan 5%, and Switzerland 7% (World Gold Council / IMF IFS, Q1 2026).
Why does China's gold-to-reserves ratio remain so low despite sustained buying?
China's total foreign exchange reserves exceed $3 trillion, predominantly held in dollar-denominated instruments including US Treasuries. Against that base, 2,313.4 tonnes of gold represents approximately 9% regardless of accumulation pace. Two explanations coexist without being mutually exclusive: strategic under-reporting to avoid telegraphing a dollar exit, and deliberate maintenance of large dollar positions to preserve trade flexibility. The direction of travel is not in doubt given more than 17 consecutive months of documented net purchases as of Q1 2026.
How often are gold reserve rankings updated?
The IMF International Financial Statistics database is updated monthly as countries submit data. The World Gold Council publishes comprehensive reserve data quarterly through its Gold Demand Trends series. Individual countries may report with a lag, and China in particular has a documented history of batch disclosures rather than continuous monthly reporting.
What would happen to gold prices if central banks reversed course and became net sellers?
Current central bank net purchases absorb approximately one-third of annual global mine production. A reversal toward the net-selling behaviour recorded during the 1990s and early 2000s would remove a structural demand floor that has not existed in the gold market for the majority of the past three decades. Most institutional analysis concludes that the geopolitical and monetary conditions producing this buying cycle remain firmly intact, with no credible near-term basis for a sustained reversal.
Disclaimer: This article is for informational and educational purposes only. It does not constitute financial or investment advice. All forecasts, projections, and scenario analyses represent analytical frameworks rather than predictions of future outcomes. Readers should consult a qualified financial adviser before making any investment decisions. Past performance is not indicative of future results.
Want to Know Which ASX Mineral Discoveries Could Deliver the Next Major Return?
Discovery Alert's proprietary Discovery IQ model scans ASX announcements in real time, instantly identifying significant mineral discoveries and translating complex data into clear, actionable opportunities — explore historic examples of exceptional discovery outcomes to understand the scale of what early positioning can mean, then begin your 14-day free trial at Discovery Alert to secure your market-leading edge.