June 13, 2026
Why Gold's Valuation Is Never Just One Number
Precious metals markets have a long tradition of attracting competing narratives about what gold is truly "worth." Unlike a corporate bond with a defined coupon or an equity with measurable earnings, gold resists simple valuation. There is no universally agreed framework, no consensus discount rate, and no single analyst community that holds the definitive answer. The result is a metal that simultaneously appears cheap to some models, expensive to others, and fairly priced by a third set entirely. Understanding this multi-model reality is the essential starting point for any serious analysis of whether a gold return to fair value is underway, overdue, or already largely complete.
In mid-2026, that question has shifted from theoretical to urgently practical. After an extraordinary rally that carried spot gold to an all-time intraday high of $5,586/oz on January 29, 2026, the metal has spent the subsequent months in a sustained corrective phase that has forced every major valuation model back into focus simultaneously.
When big ASX news breaks, our subscribers know first
The Multi-Framework Valuation Problem: What Each Model Actually Measures
Before assessing whether gold has returned to fair value, it is worth understanding what "fair value" actually means across the dominant analytical frameworks used by institutional market participants. The table below summarises the four primary approaches and what mid-2026 conditions signal within each:
| Valuation Framework | Core Methodology | Mid-2026 Signal |
|---|---|---|
| Inflation-Adjusted Historical Average | Real purchasing power parity across decades of CPI data | Gold appears elevated |
| M2 / Monetary Debasement Model | Gold price indexed to U.S. dollar monetary base expansion | Gold sits in mid-range, not at extremes |
| Real Yield / Opportunity Cost Model | Gold's attractiveness relative to inflation-adjusted bond yields | Directionally ambiguous given competing forces |
| Technical Regression (BEGOS Composite) | Multi-market statistical mean reversion from price trend lines | Gold trading below the broader market-implied equilibrium |
Each model tells a different story. The inflation-adjusted historical approach suggests gold above $4,000/oz in 2026 is expensive on a pure purchasing power basis. The monetary debasement model, which gained significant institutional traction following the extraordinary M2 expansion of 2020 to 2022, places gold's 2026 pricing in a far more moderate historical context.
The real yield framework depends entirely on whether the Federal Reserve succeeds in generating positive real rates by suppressing inflation below nominal yields. Furthermore, the BEGOS multi-market regression composite actually places gold's implied equilibrium above current spot prices. For those exploring how multiple models converge and diverge, three valuation models offer a useful reference for grounding expectations.
The core insight for investors is this: gold's fair value is not a fixed destination. It is a dynamic output that shifts as monetary conditions, inflation expectations, and multi-asset correlations evolve. Anyone citing a single price target as definitive fair value is, by definition, model-dependent.
Gold's 2026 Price Correction: What the Numbers Actually Show
From All-Time Highs to Year-to-Date Lows
Gold's 2026 trajectory has been one of the more dramatic in recent memory. The metal opened the year with extraordinary momentum, posting its all-time intraday high of $5,586/oz on January 29 and its all-time closing high of $5,411/oz on January 28. From those peaks, a sustained corrective sequence unfolded across the following months.
By mid-June 2026, gold had printed a year-to-date low of approximately $4,046/oz, representing:
- A drawdown of roughly -6.6% from the start of 2026
- A peak-to-trough decline of approximately -27.5% from the January intraday high
- The sixth down week in the past eight for weekly closing prices
- A confirmed violation of the structural support zone between $4,584 and $4,284 for the second time in the correction
The metal subsequently bounced to as high as $4,267/oz before settling the week at approximately $4,240/oz, but the broader trend architecture remained negative across both near-term linear regression measures and the weekly parabolic trend indicator. The current gold price forecast provides additional context on the structural forces shaping this trajectory.
The Debasement Fair Value Corridor
One of the more instructive valuation exercises involves comparing spot gold against two simultaneously tracked model outputs: the dollar debasement fair value anchor and the BEGOS multi-market regression composite value.
As of mid-June 2026:
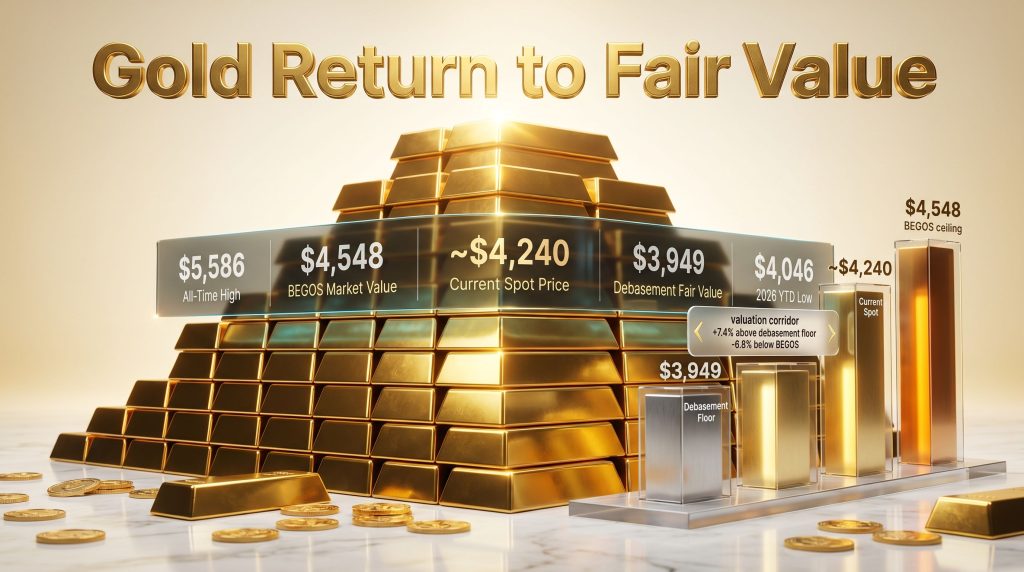
- Dollar debasement fair value: approximately $3,949/oz
- BEGOS Market Value (multi-market regression composite): approximately $4,548/oz
- Spot price: approximately $4,240/oz
This positions gold in a precise valuation corridor. Spot was running +$291 points, or +7.4% above its debasement fair value floor, while simultaneously sitting -$308 points, or -6.8% below its broader market-implied equilibrium ceiling. Neither condition represents an extreme, but the corridor itself is analytically useful.
When gold's year-to-date low of $4,046/oz is viewed against the debasement fair value of $3,949/oz, the gap was approximately 97 points, or less than one single day's expected trading range of roughly 118 points. Mean reversion pressure was actively compressing gold's premium against its model anchor throughout the June correction.
The Federal Reserve Factor: Why Rate Hikes Are Not Automatically Bearish
Challenging the Conventional Wisdom
One of the most persistent assumptions in mainstream financial commentary is that Federal Reserve rate increases are inherently negative for gold. The logic appears intuitive: rising nominal yields increase the opportunity cost of holding a non-yielding asset, reducing gold's relative attractiveness. However, historical evidence challenges the automatic application of this logic, particularly in environments where inflation is running materially above target.
The 2004 to 2006 Federal Reserve tightening cycle offers a compelling counter-narrative. During that period, the Fed executed a sustained series of consecutive rate increases across three years. Despite this, gold prices rose consistently throughout the cycle. Notably, the U.S. Dollar Index gained approximately +5% between January 2004 and November 2005, a period during which gold also advanced.
The conventional bearish narrative for gold failed to materialise in practice because real yields, adjusted for the inflation environment of the time, did not rise sufficiently to change gold's structural attractiveness. In addition, understanding the safe-haven role of gold during these periods helps explain why the metal's performance defied standard rate-hike logic.
The 2026 Inflation Backdrop and What It Means
The mid-2026 inflation picture complicates any simple rate-hike-equals-bearish-gold calculus. May's headline Producer Price Index registered +1.1% on a monthly basis, which if annualised implies a rate of approximately +13.2%. The Federal Reserve's stated annualised inflation target remains +2.0%. This is not a marginal miss; it represents an inflation rate running at more than six times the central bank's target.
The three macro scenarios most relevant to gold's valuation trajectory are:
- Aggressive Fed tightening with inflation falling: Real yields rise sharply, opportunity cost increases, and gold's debasement fair value anchor drifts lower. Near-term bearish.
- Fed tightens but inflation remains elevated: Nominal yields rise, but real yields stay suppressed. Historical precedent from 2004 to 2006 suggests gold can advance in this environment. Medium-term constructive.
- Fed pauses amid geopolitical uncertainty: Real yields stay low or negative, debasement dynamics continue. Gold's premium above fair value compresses only modestly. Neutral to bullish.
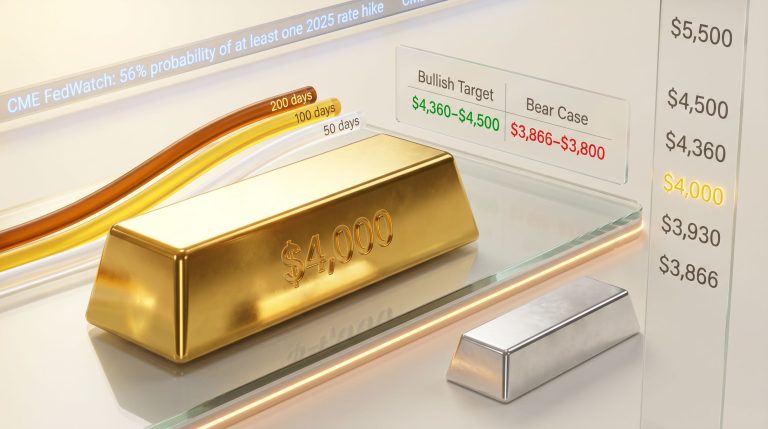
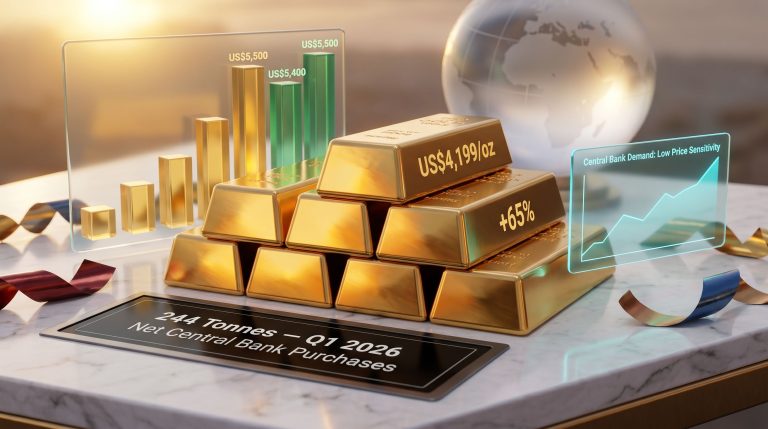
The Federal Open Market Committee's policy decision timing adds further complexity. With the May PPI data already rolling in hot, and the Fed's preferred Personal Consumption Expenditures index for May not scheduled for release until after the June FOMC meeting, the committee is navigating a period of deliberate data asymmetry. Furthermore, central bank demand continues to act as a structural underpinning even as near-term policy uncertainty clouds the outlook.
Technical Structure: What Indicators Are Telling Traders
The Weekly Parabolic Trend and What It Would Take to Flip Bullish
Gold's weekly parabolic trend indicator had registered 13 consecutive bearish signals as of mid-June 2026, with the most recent weekly price bar also posting the lowest weekly close year-to-date. The structural support zone between $4,584 and $4,284, previously considered a meaningful floor, had been violated for the second time during this correction phase.
To flip the weekly parabolic trend back to a bullish configuration, gold would need to reclaim $4,988/oz, approximately $748 above the mid-June spot price of $4,240. That represents a required recovery of roughly +17.6% from current levels before the longer-term trend signal turns constructive.
The Baby Blue Indicator: Watching for the Inflection
The 21-day linear regression trend consistency measure, sometimes referred to informally as the "Baby Blue" indicator within technical analytical circles, tracks how consistently an asset's price adheres to its short-term directional trend. When this consistency metric approaches the -80% threshold, historical patterns suggest the bearish momentum is becoming exhausted.
As of mid-June 2026, this indicator had deteriorated into deeply negative territory for both gold and silver simultaneously. The analytical significance lies in what happens next: if the trend consistency metric reverses course from near the -80% zone, it has historically preceded a directional price shift in the opposite direction. Traders following this signal were watching closely for any sign of a bottoming inflection.
Gold's Full Price Level Map: June 2026
| Category | Price Level | Context |
|---|---|---|
| All-Time Intraday High | $5,586 | January 29, 2026 |
| All-Time Closing High | $5,411 | January 28, 2026 |
| Parabolic Long Flip Level | $4,988 | Required for trend reversal to bullish |
| BEGOS Market Value | $4,548 | Multi-market regression composite equilibrium |
| Volume-Weighted Average (10-session) | $4,337 | Short-term price magnet |
| Trading Resistance Levels | $4,289 / $4,318 / $4,352 / $4,490 / $4,534 / $4,560 | Market Profile resistance clusters |
| Spot Price (mid-June) | ~$4,240 | With expected daily trading range of ~118 points |
| Volume Support Levels | $4,212 / $4,145 / $4,101 | 10-day market profile volume clusters |
| 300-Day Moving Average | $4,070 (rising) | Long-term trend support, still rising |
| 2026 Year-to-Date Low | $4,046 | Posted mid-June 2026 |
| Dollar Debasement Fair Value | $3,949 | Model anchor, mid-June 2026 |
A sustained break below $4,101 would remove the near-term volume support cushion and expose gold directly to a test of the debasement model fair value near $3,949.
Silver's Parallel Technical Structure
Silver's technical condition in mid-June 2026 mirrored gold's deterioration. The 21-day linear regression trend had also moved into deeply negative territory alongside the yellow metal. Volume profile analysis identified the $67/oz zone as the primary support cluster for silver, with a confirmed break below that level opening downside exposure toward the $64/oz range.
The gold-silver ratio, a widely tracked relative valuation metric used to assess whether silver is offering a discount or premium to gold at any given cyclical stage, remained an important secondary reference point for precious metals investors trying to gauge relative positioning across both metals during the correction.
The next major ASX story will hit our subscribers first
The S&P 500 Valuation Parallel and Its Gold Implications
Equity Overvaluation as a Safe-Haven Demand Driver
As of mid-June 2026, the S&P 500 was trading at a price-to-earnings ratio of approximately 47.6x, a level that most valuation frameworks would classify as significantly stretched. For context, the historical average P/E for the broad index has typically ranged between 15x and 25x across full market cycles.
The S&P 500's 21-day linear regression trend had also rotated negative for the first time since April 10, 2026, reinforcing a corrective market structure in equities. The Economic Barometer, which tracks incoming U.S. economic metrics period-over-period, showed 5 of 10 incoming data points deteriorating in the most recent weekly read, even as the University of Michigan Consumer Sentiment survey for June posted its strongest monthly reading in a year.
When equity markets enter correction phases from historically elevated valuations, gold's role as a portfolio diversifier and store of value has historically attracted increased institutional reallocation. That dynamic could provide a demand-side floor beneath gold's technical support levels, even as the metal's own near-term trend structure remains bearish. Consequently, understanding gold and bond dynamics during equity stress periods adds another layer to this analysis.
Both gold and the S&P 500 are simultaneously engaged in mean reversion processes as of mid-2026. Gold is reverting toward its debasement model fair value from above. The S&P is confronting the gravity of a 47.6x earnings multiple that has historically had limited capacity to sustain itself. The divergence between equity valuations and the deteriorating Economic Barometer readings creates a macro environment where gold's relative value proposition strengthens even as its absolute price undergoes correction.
FAQ: Gold Return to Fair Value Explained
What does a gold return to fair value actually mean for investors?
A gold return to fair value describes the price gravitating back toward a modelled equilibrium level after trading at a sustained premium or discount. The specific target varies by model: the debasement-anchored framework places fair value near $3,949/oz as of mid-June 2026, while the BEGOS multi-market composite implies equilibrium near $4,548/oz. A full mean reversion to the debasement anchor from mid-June spot prices would represent a further decline of roughly -6.9%. Analysts at the World Gold Council have explored similar multi-model approaches to gold valuation in depth.
Does the current correction signal a long-term trend change for gold?
Not necessarily. A correction toward modelled fair value is a function of mean reversion mechanics, not a structural reversal of gold's long-term trajectory. The 300-day moving average at $4,070 remains in a rising configuration, which indicates the underlying long-term trend is still intact despite the near-term corrective structure.
What are the key signals that would indicate the correction is ending?
Investors and traders monitoring this correction should watch for:
- The 21-day linear regression trend consistency indicator reversing from near the -80% zone
- Gold reclaiming $4,988/oz to flip the weekly parabolic trend back to bullish
- Sustained price action above the $4,212 to $4,101 volume support cluster
- A narrowing of the spread between spot price and the BEGOS Market Value of $4,548
Is gold cheap or expensive right now by different measures?
The honest answer is: it depends entirely on the framework applied. As Investopedia notes, multiple forces drive gold pricing simultaneously, which is why no single measure captures the full picture.
- Inflation-adjusted history: Gold appears elevated above its real purchasing power average
- M2 money supply metrics: Gold sits in mid-range historical territory, not at an extreme
- Dollar debasement model: Gold is modestly above fair value by approximately +7.4% from mid-June spot
- BEGOS multi-market regression: Gold is actually below its implied equilibrium by approximately -6.8%
Disclaimer: This article is for informational and educational purposes only and does not constitute financial or investment advice. All price levels, model outputs, and scenario projections reflect analysis available as of mid-June 2026. Past performance and historical analogies are not guarantees of future results. Readers should conduct their own due diligence and consult a qualified financial adviser before making any investment decisions.
Want to Be First When the Next Major Mineral Discovery Hits the ASX?
Discovery Alert's proprietary Discovery IQ model scans ASX announcements in real time, instantly identifying high-potential mineral discoveries across more than 30 commodities and converting complex data into clear, actionable insights — visit the Discovery Alert discoveries page to see the historic returns major discoveries have delivered, and begin your 14-day free trial to position yourself ahead of the broader market.