June 21, 2026
Why Most Investors Never See Gold's Most Powerful Price Waves Coming
Most market participants approach gold through the lens of interest rates, dollar strength, or geopolitical headlines. These are legitimate drivers, but they tell an incomplete story. Beneath the surface of gold's seemingly erratic price swings lies something far more structured: gold's secret cycle, a hierarchy of repeating, time-based wave patterns that cycle analysts have studied for decades. Understanding this architecture does not require abandoning fundamental analysis. It requires adding a layer of temporal awareness that most conventional investors simply never develop.
This analytical tradition traces directly to the work of J.M. Hurst, whose landmark publication Profit Magic of Stock Transaction Timing introduced the financial world to the concept of nested market cycles. Hurst demonstrated that price movements are not random walks but composite waveforms produced by the interaction of multiple overlapping periodicities. That insight, first applied to equity markets, has since been refined and applied extensively to commodities, most notably to gold. The methodology relies on spectral decomposition of historical price data to isolate dominant cycle lengths, track their phase positions, and project forward turning points with probabilistic precision.
What makes gold's current cycle configuration particularly significant is not the presence of any single wave, but the simultaneous alignment of three dominant intermediate-term cycles all pressing downward at once. This is the structural context behind gold's recent corrective phase, and it is precisely this configuration that historically precedes the metal's most powerful multi-month advances.
When big ASX news breaks, our subscribers know first
The Three-Layer Cycle Architecture Governing Gold's Intermediate Trend
Gold's intermediate price behaviour is governed by three interlocking cycles, each operating across a different time horizon. These waves do not function independently. They nest within one another, and their interactions determine both the depth of corrections and the magnitude of subsequent rallies. Furthermore, understanding gold price drivers alongside these cycle structures provides a more complete analytical picture.
| Cycle | Approximate Duration | Primary Function | Typical Upward Phase |
|---|---|---|---|
| 34-day wave | ~34 trading days | Short-term directional bias | 3-8% |
| 72-day wave | ~72 trading days | Mid-term correction and rally timing | 8-15% |
| 154-day wave | ~154 trading days | Major intermediate trend driver | 20-25%+ |
The 34-day cycle is the most frequently discussed because it generates the clearest near-term directional signals. When this wave turns bearish, it tends to produce sharp, fast corrections that retail investors often misread as the beginning of a structural breakdown. In mid-May 2026, a breach below a key price reversal threshold confirmed this cycle had turned south, and the ensuing weakness extended approximately 470 points before a temporary trough formed on June 11, 2026. By late June 2026, this cycle had reached 34 trading days in duration, placing it squarely within normal bottoming range.
However, the 34-day wave is not operating in isolation. Both the 72-day and 154-day cycles are simultaneously in their descending phases, creating what cycle analysts refer to as a stacking effect. When the smallest cycle in a nested hierarchy is being suppressed by two larger descending waves above it, that smaller wave characteristically extends toward the rear boundary of its normal timing range before reversing. This means the correction tends to run deeper and longer than investors anticipate based on short-term analysis alone.
A multi-cycle stacking configuration is one of the most misread conditions in technical analysis. Investors who identify a short-term oversold reading and jump in prematurely often face further losses before the genuine reversal materialises, because they have not accounted for the larger waves still pressing downward above them.
The 72-Day Cycle: Measuring Mid-Term Correction Depth Through Detrend Analysis
The 72-day wave represents gold's intermediate-term rhythmic structure, governing price swings that typically unfold across approximately 14 calendar weeks. This cycle is tracked using a detrended price oscillator, a mathematical technique that removes the underlying trend from raw price data to isolate the pure cyclical component beneath it.
Detrend analysis is not commonly understood outside specialist cycle research communities, but its practical utility is substantial. By stripping away the directional trend, the oscillator reveals whether a given cycle is in its ascending or descending phase independently of whether gold is in a broader bull or bear market. This allows analysts to assess cycle phase positions with far greater clarity than standard price charts provide.
Based on the current phase position of the 72-day cycle detrend, this wave was projected to continue pressing lower into early July 2026 before reaching its trough. Until that trough forms, the analytical baseline remains that additional price weakness is probable. The 72-day cycle's bottoming window also functions as the primary timing target for positioning ahead of what is expected to be a significant multi-month reversal.
Why the 72-day trough matters for gold investors:
- It defines the timing window within which mid-term reversals most commonly originate
- When the 72-day wave finally exhausts its downward phase, it typically produces sharp, sustained upward momentum
- Its confluence with the 154-day cycle creates a compounded reversal signal of considerably greater magnitude than either wave alone would generate
- Detrend readings approaching extreme levels historically coincide with strong buying opportunities in gold
Gold's Secret Cycle: The 154-Day Wave Resurfaces as the Primary Driver
Of the three dominant intermediate cycles in gold, the 154-day wave is the least understood and, arguably, the most consequential. It earns the label of gold's secret cycle not because it is concealed, but because it periodically loses its position of dominance within the cycle hierarchy, fading into the background during certain market regimes before re-emerging as the primary engine of major price advances.
This dynamic is itself an underappreciated feature of cycle analysis. Cycles do not operate with fixed influence across all market conditions. Structural shifts in demand, regime changes in monetary policy, or extended periods of price consolidation can suppress a given wave's influence, causing it to become temporarily invisible to analysts who observe only recent price history. The 154-day cycle's re-emergence as a dominant force in gold is, consequently, analytically significant beyond what any single cycle position would normally imply. For a broader perspective, gold cycles in historical bull markets provide important context for understanding why these re-emergence events matter so much.
Profile of the 154-day gold cycle:
| Attribute | Detail |
|---|---|
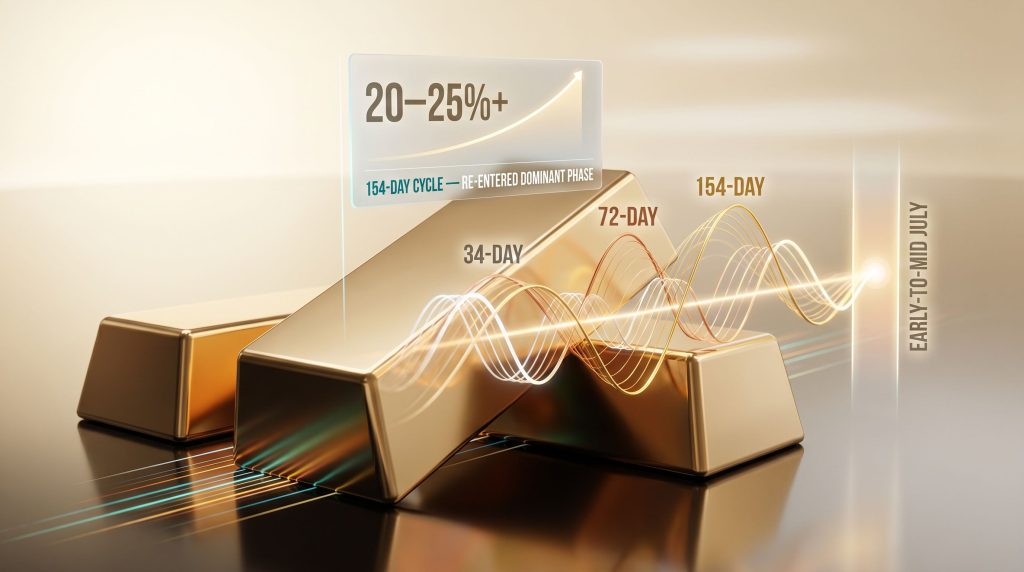
| Approximate duration | ~154 trading days trough-to-trough |
| Current status | Re-entered dominant phase |
| Historical upward phase magnitude | 20-25%+ average price advance |
| Projected trough confluence | Aligns with 72-day cycle bottom |
| Anticipated reversal window | Early-to-mid July 2026 |
The historical upward phases associated with this cycle are not marginal bounces. A 20 to 25 percent or greater advance from a mid-term trough represents the kind of sustained, multi-month repositioning that fundamentally changes gold's price level. For investors who enter near cycle lows with confirmation signals in place, these phases have historically represented among the most rewarding positioning opportunities available in the precious metals market.
When the 154-day cycle transitions from its descending phase into an ascending one, it does not simply reverse direction gradually. The historical pattern suggests the early stages of the upward phase are often the most powerful, particularly when the transition coincides with the simultaneous bottoming of the 72-day wave.
The projected trough for the 154-day cycle converges with the 72-day wave's anticipated bottoming window in the early-to-mid July 2026 timeframe. This confluence, if it materialises as projected, would represent the kind of multi-cycle low that historically generates the most powerful and durable subsequent rallies in gold.
Cycle Confluence and the Science of Compounded Reversal Signals
Cycle confluence is the term used to describe the condition where two or more cycles of differing magnitudes reach their trough simultaneously. This matters because each descending cycle represents a distinct source of selling pressure. When multiple sources exhaust themselves at the same point in time, the resulting reversal tends to be sharper and more sustained than any single-cycle bottom would produce.
In the current configuration, the potential simultaneous bottoming of the 72-day and 154-day cycles creates a compounded reversal signal of considerable analytical weight. Add to this the 34-day wave completing its own downward phase within the same general window, and the conditions for a powerful multi-cycle low begin to take shape. In addition, the gold market outlook for 2025 reinforces why these confluence events attract such significant investor attention.
Key principles of cycle confluence analysis:
- Each cycle reaching its trough represents the exhaustion of one layer of downward pressure
- When two or more cycles bottom together, the combined exhaustion typically generates stronger upward momentum than any single reversal
- The larger the cycles involved in the confluence, the more sustained the ensuing rally tends to be
- Confluence windows are probabilistic, not deterministic, and require technical confirmation before being treated as confirmed turning points
The Gold Timing Index: How Sentiment-Momentum Divergence Confirms Major Turns
Cycle analysis reaches its highest practical utility when combined with independent technical confirmation tools. In the gold market, one of the most effective confirmation mechanisms is a composite sentiment-momentum indicator, sometimes called a Gold Timing Index, which blends price momentum readings across multiple timeframes with market sentiment data.
This type of indicator does not simply track whether gold is rising or falling. It measures the rate and quality of those moves, identifying conditions where price action and underlying momentum are diverging, which historically signals that a turn is approaching.
How divergence confirmation works in practice:
- Gold price registers a new cyclical low, and the composite indicator simultaneously makes a new low, confirming the downtrend remains intact
- Gold price registers another new low, but the composite indicator fails to confirm, instead making a higher reading than the previous low
- This positive divergence signals that selling pressure is exhausting itself even as price makes marginal new lows
- The divergence confirmation is treated as the strongest available signal that a mid-term bottom is forming
- A subsequent breach of a key upside reversal price level confirms the cycle has turned and a new advancing phase has begun
Premature identification of divergence, before it is genuinely established, is one of the most common and costly errors in cycle-based trading. The discipline required is to wait for clear non-confirmation of price lows by the indicator, not simply a single session of relative stability.
A particularly instructive reference point is the late-January 2026 peak in gold. At that time, the composite indicator entered what analysts describe as a blow-off condition, where extreme momentum readings diverged negatively from price action. Price was making new highs while the underlying indicator deteriorated, a classic bearish divergence. That signal correctly foreshadowed the significant correction that has since unfolded.
As of late June 2026, the most recent new price low in gold was accompanied by a corresponding new low in the composite indicator, a negative signal indicating the divergence that would confirm a bottom has not yet formed. The analytical stance therefore remains that lower price lows are probable before the reversal takes hold.
The next major ASX story will hit our subscribers first
Cycle Analysis and Macro Fundamentals: Complementary, Not Competing
A common question from investors encountering cycle-based gold analysis for the first time is whether it contradicts or competes with fundamental macro frameworks. In practice, the two approaches address different dimensions of the same market and are most powerful when used together. However, central bank gold demand represents one macro force that consistently interacts with and amplifies cycle-driven moves.
| Analytical Framework | Primary Driver | Optimal Time Horizon |
|---|---|---|
| Cycle Analysis | Recurring time-based wave structures | Weeks to months |
| Macro Fundamental | Real interest rates, central bank policy | Months to years |
| Sentiment Analysis | Positioning, fear metrics, options flow | Days to weeks |
| Technical Price Action | Support, resistance, momentum signals | Days to weeks |
Macro conditions do not override cycle timing, but they do influence the magnitude of cycle-driven advances. Research across multiple gold bull cycles consistently identifies the following macro environments as historically associated with the strongest upward phases following mid-term lows:
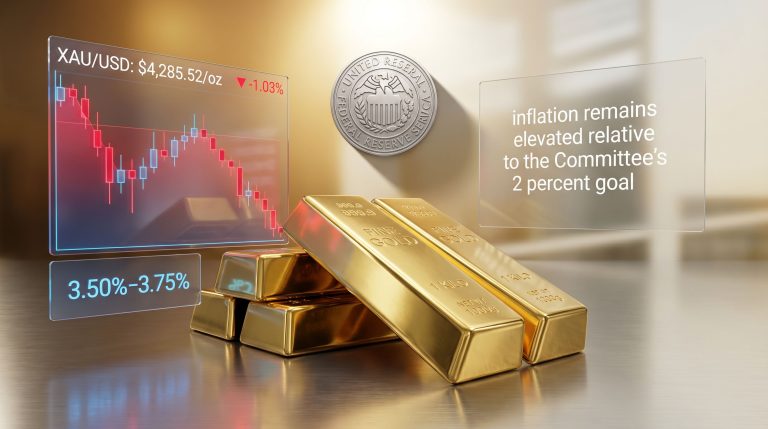
- Negative or declining real interest rates, where nominal rates fall below the prevailing inflation rate
- Federal Reserve policy pivots toward easing or extended pauses in tightening cycles
- Broad U.S. dollar weakness against major global currencies
- Elevated geopolitical uncertainty or financial system stress events
- Sustained central bank gold accumulation, particularly from emerging market reserve managers diversifying away from dollar-denominated assets
When a 154-day cycle upward phase coincides with supportive macro conditions in two or more of these categories, the resulting advance has historically exceeded the average 20-25% range. Conversely, macro headwinds can moderate cycle-driven advances without eliminating them, as the cyclical pressure itself does not disappear simply because the macro backdrop is less accommodating.
Key Signals and Timing Windows to Monitor Through Mid-2026
For investors tracking gold's current cycle configuration, the following checklist represents the sequence of confirmations that would validate a major mid-term low is forming:
- Gold price stabilises and holds above a clearly defined upside price reversal threshold
- The composite sentiment-momentum indicator produces a confirmed positive divergence (higher low in the indicator while price makes a lower low)
- The 34-day cycle transitions from its descending phase into an ascending configuration
- Volume and price momentum patterns indicate buying absorption at cyclical lows rather than continued distribution
- The 72-day detrend oscillator reaches extreme oversold territory consistent with prior mid-term trough formations
Until these signals appear in sequence, the analytical default position is that the corrective phase remains incomplete. The early-to-mid July 2026 window represents the highest-probability timing zone for this sequence to begin, based on the current phase positions of both the 72-day and 154-day cycles. Furthermore, the gold price forecast for 2025 and beyond provides additional context for understanding what may follow once these signals confirm.
What History Tells Us About Multi-Cycle Lows in Gold
Are Multi-Cycle Confluence Lows Rare Events?
Multi-cycle confluence lows in gold are relatively rare events precisely because they require the simultaneous phase alignment of waves operating across significantly different time horizons. When they do occur, the historical record is instructive. For instance, gold-silver ratio analysis during prior confluence lows has often provided an additional confirming signal that precious metals broadly were approaching a major inflection point.
Prior instances where the 72-day and 154-day waves bottomed in close proximity produced some of gold's most memorable sustained rallies. The pattern is consistent: a final, often emotionally exhausting phase of weakness that convinces the majority of short-term participants that the metal is broken, followed by an abrupt and powerful reversal that leaves latecomers scrambling to establish positions at much higher levels.
Why Does Pessimism Peak at Cycle Troughs?
This psychological dynamic is itself a feature of cycle behaviour rather than a coincidence. Cycle troughs are frequently accompanied by maximum pessimism in the market narrative precisely because the corrective phase has been deep enough and prolonged enough to erode bullish conviction. The divergence signal in the composite indicator is, at its core, a measurement of this pessimism exhaustion, capturing the moment when selling pressure can no longer sustain new price lows even as the bearish narrative remains dominant.
For long-term gold investors, recognising these multi-cycle confluence windows as historically significant accumulation opportunities requires a specific kind of discipline. Trusting a systematic framework over emotional responses to price action, and waiting for quantitative confirmation before acting rather than reacting to market sentiment alone, remains the hallmark of investors who successfully navigate gold's secret cycle. Moreover, Ainslie Bullion's research on gold's 8-year cycles suggests that the longer-term structural forces underpinning these moves may be even more significant than intermediate-term analysis alone can capture.
Disclaimer: This article is intended for informational and educational purposes only. Cycle analysis is a probabilistic forecasting methodology and does not guarantee future price outcomes. Gold prices are subject to a wide range of variables including but not limited to macroeconomic conditions, central bank policy, geopolitical events, and market liquidity. Nothing in this article constitutes financial advice. Readers should conduct their own research and consult a qualified financial professional before making any investment decisions.
Want to Know When the Next Major Gold Discovery Hits the ASX?
While cycle analysis can help time gold's price waves, Discovery Alert's proprietary Discovery IQ model delivers real-time alerts the moment significant ASX mineral discoveries are announced — instantly translating complex data across 30+ commodities into actionable insights for both short-term traders and long-term investors. Explore historic discovery returns on Discovery Alert's discoveries page and begin your 14-day free trial to position yourself ahead of the broader market.