
August 6, 2026
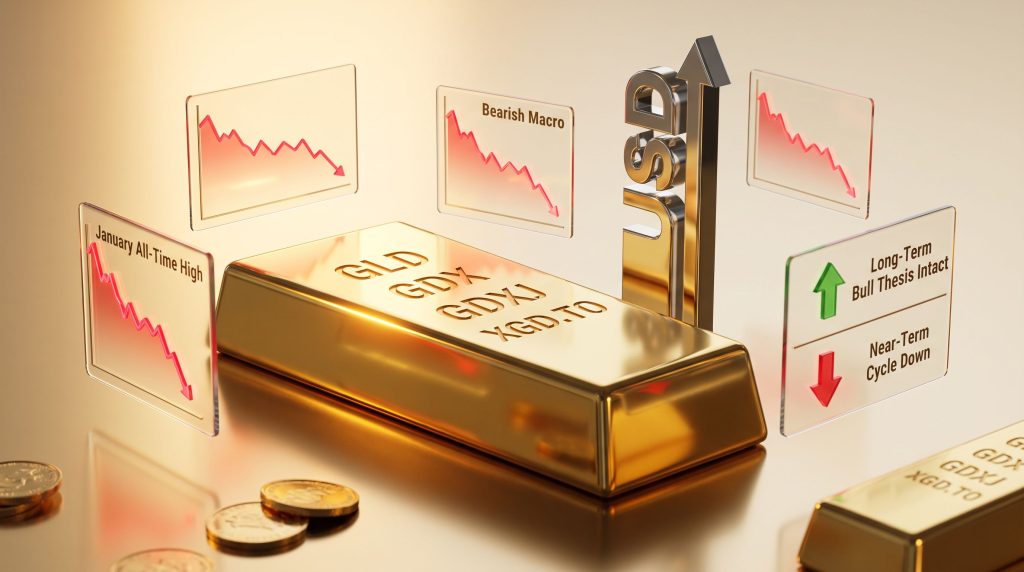
When Cycle Signals Diverge From Price: Understanding the Gold Sector Cycle Down
Precious metals markets have a long history of confounding investors who rely solely on price action to guide their decisions. Gold can drift sideways for months, then collapse sharply, then recover violently, all while the underlying cycle dynamics quietly shift beneath the surface. For investors who lack a timing framework, these movements feel random. For those who study market cycles, they follow a recognisable rhythm that, while imperfect, offers a meaningful edge in positioning and risk management.
The current environment is a case study in exactly this kind of complexity. The gold sector cycle is down, yet short-term buy signals are simultaneously appearing across major gold instruments. Understanding why these two conditions can coexist, and what each one means for different types of market participants, is the key challenge facing precious metals investors right now.
When big ASX news breaks, our subscribers know first
What Proprietary Cycle Indicators Actually Measure
Most retail investors track gold price charts and draw conclusions based on recent momentum. Proprietary cycle indicators operate on a fundamentally different logic. Rather than measuring where price has been, they assess the phase of a recurring market rhythm, identifying whether the prevailing environment structurally favours buyers or sellers over a defined time horizon.
This distinction matters enormously. A cycle down designation does not mean gold is about to collapse, nor does it represent a forecast. It signals that the dominant directional bias, as measured by the underlying timing model, favours the sell side over the near-to-medium term. The model is designed to filter noise, smooth volatility spikes, and provide a structural context that pure price analysis cannot offer.
Two categories of market participants interpret these signals very differently:
- Long-term accumulators use cycle phases to time their entry points, building positions during down cycles when valuations are compressed and sentiment is bearish.
- Active traders use cycle bottoms as entry triggers and cycle tops as exit points, capturing short-term price movements within the broader directional bias.
Neither approach is universally superior. What matters is alignment between the signal type, the time horizon, and the investor's risk tolerance. Furthermore, understanding the broader gold market outlook helps investors contextualise where cycle signals sit within a longer structural picture.
The Anatomy of a Gold Sector Down Phase
How Major Gold Instruments Behave When the Cycle Turns Bearish
During confirmed gold sector cycle down phases, the behaviour of gold-related instruments tends to follow a recognisable pattern, though with meaningful variation depending on the instrument's underlying exposure and leverage to spot gold prices.
| Instrument | Signal Type | Macro Cycle Status | Typical Down-Phase Behaviour |
|---|---|---|---|
| GLD (Gold ETF) | Short-term buy | Bearish macro | Tactical bounces against primary trend |
| GDX (Gold Miners ETF) | Short-term buy | Bearish macro | Amplified volatility versus spot gold |
| GDXJ (Junior Miners ETF) | Short-term buy | Bearish macro | Highest beta exposure, deepest drawdowns |
| XGD.TO (TSX Gold Index) | Short-term buy | Bearish macro | Canadian miner exposure with currency overlay |
A critical point worth emphasising: the appearance of short-term buy signals across GLD, GDX, GDXJ, and XGD.TO within a confirmed macro down cycle is not a contradiction. These represent tactical counter-trend windows — brief periods where oversold conditions create short-lived upward pressure — rather than signals that the primary bearish cycle has reversed.
Short-term buy signals inside a macro down cycle are best understood as tactical breathing room within a broader bearish trend, not evidence of a new uptrend forming.
Volatility can and does temporarily override cycle direction. This is one reason why cycle-based models periodically generate short-term whipsaws, particularly in environments where macro uncertainty is elevated. However, the model's value lies not in eliminating these false starts but in maintaining a clear directional bias that traders and investors can anchor their decisions to.
The Role of Beta in Gold Equity Down Cycles
One aspect of gold sector cycle downs that is frequently underappreciated by retail investors is the leveraged response of gold equities relative to the underlying metal. Gold miners, particularly junior explorers and developers, carry operational leverage to the gold price. When spot gold falls, a miner's profit margin can compress disproportionately because fixed costs remain constant.
This dynamic means that during a gold sector cycle down phase, the gold price and mining equities tend to diverge sharply in terms of drawdown severity:
- Junior miners (GDXJ exposure) typically suffer the deepest drawdowns of any gold-related instrument.
- Senior producers (GDX exposure) experience significant volatility but tend to be partially buffered by larger balance sheets and hedging programmes.
- Physical gold ETFs (GLD) move closest to spot gold, making them the most predictable instrument for cycle-based positioning.
What Is Driving the Current Gold Sector Cycle Down
USD Strength as the Primary Structural Headwind
Gold is denominated in US dollars, which creates a mechanical inverse relationship between the two assets. When the USD trend turns upward, it exerts consistent downward pressure on gold prices, often regardless of other fundamental factors. The current cycle analysis confirms that the trend is up for the USD and down for both gold and gold equities simultaneously — a combination that historically produces extended periods of cycle compression in precious metals.
This is not simply a matter of correlation. The mechanism works as follows:
- A strengthening USD makes gold more expensive in foreign currency terms, reducing demand from international buyers.
- Dollar strength typically accompanies tighter monetary conditions or improved risk appetite, both of which reduce the safe-haven premium embedded in gold prices.
- Leveraged speculators in gold futures tend to reduce long exposure as the USD trend strengthens, amplifying downward price pressure.
Real interest rates layer an additional dimension onto this dynamic. When nominal rates rise faster than inflation expectations, the opportunity cost of holding gold — which pays no yield — increases. This creates a compounding effect where USD strength and real rate pressure reinforce each other, deepening the bearish cycle conditions across the gold sector. In addition, central bank gold demand can partially offset these headwinds, though its influence tends to be more structural than cyclical.
Speculation at Bear Market Valuation Territory
Current analysis shows that speculative positioning in gold has reached what cycle frameworks describe as bear market value territory. This is a sentiment-based valuation condition where speculative interest has de-risked to historically low levels, reflecting genuine fear and pessimism rather than opportunistic positioning.
This condition carries a dual interpretation:
- In the near term, bear market value territory can persist or deepen as negative momentum attracts further selling.
- Over a longer horizon, this level of pessimism has historically corresponded to periods of attractive accumulation value, particularly for investors with multi-year time horizons.
Ratio analysis across gold-related instruments is simultaneously registering sell signals, which cycle technicians treat as a confirmation tool. Consequently, when these ratio signals align with the primary cycle direction and USD trend, the weight of evidence points toward continued near-term downside pressure. Monitoring the gold-silver ratio analysis provides an additional layer of confirmation when assessing the depth of a bearish cycle phase.
Another technically significant development is the conversion of former major resistance into major support. In technical cycle analysis, when a price level that previously capped rallies begins acting as a floor during declines, it signals a structural shift in market participation. Whether this support level holds during the current down phase will be a critical test of the broader cycle framework.
Is This a Mid-Cycle Correction or Extended Deterioration?
The Case for a Corrective Pullback Within a Longer Bull Market
Not all analysts interpret the current gold sector cycle down as a harbinger of prolonged weakness. A credible alternative reading argues that this phase represents a healthy correction within a multi-year structural bull market for gold. This thesis draws on several historical precedents:
- Gold's last major secular bull market (2001 to 2011) included multiple down cycles lasting several months without invalidating the broader uptrend.
- Central bank gold buying, which has been running at historically elevated levels in recent years, provides a structural demand floor that pure price cycles do not fully capture.
- Geopolitical de-dollarisation trends among emerging market central banks represent a longer-term structural tailwind for gold that operates independently of short-term cycle signals.
For this thesis to hold, certain structural indicators would need to remain intact: key long-term moving averages must hold as support, the USD uptrend must eventually exhaust itself, and central bank demand must continue at elevated rates. According to Morningstar's recent market analysis, many investors are grappling with exactly this question of whether the gold opportunity has already passed or whether the current down phase is simply the next entry point.
The Bear Case: Compounding Pressure Across Multiple Frameworks
The more cautious interpretation notes that bearish signals have registered across multiple consecutive quarterly cycle updates, suggesting this is not a brief noise event but a sustained directional shift. When USD strength, real rate pressure, declining speculative positioning, and negative ratio signals converge simultaneously, the probability of an extended down phase increases materially.
Analysts are currently divided between the mid-cycle correction thesis and an extended bearish scenario. Both interpretations carry merit depending on the investor's time horizon, and neither should be dismissed without careful consideration of the supporting evidence.
Strategic Positioning: Traders Versus Long-Term Investors
How Long-Term Investors Should Approach Gold Sector Cycle Down Periods
History suggests that investors who maintain discipline during cycle down phases and continue accumulating quality positions at compressed valuations tend to generate superior long-term outcomes compared to those who exit and attempt to re-enter at the bottom. Key principles for long-term investors navigating a gold sector cycle down include:
- Position sizing discipline: Scaling into positions gradually rather than deploying full capital at once protects against further downside.
- Quality focus: Gold producers with low all-in sustaining costs (AISC) historically outperform smaller, higher-cost operators during cycle compression, as their margins remain positive even at lower gold prices.
- Patience over reaction: Responding to every short-term signal within a macro down cycle increases trading costs and emotional decision-making errors.
Active Trader Positioning During a Confirmed Down Cycle
For traders, the current environment demands strict discipline. Short-term buy signals in GLD, GDX, GDXJ, and XGD.TO offer tactical entry opportunities, but these must be treated as counter-trend trades within a bearish macro structure, not as confirmation of a trend reversal.
Practical trader considerations include:
- Define entry and exit levels clearly before entering any position, with stop-losses placed at technically meaningful levels.
- Respect the primary cycle direction by keeping position sizes smaller than in confirmed up-cycle environments.
- Treat cash as a legitimate and active position when risk-reward does not favour entry, rather than forcing trades for the sake of activity.
Understanding the broader gold stock market relationship through secular cycles also helps active traders frame their counter-trend trades within a sensible macro context.
What Would Signal a Cycle Reversal?
Investors monitoring the gold sector for signs of a cycle transition from down to up should watch for:
- A confirmed reversal in the USD trend from upward to downward.
- Speculative positioning rebuilding from bear market value territory toward neutral or bullish levels.
- Cycle indicator confirmation shifting from down to up across multiple consecutive update periods.
- Ratio signals on gold-related instruments transitioning from sell to buy.
For broader context on how these transitions have historically unfolded, Canadian Mining Report's coverage of the gold slump offers useful comparative perspective on how prolonged down phases have resolved in prior cycles.
The next major ASX story will hit our subscribers first
Implications for ASX-Listed Gold Equities
How Global Cycle Conditions Flow Through to Australian Investors
Australian investors in ASX-listed gold producers face a layered version of the global gold cycle dynamic. The AUD/USD exchange rate introduces a partial buffer or amplifier depending on its direction. When the Australian dollar weakens against the USD simultaneously with gold price declines, Australian producers' revenues in AUD terms are partially protected because they sell gold in USD but report costs in AUD.
However, when USD strength drives both gold price weakness and AUD strength, the cushion disappears and ASX gold producers experience the full force of the global down cycle.
During bearish cycle phases, broader sector impacts tend to include:
- Tighter capital raising conditions, as investor appetite for gold equity placements contracts with sector sentiment.
- Reduced exploration budgets, as junior companies preserve cash during periods when equity markets are unreceptive.
- Valuation compression across the board, with smaller producers and explorers typically suffering more severe re-ratings than major producers with proven cash flow.
Producers with low AISC, strong balance sheets, and production visibility tend to hold their valuations relatively better during down cycles, making quality differentiation critically important for ASX gold investors in the current environment.
FAQ: Gold Sector Cycle Down Explained
What does a gold sector cycle down designation mean?
It indicates that a timing-based analytical framework has identified a near-term bearish directional bias across gold and gold equity markets. It does not constitute a price forecast or a guarantee of further losses.
Can short-term buy signals appear during a macro down cycle?
Yes. These represent tactical counter-trend opportunities within the broader bearish structure. They carry elevated risk and should be sized and managed accordingly.
How does USD strength affect gold cycle conditions?
A strengthening USD mechanically suppresses gold prices by making gold more expensive for international buyers and reducing the safe-haven premium. When USD trend and gold cycle both align bearishly, downside pressure is compounded.
How long do gold sector down cycles typically last?
Duration varies significantly based on macroeconomic conditions, monetary policy trajectory, and USD behaviour. Historical down phases have ranged from several weeks to multiple quarters.
Is the current gold down cycle the end of the gold bull market?
Analytical opinion is divided. Cycle-based models indicate continued near-term pressure, while structural analysts argue the longer-term bull thesis remains intact. Both perspectives warrant careful monitoring rather than a binary conclusion.
Disclaimer: This article is intended for informational and educational purposes only. It does not constitute financial advice. All references to cycle signals, technical indicators, and market conditions involve inherent uncertainty and should not be relied upon as the sole basis for investment decisions. Past cycle behaviour does not guarantee future outcomes. Readers should consult a qualified financial adviser before making any investment decisions.
Want to Identify ASX Gold Discovery Opportunities Before the Broader Market Does?
While navigating gold sector cycle signals requires a disciplined timing framework, Discovery Alert's proprietary Discovery IQ model delivers real-time alerts on significant ASX mineral discoveries — transforming complex data across 30+ commodities into clear, actionable insights for both traders and long-term investors. Explore how historic mineral discoveries have generated substantial returns on Discovery Alert's dedicated discoveries page, and begin your 14-day free trial today to position yourself ahead of the next major find.