
July 20, 2026
When Price Holds and Mood Collapses, the Gap Becomes the Trade
Across commodity markets, the most dangerous assumption an investor can make is that price and sentiment move in lockstep. History repeatedly demonstrates the opposite. Some of the most powerful multi-year rallies in gold began not from a position of euphoria, but from conditions where bearishness had become so entrenched that virtually no incremental selling pressure remained. The market had, in effect, already priced in every piece of bad news available.
That dynamic is precisely what serious resource investors are examining right now. The gold sentiment collapse opportunity has emerged as a central theme for disciplined investors, with the gold price remaining essentially unchanged since October 2025, holding near the $4,000 level even as investor mood has swung from milestone excitement to what institutional observers are describing as near-record negativity. Understanding why that divergence matters, and how to position around it, is the central challenge for disciplined investors in the current cycle.
When big ASX news breaks, our subscribers know first
What Sentiment Indicators Are Actually Telling Us
Reading the Positioning Data Beyond the Price Chart
Price action and investor positioning are two distinct datasets, and conflating them is one of the most common errors in retail gold analysis. Right now, the divergence between these two measures has reached a degree of statistical significance that experienced resource allocators treat as a meaningful setup signal.
Consider the primary sentiment measurement tools currently in focus:
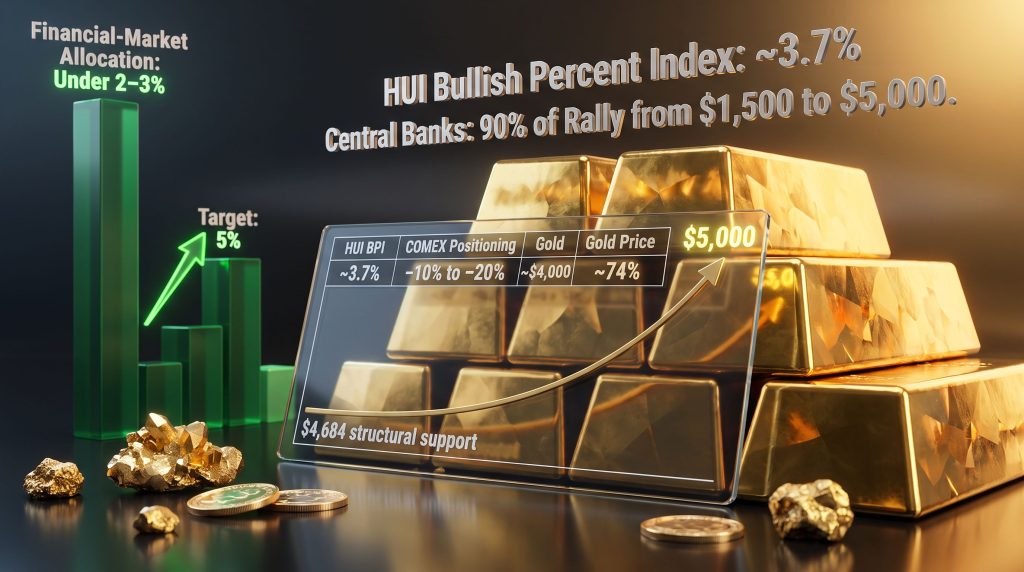
- The HUI Bullish Percent Index, which tracks the percentage of gold mining stocks generating buy signals, has fallen to approximately 3.7% — a level recorded only four times in the past decade and one that historically precedes significant rebounds rather than continued deterioration
- COMEX non-commercial futures positioning is running at minus 10% to minus 20% net speculative exposure, placing speculative money near its most bearish positioning in the historical record
- Major wealth management platforms are reporting gold allocations below 1% of total assets under management, with broad financial-market gold ownership sitting under 2–3% of total assets globally
- Approximately 74% of Wall Street analysts covering the sector had turned bearish following gold's breach of its 200-day moving average
Sentiment vs. Fundamentals: Current Readings in Context
| Indicator | Current Reading | Historical Context |
|---|---|---|
| HUI Bullish Percent Index | ~3.7% | Reached only 4 times in the past decade |
| COMEX speculative net positioning | -10% to -20% | Near-record bearish extreme |
| Financial-market gold allocation | Under 2–3% of assets | Historically low relative to central bank activity |
| Gold price vs. October 2025 | Flat near $4,000 | Price unchanged despite complete sentiment reversal |
| Wall Street analyst sentiment | ~74% bearish | Triggered by 200-day moving average breach |
A critical insight that most retail investors miss: deeply oversold 60-day oscillator readings in gold equities have historically preceded meaningful recoveries. When an asset maintains its price floor despite statistically extreme pessimism, the absence of incremental selling pressure is itself a structural signal. The market has already absorbed the available bad news. What remains to be priced in is the upside catalyst.
Furthermore, as outlined in the gold market outlook for 2025, the macro backdrop underpinning gold's longer-term trend has not materially deteriorated — only the market's mood has.
The Fiscal Arithmetic That Undermines Higher-For-Longer
Why Real Yields Pressure Gold Mechanically, Not Fundamentally
Gold has no coupon, pays no dividend, and offers no yield. This makes it mechanically sensitive to real interest rates — when the return on holding US Treasuries rises, the opportunity cost of holding gold increases proportionately. With the 10-year Treasury currently at approximately 4.6% and the 30-year approaching 5%, this mechanical relationship explains the near-term sentiment deterioration clearly enough.
What it does not explain is whether those rates are sustainable. That is the more consequential question.
The Debt Service Problem That Changes Everything
The US federal debt load stands at approximately $40 trillion. At a 5% interest rate on that total, annual interest expense approaches $2 trillion — more than double the $860 billion recorded as recently as September 2025. Layered onto an already-running structural deficit of approximately $2 trillion annually, the combined trajectory implies roughly $3 trillion in yearly deficit financing — a self-reinforcing cycle that becomes increasingly difficult to manage as the debt stock grows.
The critical analytical question is not whether rates are high — it is whether the US government can sustain them. At $2 trillion in annual interest costs stacked on a $2 trillion structural deficit, the fiscal arithmetic points toward eventual policy accommodation, regardless of what central bankers say in the near term.
Kevin Warsh, who succeeded Jerome Powell as Federal Reserve Chair in May 2026, has signalled hawkish intentions on inflation. However, Michael Gentile, strategic investor and co-founder of Bastion Asset Management, argues this posture is unlikely to be sustainable given the scale of federal debt service requirements. His view, expressed in a recent Crux Investor interview, is that the US government cannot afford prolonged high rates and that the only realistic policy paths forward are some form of yield curve control or continued monetary expansion — both of which are structurally supportive of gold over a five-to-ten-year horizon.
The single scenario that would genuinely threaten the gold thesis is a credible, multi-year shift toward US fiscal austerity with measurable deficit reduction. The following checklist outlines what would need to change:
- Genuine multi-year reduction in the US federal deficit
- Sustained real yield increases without triggering sovereign debt stress
- Collapse in central bank gold accumulation programmes globally
- Significant increase in financial-market gold allocation, removing the coiled spring dynamic
- Structural shift away from dollar reserve diversification by major sovereign holders
Most observers assign a low near-term probability to any of these conditions being met simultaneously. For additional context on how gold price movements affect broader mining equities, the relationship between fiscal policy and sector performance is explored in detail.
The Demand Architecture Most Investors Are Not Watching
Central Bank Accumulation as the Structural Price Floor
Approximately 90% of gold's rally from $1,500 to recent highs above $5,000 has been attributed to official-sector accumulation, according to Gentile's framework. Central bank holdings have grown from roughly 5–6% of global foreign exchange reserves to approximately 25% — a structural reallocation that reflects a decade-long sovereign diversification away from dollar-denominated assets.
China purchased 15 tonnes of gold in June 2026, its largest single-month acquisition in three years. Critically, this occurred during a period of price weakness — indicating that sovereign buyers are treating corrections as accumulation windows rather than exit signals. Central bank demand has consequently become one of the most reliable structural supports for gold's long-term performance.
Why Financial-Market Participation Is the Coiled Spring
Despite central bank accumulation driving gold from $1,500 to $5,000, institutional and retail investors in financial markets have barely participated. With aggregate gold ownership below 2–3% of total assets and some major platforms below 1%, the demand from mainstream financial markets has effectively not arrived yet.
The demand amplification scenario this creates is significant:
- Central bank buying provides a durable and ongoing price floor
- A reallocation of even 2–3 percentage points of global financial-market assets toward gold would represent demand multiples larger than total annual official-sector purchases
- Gold equities, with their operational leverage to gold prices, would likely reprice faster and more dramatically than the physical metal itself
If global financial-market gold allocation moves from under 2% toward a more historically normal 5%, the incremental demand would dwarf annual central bank purchases — potentially accelerating price discovery in gold equities far faster than the physical metal itself.
Correction or Reversal? Technical Levels for Context
Distinguishing a Cyclical Washout From a Trend Break
Gold's breach of its 200-day moving average and 50-day exponential moving average triggered a wave of algorithmic selling and sentiment deterioration that the data reflects clearly. The March 2026 drawdown of approximately 12% was driven primarily by liquidity deleveraging and real yield expansion — not by any change in the underlying demand structure. According to analysis of gold's record run and sharp falls, volatility of this nature is historically normal within a secular bull market. Historical drawdown analysis shows comparable corrections have consistently been followed by positive 6- and 12-month returns.
Key Technical Levels to Monitor
| Price Level | Significance |
|---|---|
| ~$5,000 | Key psychological and technical resistance/support |
| $4,859 | 38.2% Fibonacci retracement level |
| $4,684 | Broader secular trend base and structural support zone |
| ~$4,000 | October 2025 breakout level, now being tested as support |
The bear case deserves honest acknowledgement: some technical analysts flag potential for an additional 10% downside before the correction fully resets sentiment and positioning. Strong US labour market data has repeatedly delayed rate cut expectations, sustaining gold's opportunity cost in the near term. Momentum-driven selling can and does overshoot fundamental value in both directions. A staged or disciplined entry approach is therefore more appropriate than all-in positioning at current levels.
The Infrastructure Arbitrage in Junior Gold Assets
Why the Buy-Versus-Build Framework Favours Acquisitions Now
Institutional resource investors increasingly apply a buy-versus-build framework to evaluate junior gold companies. The arithmetic, in a $4,000+ gold price environment, looks like this:
- Average all-in sustaining cost for producers: approximately $2,000 per ounce
- Available margin per ounce before capital costs: approximately $2,000
- Estimated mine-build capital cost in many cases: roughly $200 per ounce
- Net acquirable margin for a major producer: approximately $1,800 per ounce
Yet junior gold companies frequently trade at $50–$100 per ounce in the ground during sentiment troughs. Recent major transactions, including Agnico Eagle's acquisition of Rupert Resources and G Mining Ventures deals, have transacted at $500–$600 per ounce — a fraction of available margin, but still representing a 5x–10x premium to where many juniors currently trade.
A major producer earning $1,800 of margin per ounce can pay $500–$600 per ounce in an acquisition and still generate exceptional returns. Junior companies trading at $50–$100 per ounce represent an extreme dislocation relative to that transaction reality — one that M&A activity or a sentiment recovery must eventually close.
What Infrastructure Proximity Adds to the Acquisition Calculus
Not all ounces in the ground are created equal. Deposits located near existing mills, established road access, and power infrastructure offer acquirers a fundamentally different risk profile compared to greenfield discoveries of similar size. The practical advantages include:
- Elimination of hundreds of millions in standalone construction capital
- Materially reduced permitting timelines and execution risk
- Greater certainty around total project cost, allowing acquirers to pay more per ounce
- Ability to truck ore to existing processing facilities, dramatically accelerating the path to cash flow
In addition, gold M&A activity in the Australian market illustrates precisely how infrastructure proximity has influenced acquisition premiums paid for junior assets in recent transactions.
Portfolio Case Studies: Applying the Framework in Practice
Three current positions held by Gentile illustrate how this framework translates into specific investment decisions:
McFarlane Lake Mining (CSE:MLM) holds approximately 4 million ounces at the Juby project near Gowganda, Ontario, situated within reach of Côté Gold, Alamos Gold's Young-Davidson mine, and Discovery Silver. Road and power infrastructure already cross the property. A specific debt overhang — $15 million (US) due in October 2026 against a roughly $50 million market capitalisation — had been suppressing the stock despite strong underlying asset quality. Gentile's capital injection, combined with in-the-money warrant exercises, brought in $6–7 million in financing and removed the immediate refinancing risk. The project carries scale potential toward 10–15 million ounces at near-one-gram grade, a combination Gentile views as capable of attracting a major acquirer without requiring the company to self-fund infrastructure.
Radisson Mining Resources (TSXV:RDS), where Gentile has held a strategic stake since 2017, has grown its O'Brien project resource from approximately 1 million ounces to 2.3 million ounces over two to three years, with successive drill programmes pointing toward a 3–4 million ounce target. Four operating mills sit within 75 kilometres of the project, meaning ore-trucking to existing infrastructure represents a near-zero standalone capital path to production. The company raised $25 million at approximately $1 per share, with the stock recently trading around $0.80–0.82 — a discount to the financing price despite continued resource expansion.
Big Ridge Gold Corp (TSXV:BRAU) holds the past-producing Hope Brook project in Newfoundland, offering a differentiated angle through jurisdictional speed. Newfoundland's comparatively streamlined permitting pathway — tied to the absence of First Nations consultation requirements on the island — represents a structural advantage for projects processing under 5,000 tonnes per day. Hope Brook carries roughly 1.5 million ounces, including 1 million ounces of open-pit material grading approximately 2 grams per tonne — a grade-size combination that is relatively rare for open-pit deposits. Gentile has increased his position from approximately 10% to close to 20% of the company following full project consolidation at what he describes as a market sentiment trough.
The next major ASX story will hit our subscribers first
The Non-Primary Silver Royalty Niche Most Investors Overlook
Why Junior Royalty Companies Face a Structural Disadvantage in Conventional Markets
The royalty market has a well-documented cost-of-capital problem for smaller operators. Established royalty majors including Franco-Nevada, Royal Gold, and Wheaton Precious Metals operate with costs of capital in the 4–5% range. Junior royalty companies, by contrast, typically trade at 3–4x net asset value, implying an effective cost of capital of 20–30%. This structural gap means junior royalty companies are permanently disadvantaged in competitive bidding for conventional royalty streams — they simply cannot match the economics available to established players.
Silver Crown Royalties and the By-Product Stream Opportunity
Silver Crown Royalties has identified a niche that sidesteps this competitive disadvantage entirely by focusing on non-primary silver production — the silver by-product streams generated by gold, copper, and base-metal operations that typically go unmeasured and unreserved by the operator.
Because these mining companies have no existing business model built around their silver credit, they do not actively market or value these streams. The practical result is that royalty originators targeting this niche face no competition from major royalty companies — the asset class is effectively invisible to conventional deal flow.
This dynamic creates several structural advantages:
- No competitive bidding against low-cost-of-capital majors
- Ability to originate royalties at attractive terms without auction dynamics
- A decade-long acquisition runway as base-metal and gold production expands globally
- Growing addressable supply as new mines reach production and generate unmeasured silver credits
Gentile notes this is his first-ever royalty investment, entered specifically because the model targets a structural gap rather than attempting to compete within an already-crowded market. The potential, if the model scales, is to build meaningful annual royalty production from a niche that most royalty investors have never examined.
A Framework for Distinguishing Opportunity From Value Trap
The Five-Factor Contrarian Checklist
Contrarian positioning requires more than simply buying what others are selling. The following framework helps distinguish a genuine sentiment-trough opportunity from a deteriorating asset:
- Sentiment at statistical extremes — Is the bearish reading historically rare, or merely elevated?
- Price holding above structural support — Has the asset broken its secular trend, or is it correcting within it?
- Fundamental demand drivers intact — Have the underlying reasons to own gold changed, or only the market's mood?
- Institutional accumulation diverging from retail sentiment — Are sophisticated buyers adding while retail investors exit?
- Catalyst visibility — Is there a plausible mechanism for sentiment recovery, or is the thesis purely time-dependent?
By each of these measures, the current gold sentiment collapse opportunity scores meaningfully positive. Contrarian approaches to junior mining success further reinforce why disciplined investors are finding this environment compelling rather than alarming.
Historical Sentiment Troughs and Subsequent Returns
| Period | Sentiment Condition | 12-Month Subsequent Gold Return | Key Catalyst |
|---|---|---|---|
| Late 2015 | Multi-year bear market low | +25% | Fed pivot expectations |
| Q4 2018 | Extreme post-rate-hike bearishness | +18% | Growth slowdown and rate pause |
| March 2020 | Liquidity crisis deleveraging | +30%+ | Monetary expansion |
| Current (2026) | HUI BPI at 3.7%, COMEX net short | TBD | Fiscal constraint and policy pivot |
Past performance does not guarantee future results. Historical comparisons are provided for analytical context only and should not be construed as investment advice.
The Asymmetric Risk-Reward Profile
The current setup offers a measurably asymmetric risk profile for investors with appropriate time horizons:
- Downside scenario: Additional 10% correction to structural support around $4,684
- Upside scenario: Financial-market participation shifts from under 2% toward 5% allocation, generating demand multiples exceeding annual central bank purchases and triggering significant re-rating across gold equities
Capital-efficient exposure strategies for investors approaching the gold sentiment collapse opportunity include physical gold for reserve protection, senior producers for operational leverage, infrastructure-rich junior companies for M&A optionality, and specialised royalty vehicles targeting under-competed niches. Furthermore, analysis of whether gold's current correction is a buying opportunity in disguise suggests that the asymmetry of this setup is being recognised beyond Australian and US markets. Position sizing and staged entry remain critical given the potential for additional near-term downside before sentiment fully resets.
Frequently Asked Questions
What Causes Gold Sentiment to Collapse Even When the Price Has Not Fallen Significantly?
Sentiment and price diverge sharply when mechanical selling pressure from rising real yields, liquidity deleveraging, or technical breakdown triggers negative positioning without altering the underlying demand structure. When gold holds its price floor despite extreme bearishness, it signals that structural buyers are absorbing the supply being released by sentiment-driven sellers. This is a defining feature of the gold sentiment collapse opportunity as it currently presents.
How Oversold Is the Gold Market Compared to Historical Precedents?
The gold miners bullish percent index has reached approximately 3.7%, a level recorded only four times in the past decade. COMEX speculative positioning is running at minus 10% to minus 20%, near historic bearish extremes. Both indicators have historically preceded significant recoveries rather than continued deterioration.
Why Do Junior Gold Companies Trade So Far Below Their Acquisition Value?
Junior resource companies are subject to sentiment-driven discounting, liquidity constraints, and perceived execution risk that major producers do not face. When sentiment collapses, these discounts widen dramatically, creating the gap between $50–$100 per ounce trading prices and $500–$600 per ounce acquisition transaction prices that characterises the current environment.
What Is the Significance of Central Bank Gold Buying at Current Price Levels?
Central bank purchases at or near current prices demonstrate that sovereign buyers view the current level as attractive for long-term reserve building. China's 15-tonne purchase in June 2026, its largest monthly acquisition in three years, occurred during a period of price weakness, indicating that official-sector buyers are treating dips as accumulation opportunities.
What Would Need to Happen for the Gold Bull Thesis to Be Wrong?
The primary risk is a credible, multi-year shift toward US fiscal austerity with genuine deficit reduction that reduces the debt-service burden and allows real yields to remain elevated without triggering sovereign stress. Absent that, the fiscal arithmetic continues to point toward eventual monetary accommodation, which is structurally supportive of gold over a multi-year horizon.
Want to Identify the Next Major ASX Mineral Discovery Before the Market Moves?
Discovery Alert's proprietary Discovery IQ model delivers real-time alerts on significant ASX mineral discoveries, turning complex geological and market data into actionable insights for both short-term traders and long-term investors — precisely the kind of edge that matters when sentiment troughs create outsized opportunity. Explore historic discoveries and their exceptional returns, then begin your 14-day free trial today to position yourself ahead of the next major market move.