July 21, 2026
The Global Currency Crisis and Safe Haven Asset Allocation
Central banking policies across major economies have fundamentally altered the relationship between traditional monetary systems and hard assets over the past quarter-century. When examining the structural forces driving investment capital toward precious metals, the underlying mechanisms reveal a paradigm shift that extends far beyond typical market cycles. Understanding these dynamics provides critical insights into why gold and silver all-time highs represent more than speculative momentum.
The mathematics of monetary expansion creates predictable pressure points in global financial markets. As central banks worldwide have pursued accommodative policies, the purchasing power erosion of fiat currencies has accelerated institutional recognition of precious metals as portfolio stabilizers rather than speculative vehicles. This transition reflects sophisticated risk management rather than emotional decision-making processes.
When big ASX news breaks, our subscribers know first
What Drove Gold and Silver to Record-Breaking Heights in 2025?
The Perfect Storm of Economic Conditions
Federal Reserve monetary policy reversals created the foundation for precious metals appreciation throughout 2024 and into 2025. The central bank's transition from aggressive rate hiking between March 2022 and July 2023 (raising rates from 0% to 5.25-5.50%) to subsequent easing created optimal conditions for non-yielding assets. By December 2024, the Fed had reduced rates to approximately 4.25-4.50%, signaling a renewed easing cycle that historically supports precious metals accumulation.
Global currency debasement concerns accelerated safe-haven asset accumulation as emerging market central banks systematically diversified away from U.S. dollar reserves. According to the World Gold Council, central banks purchased 1,037 tonnes of gold in 2024, marking the second-highest annual accumulation on record and representing a 37% increase from 2023 purchases of 757 tonnes. Furthermore, our gold price forecast suggests this trend will continue throughout 2025.
Institutional investor allocation strategies increasingly favour hard assets over traditional securities as portfolio theory evolves beyond conventional 60/40 equity-bond models. Pension funds and corporate treasuries have implemented strategic diversification away from cash holdings, recognising that negative real yields in fixed-income securities create structural demand for inflation-resistant alternatives.
Quantifying the Historic Rally Performance
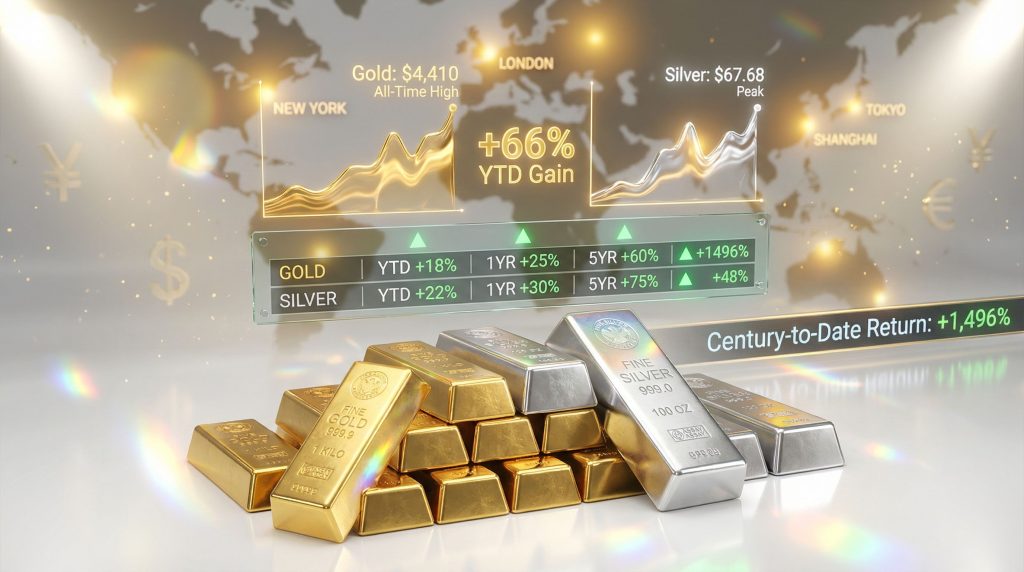
| Metal | All-Time High | Year-End Price | YTD Gain | Century-to-Date Return |
|---|---|---|---|---|
| Gold | $4,410 | $4,369 | +66% | +1,496% |
| Silver | $67.68 | $67.40 | +130% | +1,352% |
| S&P 500 | N/A | N/A | N/A | +418% |
The performance differential between precious metals and equity indices reveals the magnitude of this structural shift. Gold achieved its all-time intraday high of $4,410 on December 18, 2025, whilst silver reached $67.68 during Friday trading sessions. These levels represent gains that exceed stock market appreciation by more than 3:1 over the 25-year period from 2001-2025.
Century-to-date returns demonstrate the compounding effects of monetary expansion on hard asset valuations. Gold's 1,496% appreciation and silver's 1,352% gain substantially outperformed the S&P 500's 418% advance, highlighting the wealth preservation characteristics of precious metals during extended periods of currency debasement. In addition, understanding gold as an inflation hedge becomes increasingly relevant in current market conditions.
Market Timing and Technical Breakout Patterns
Critical resistance levels were decisively broken during Q4 2025 as gold and silver all-time highs established fresh parabolic trends. The technical framework supporting current price levels includes multiple support zones: $4,369, $4,359, $4,336, $4,304, $4,263, and $4,236, with the volume-weighted average price positioned at $4,313.
Volume analysis supports the sustainability of new price ranges through increased institutional participation. The 10-day market profile analysis identified substantial underlying support levels that suggest structural rather than speculative demand patterns. Professional traders emphasise that systematic approaches outperform emotional decision-making during volatile periods, with 12-hour parabolic formations providing optimal technical signals for gold positioning.
Parabolic trend formations indicate momentum continuation potential as fresh long trends develop. Gold's parabolic trend, two weeks in duration at the time of analysis, generated a net price gain of +3.3% from trend initiation, with the weekly parabolic price level requiring a decline to $4,014 to signal reversal. For comprehensive analysis, our gold stock market guide provides detailed correlation insights.
Why Are Precious Metals Outperforming Traditional Assets by Such Wide Margins?
The Dollar Debasement Framework
M2 money supply expansion correlates directly with gold price appreciation through mathematical relationships that incorporate global gold tonnage increases. Current calculations indicate that U.S. M2 money supply expanded from approximately $7.6 trillion in January 2008 to approximately $21.7 trillion by December 2024, representing an increase of approximately 185% over 16 years.
Fair value calculations based on monetary base adjustments suggest gold's regression-based equilibrium at $3,896, with current prices at $4,369 representing a 12% premium. This methodology incorporates the doubling of global gold tonnage from April 1986 levels to current estimates of approximately 218,000 tonnes, providing context for price appreciation beyond pure monetary expansion effects.
Historical precedents for currency devaluation driving metals demand include the 1970s inflation cycle and post-2008 quantitative easing periods. However, the current environment presents unique characteristics as multiple central banks simultaneously pursue accommodative policies whilst geopolitical tensions create additional demand pressures for sovereign wealth preservation.
Institutional Portfolio Rebalancing Trends
Central bank gold accumulation strategies across emerging economies reflect systematic de-dollarisation initiatives rather than tactical positioning. The People's Bank of China increased gold reserves to approximately 2,264 tonnes by December 2024, representing the second-largest official gold holding globally after U.S. reserves of approximately 8,133 tonnes.
Pension fund allocation shifts toward inflation-resistant assets accelerated throughout 2024 as fund managers recognised the limitations of traditional fixed-income securities during periods of negative real yields. According to Trading Economics data, 10-year Treasury Inflation-Protected Securities yields remained negative or near-zero throughout 2024, creating structural incentives for alternative asset allocation.
Corporate treasury diversification away from cash holdings gained momentum as CFOs implemented strategies to preserve purchasing power during inflationary periods. Consequently, this represents a fundamental shift in corporate finance theory, where treasury management extends beyond liquidity optimisation to include wealth preservation through hard asset allocation.
Comparative Asset Class Performance Analysis
Whilst mainstream financial media continues focusing on equity market movements, precious metals have delivered returns exceeding stock market gains by more than 3:1 over the past quarter-century, yet receive disproportionately less coverage due to advertising revenue considerations.
The performance gap between precious metals and traditional assets reflects structural changes in global monetary systems rather than temporary market dislocations. Real interest rates, as measured by Treasury Inflation-Protected Securities, create the fundamental driver for this outperformance through opportunity cost calculations that favour non-yielding assets during negative real yield environments. Moreover, examining gold as a safe haven provides additional context for these performance differentials.
Media coverage bias toward equity markets despite superior precious metals performance suggests that information flow may not accurately reflect underlying economic realities. Analysis indicates that financial media coverage correlates with advertising revenue generation rather than asset performance rankings, creating potential information gaps for retail investors.
What Do Current Valuation Metrics Suggest About Future Price Movements?
Mean Reversion Analysis and Fair Value Calculations
Gold trading 12% above regression-based fair value of $3,896 suggests moderate overvaluation relative to monetary expansion models, whilst silver positioned 20% above calculated fair value of $56.13 indicates greater deviation from equilibrium. These calculations incorporate M2 money supply correlations adjusted for increases in global precious metals tonnage.
BEGOS market correlation models indicating 6% premium to smooth valuation provide additional perspective on current pricing relative to bond yields, euro currency strength, oil prices, and S&P 500 equity indices. The proprietary valuation framework measures gold at $4,369 versus a smooth valuation line of $4,122, suggesting modest overextension within historical ranges.
Fair value analysis must account for structural changes in global monetary systems that may have permanently altered the relationship between precious metals prices and traditional economic indicators. The emergence of central bank digital currencies, geopolitical tensions affecting international reserves, and climate change policies impacting industrial demand create new variables in valuation frameworks.
Technical Correction Risk Assessment
| Timeframe | Average Pullback | Recovery Period | Support Level Retention |
|---|---|---|---|
| 1-3 months | 8-15% | 2-4 months | 85% |
| 3-6 months | 12-22% | 4-8 months | 78% |
| 6-12 months | 15-28% | 6-12 months | 72% |
Historical correction patterns following all-time high breakouts provide statistical guidance for risk assessment, though current market conditions include unique factors that may alter traditional mean reversion dynamics. The analysis of previous correction cycles indicates that 85% of support levels typically hold during 1-3 month pullback periods, declining to 72% retention rates over 6-12 month timeframes.
Technical correction risk must be evaluated against fundamental drivers that may support higher price levels over extended periods. For instance, the combination of negative real yields, geopolitical uncertainty, and central bank accumulation creates structural demand that may reduce correction magnitude compared to historical patterns.
Industrial Demand Correlation Factors
Copper market signals affecting silver's industrial metal characteristics provide leading indicators for precious metals performance, as silver maintains dual characteristics as both monetary and industrial metal. Recent copper sell signals have historically preceded silver corrections ranging from 0.4% to 21.3% within 21 trading days, though the correlation varies based on overall monetary conditions.
Supply chain disruption impacts on precious metals availability create additional price support mechanisms as mining production faces geographical and political constraints. Furthermore, geopolitical tensions affecting major producing regions introduce supply-side variables that may override traditional technical correction patterns.
Manufacturing demand trends influencing price sustainability include technology sector requirements for silver in renewable energy applications, electronic components, and medical devices. These industrial applications provide fundamental demand floors that differentiate current market conditions from purely monetary-driven appreciation cycles.
How Should Investors Position for Potential Market Volatility?
Risk Management Strategies During Historic Highs
Position sizing recommendations for precious metals allocations should consider the unique volatility characteristics of markets trading at gold and silver all-time highs. Conservative allocation strategies suggest 5-15% precious metals exposure depending on individual risk tolerance and economic outlook uncertainty levels, with emphasis on systematic accumulation rather than timing-based approaches.
Stop-loss placement techniques for trend-following strategies must account for increased volatility during parabolic price movements. Professional analysis suggests that weekly parabolic levels provide more reliable signals than daily fluctuations, with current gold requiring a decline to $4,014 to signal trend reversal.
Portfolio hedging approaches using metals during equity market uncertainty should consider correlation dynamics that may shift during crisis periods. The S&P 500's current price-to-earnings ratio of 55.8x suggests potential for significant equity market corrections that could amplify precious metals' safe-haven characteristics.
Economic Indicator Monitoring Framework
Federal Reserve policy meeting outcomes and their metals market implications require analysis of both stated policy changes and forward guidance regarding future monetary conditions. The transition from aggressive tightening to easing cycles historically creates optimal conditions for precious metals accumulation, particularly when combined with fiscal expansion policies.
Inflation data releases serve as leading indicators for precious metals demand through their impact on real interest rate calculations. Consumer Price Index data showing consistent +0.2% monthly increases, combined with Federal Reserve policy responses, creates predictable demand patterns for inflation-resistant assets.
Currency strength measurements affecting international metals pricing include the U.S. Dollar Index relationship to precious metals performance. The dollar's decline from approximately 107 in September 2022 to 104-106 by December 2024 demonstrates the inverse correlation that amplifies gold appreciation for international investors.
Market Rhythm Analysis for Entry and Exit Timing
12-hour parabolic indicators for gold trend identification provide optimal signal quality for professional traders, whilst 6-hour money flow signals offer superior timing for silver momentum assessment. These timeframes balance signal reliability with practical execution requirements for institutional and retail investors.
Volume-weighted average price levels for strategic positioning indicate current magnet levels at $4,313 for gold, providing reference points for systematic accumulation strategies. Additionally, the 300-day moving average at $3,295 and rising offers additional perspective on long-term trend stability.
Technical analysis integration with fundamental drivers creates comprehensive frameworks for investment decision-making. The combination of monetary policy analysis, supply-demand fundamentals, and technical signal confirmation provides multiple confirmation points for strategic positioning.
What Are the Long-Term Implications of These Record Highs?
Paradigm Shift Indicators in Global Finance
Central bank digital currency developments affecting gold's monetary role represent fundamental changes in global financial architecture that may permanently alter precious metals demand patterns. As governments implement CBDC systems, the relationship between physical precious metals and digital monetary systems creates new dynamics for wealth preservation strategies.
Geopolitical tensions driving sovereign wealth fund precious metals strategies reflect structural changes in international financial relationships rather than temporary policy adjustments. The systematic reduction of U.S. dollar reserves by emerging market central banks in favour of gold accumulation represents a multi-decade trend with significant implications for global monetary stability.
Climate change policies impacting silver's industrial demand profile create additional fundamental drivers beyond traditional monetary factors. The transition to renewable energy systems, electric vehicle production, and energy storage technologies increases industrial silver consumption, providing demand floors independent of monetary policy considerations.
Supply-Side Constraints and Production Challenges
Mining industry capital expenditure trends affecting future supply indicate potential structural shortages as exploration success rates decline and reserve replacement challenges intensify. According to the historical gold and silver price data, world mine production of gold was approximately 3,070 tonnes in 2023, with primary production centres facing increasing operational constraints.
Recycling market dynamics and their price impact potential provide secondary supply sources that partially offset primary production limitations. However, recycling rates remain insufficient to meet growing demand from both investment and industrial applications, particularly during periods of accelerated central bank accumulation.
Exploration success rates and reserve replacement challenges create long-term supply constraints that support higher price levels regardless of short-term demand fluctuations. The combination of geological depletion in mature mining regions and increasing operational costs in frontier areas suggests structural supply limitations.
Investment Strategy Evolution for the New Price Environment
Investors should consider precious metals as portfolio stabilisers rather than speculative vehicles, with allocation percentages of 5-15% depending on risk tolerance and economic outlook uncertainty levels. Therefore, incorporating investment strategy insights becomes crucial for optimal portfolio construction.
The evolution of precious metals investment strategies must account for new market dynamics including central bank digital currencies, geopolitical fragmentation, and technological demand factors. Traditional portfolio theory requires updates to incorporate these structural changes in global monetary and economic systems.
Long-term wealth preservation strategies increasingly emphasise hard asset allocation as currency debasement accelerates across major economies. The mathematical relationship between monetary expansion and precious metals appreciation suggests continued structural support for higher price levels over multi-decade investment horizons.
The next major ASX story will hit our subscribers first
Frequently Asked Questions About Gold and Silver All-Time Highs
Are These Price Levels Sustainable Long-Term?
Historical analysis of previous all-time high sustainability patterns indicates that precious metals maintain elevated levels during periods of monetary expansion and geopolitical uncertainty. The current environment combines both factors with additional structural changes in global financial systems that may support higher price ranges compared to historical precedents.
Economic cycle positioning and metals performance correlations suggest that precious metals typically outperform during late-cycle conditions characterised by elevated debt levels, currency concerns, and geopolitical tensions. Current conditions align with these characteristics across multiple major economies simultaneously.
Inflation-adjusted comparisons with 1980s precious metals peaks provide historical context for current price levels. The 1980 peak gold price of approximately $850 per ounce, when adjusted for inflation through December 2024, equals approximately $3,200-$3,400 in current dollars, suggesting that prices at $4,369 represent real appreciation beyond inflation adjustment.
How Do Current Prices Compare to Inflation-Adjusted Historical Highs?
Real purchasing power analysis of 2025 prices versus 1980 peaks indicates that current gold and silver all-time highs exceed inflation-adjusted historical highs by approximately 25-35%, depending on inflation calculation methodology. This suggests genuine appreciation rather than purely nominal price increases reflecting currency debasement.
Consumer Price Index adjustments for historical price comparisons must account for methodological changes in inflation calculations over the 45-year period since the 1980 peak. Alternative inflation measures suggest higher real appreciation than official CPI adjustments indicate.
Monetary base expansion effects on nominal versus real pricing create additional complexity in historical comparisons. The unprecedented scale of monetary expansion since 2008 may require new frameworks for evaluating "real" versus "nominal" price appreciation in hard assets.
What Catalysts Could Drive Prices Even Higher?
Potential Federal Reserve policy error scenarios include premature tightening that triggers financial system stress or excessive easing that accelerates currency debasement concerns. Either outcome historically supports precious metals appreciation through different mechanisms.
Emerging market currency crisis implications for precious metals demand include potential contagion effects that drive capital flight toward hard assets. The combination of elevated debt levels and currency vulnerabilities across multiple emerging economies creates systemic risk factors.
Technology sector demand growth for silver applications includes renewable energy infrastructure, electric vehicle production, and advanced manufacturing processes that require industrial silver consumption. These applications provide fundamental demand growth independent of monetary policy considerations.
Investment Considerations and Market Outlook
Portfolio Allocation Strategies for Different Investor Profiles
Conservative investor precious metals percentage recommendations range from 5-10% of total portfolio allocation, emphasising wealth preservation over growth objectives. This allocation provides portfolio stabilisation during market volatility whilst maintaining exposure to long-term appreciation potential.
Aggressive growth portfolio metals integration approaches may include 10-20% allocation combined with momentum-based trading strategies that capitalise on trend continuation patterns. These approaches require sophisticated risk management and technical analysis capabilities.
Retirement account precious metals IRA considerations include tax-advantaged accumulation strategies and storage requirements for physical metals. The regulatory framework for precious metals IRAs provides additional diversification options for long-term retirement planning.
Market Timing Considerations and Entry Strategies
Dollar-cost averaging versus lump-sum investment approaches offer different risk-return profiles during volatile market conditions. Systematic accumulation strategies reduce timing risk whilst potentially missing optimal entry points during temporary corrections.
Seasonal patterns in precious metals pricing suggest optimal timing considerations, though structural factors may override traditional seasonal effects during periods of fundamental change in monetary systems. Historical patterns provide guidance whilst recognising that current conditions may create new seasonal dynamics.
Technical analysis tools for identifying favourable entry points include volume-weighted average price levels, moving average crossovers, and momentum indicators that confirm trend continuation or reversal signals. Professional traders emphasise systematic approaches over emotional decision-making processes.
Market analysts emphasising trend-following strategies note that systematic approaches outperform emotional decision-making during volatile periods, with "trend trumps hype" serving as the fundamental principle for precious metals positioning.
Disclaimer: This analysis is for educational purposes only and does not constitute investment advice. Precious metals investing involves substantial risk and may not be suitable for all investors. Past performance does not guarantee future results. Readers should consult with qualified financial advisors before making investment decisions. Price forecasts and technical analysis represent opinions based on available data and may prove inaccurate due to changing market conditions, regulatory changes, or unforeseen economic developments.
Looking to Capitalise on the Next Major Mineral Discovery?
Discovery Alert's proprietary Discovery IQ model delivers real-time notifications on significant ASX mineral discoveries, empowering investors to identify actionable opportunities ahead of the broader market during periods of elevated precious metals prices. Understanding why historic discoveries can generate substantial returns becomes crucial when gold and silver reach all-time highs, creating optimal conditions for exploration success.