
July 7, 2026
When Nobody Is Watching, That Is Usually When Markets Move
There is a peculiar dynamic that repeats itself across financial history: the moments of greatest opportunity are rarely the ones generating the most headlines. When institutional capital retreats, when trading volumes collapse, and when even seasoned investors lose conviction in a sector, the conditions for a powerful reversal quietly take shape. That is precisely where precious metals stand today. Understanding whether the gold and silver bottom and rebound thesis holds up requires looking past surface-level narratives and examining the underlying mechanics of sentiment, policy, and demand.
When big ASX news breaks, our subscribers know first
The Macro Environment Has Shifted More Than Most Investors Realise
Converging Economic Signals Are Quietly Favouring Precious Metals
The consensus view circulating among institutional investors right now centres on three concerns: persistent inflation, a firm U.S. dollar, and the possibility of interest rates staying elevated or even moving higher. It is a cautious, defensible position. It is also, historically speaking, the kind of consensus that tends to be wrong at turning points.
When you examine the actual data rather than the prevailing narrative, a different picture emerges. U.S. GDP growth is trending toward sub-2% territory, with some projections pointing to 1.5% or below. Labour market conditions, while not dramatically weak, are no longer showing signs of overheating. Most importantly, inflation expectations on a two-year and five-year forward basis have continued declining, not rising, over recent weeks.
These three forces — slowing growth, a cooling labour market, and declining inflation expectations — do not exist in isolation. They converge to create a macro environment that is quietly becoming more hospitable to gold and silver, even before any formal shift in monetary policy is announced.
What CME Open Interest at a 15-Year Low Is Actually Telling You
Positioning Data Reveals Maximum Disengagement
One of the most underappreciated indicators in precious metals markets is open interest on the CME, which tracks the total number of outstanding futures contracts. When open interest is high, it signals active participation and strong conviction. When it collapses to multi-decade lows, it signals something altogether different: the market has lost its directional compass.
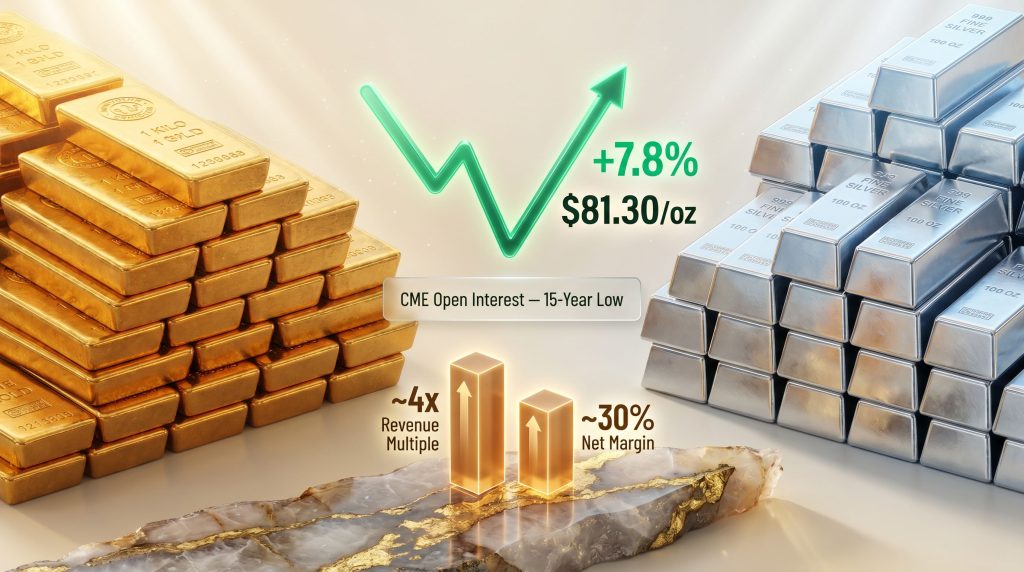
CME open interest in gold and silver futures is currently sitting at a 15-year low. That figure alone warrants serious attention. Furthermore, when you overlay it with the positioning breakdown, the picture becomes even more striking.
| Positioning Metric | Current Status | Historical Context |
|---|---|---|
| CME Open Interest | 15-year low | Extreme disengagement from the sector |
| Speculative Long Positions | Near cycle trough | Suggests capitulation, not conviction |
| Speculative Short Positions | Also near trough | Reflects widespread uncertainty |
| Institutional Participation | Minimal / Sidelined | Capital waiting for directional clarity |
Both speculative long and short positions are simultaneously near their cycle lows. This is not the profile of a bear market with strong downside conviction. It is the profile of a market where nobody has any idea which direction comes next, and so nobody is positioned at all.
Contrarian Framework: When both long and short speculative positions collapse simultaneously, it does not signal a bear market. It signals a market without conviction. Historically, these conditions precede significant directional moves, often to the upside, as repositioning occurs rapidly once sentiment shifts.
For contrarian investors, this is precisely the kind of environment that warrants closer attention. Maximum disengagement has historically preceded powerful rerating episodes in precious metals. Consequently, market volatility patterns in precious metals reinforce the case that these disengagement phases tend to resolve with sharp directional moves.
Has the Gold and Silver Bottom Already Been Reached?
The Evidence Supporting a Floor Formation
Several converging indicators suggest the gold and silver bottom and rebound scenario is more than speculative optimism. Consider the weight of the following evidence collectively:
- CME open interest at a 15-year low reflects the kind of maximum disengagement that historically marks exhaustion rather than continuation of a downtrend
- Gold's 12-month trailing average price aligns closely with current spot levels near $4,200/oz, indicating the market has found an equilibrium rather than free-falling through support
- Gold miners have experienced a 50% retracement from their peak levels, a magnitude of correction that has historically served as a mean-reversion entry signal rather than a precursor to further structural decline
- Silver surged 7.8% off recent lows to reach $81.30/oz, demonstrating genuine reactive demand rather than a short-covering blip
- Gold itself rebounded 4 to 5% following a near 10% single-session decline, one of the steepest short-term corrections observed in recent years
- Jewelry demand, which fell by an estimated 200 annualised tonnes in Q1 2026, is expected to re-enter the market progressively through the remainder of the year
The Case That Confirmation Is Still Needed
Intellectual honesty requires acknowledging that the bull case for precious metals is not yet confirmed. However, several conditions must resolve before a sustained rebound can be declared with confidence:
- The U.S. dollar remains firm, which continues to suppress risk appetite and create headwinds for USD-denominated metals
- Upcoming U.S. jobs data could shift rate expectations materially if the labour market proves more resilient than current trends suggest
- Gold faces meaningful technical resistance between $4,400 and $4,460, near its 200-day moving average
- Silver faces a key structural ceiling near $70, with a clean breakout above $50 still unconfirmed on a multi-month basis
- Institutional investors remain largely on the sidelines, awaiting clearer directional signals before redeploying capital
Decoding the Kevin Warsh Policy Stance: The Market Got It Wrong
Why Price Stability Is Actually a Structurally Bullish Signal
When Kevin Warsh, the incoming Federal Reserve chair, delivered his policy statement focused on price stability rather than signalling imminent rate reductions, markets interpreted it as hawkish. The consensus saw the absence of a rate cut signal as a disappointment. Precious metals sold off.
That interpretation missed the actual logic embedded in the statement.
Warsh's focus on price stability was not an indication that rates would stay high. It was, in fact, a signal calibrated for a specific audience: holders of long-duration bonds, particularly 20 and 30-year Treasuries. Had he explicitly guided toward rate cuts, those bondholders would have faced immediate concern that lower rates could signal resurgent inflation, eroding the real value of their fixed coupon payments.
By anchoring his rhetoric around price stability instead, Warsh effectively communicated to long-duration bond markets that real yields would remain intact. That act of anchoring long-term rates has a specific and direct implication for gold and silver: it removes the threat of further rate hikes, which is the single most important variable in the opportunity cost calculation for holding non-yielding precious metals.
Policy Insight: A Federal Reserve chair who explicitly commits to price stability without signalling rate hikes is effectively anchoring long-term bond yields. For precious metals investors, this is structurally bullish: it reduces the opportunity cost of holding non-yielding assets while simultaneously reassuring bond markets that real returns remain positive.
The Bond Market Logic Most Precious Metals Investors Are Missing
The implications cascade through multiple asset classes in ways that are not immediately obvious:
- Explicitly promising rate cuts would have alarmed holders of 20 to 30-year Treasuries by raising inflation fears and reducing the real value of their coupon income
- Anchoring rhetoric around price stability reassures bond holders that real yields remain positive, reducing volatility in long-duration fixed income
- Suppressing long-term rate volatility is a direct headwind removal for gold and silver, which are most sensitive to real interest rate movements
- Gold and silver can begin re-rating before any actual rate cut is announced, because the market is forward-looking and prices in the elimination of rate hike risk, not the delivery of rate cuts
The key insight — and one that Alain Corbani, Head of Mining and Portfolio Manager at Mont Bleu Finance, has articulated publicly — is that markets do not need a rate cut to drive gold higher. They only need to stop pricing in the risk of further hikes. That shift in probability calculus alone is sufficient to unlock upside in precious metals. In addition, central bank demand has continued reinforcing this structural floor independent of short-term rate movements.
What Actually Caused the Correction and Why Those Forces Have Faded
Two Catalysts That Are Now Largely Resolved
Understanding the mechanics of the recent selloff is essential for assessing whether the correction represents a structural trend reversal or a technical consolidation. The evidence points firmly to the latter.
Catalyst 1: Geopolitical Oil Price Shock
- Escalating tensions in the Middle East drove oil prices toward $120 per barrel at their peak
- Higher energy costs raised near-term inflation expectations, undermining the case for monetary easing
- Since that peak, oil prices have declined by approximately 40%, returning to pre-conflict levels
- Energy-driven inflation fears have materially dissipated as a result
Catalyst 2: Misinterpretation of Fed Leadership Signals
- Broad market consensus anticipated an incoming Fed chair statement signalling lower rates imminently
- The actual policy communication focused on price stability rather than rate trajectory
- Markets initially read this as hawkish, triggering a repricing in precious metals
- Two-year and five-year inflation expectations have continued trending downward since the announcement, validating the underlying dovish logic of the statement
Analytical Note: The sell-off that followed these two catalysts reflected repositioning and momentum exhaustion after a violent upward leg, not a deterioration in the structural investment case for gold and silver. The distinction between technical corrections and fundamental trend reversals is critical for long-term positioning decisions.
The next major ASX story will hit our subscribers first
Gold Miners: What the Valuation Data Is Saying Right Now
A Historically Compelling Entry Profile
The equity side of the precious metals complex deserves specific attention, because mining stocks have corrected more sharply than the underlying metals and are now sitting at a valuation level that warrants serious analysis. Gold price movements have historically amplified both the downside and recovery potential of mining equities relative to spot metal.
| Metric | Current Level | Investment Implication |
|---|---|---|
| Gold Spot Price | ~$4,200/oz | Aligned with 12-month trailing average |
| Mining Sector Revenue Multiple | ~4x | Historically low relative to margin profile |
| Average Net Margin (Sector) | ~30% | Strong cash generation capacity |
| Miner Retracement from Peak | ~50% | Classic mean-reversion entry signal |
| Silver Spot Rebound | +7.8% to $81.30/oz | Demand re-engagement from lows |
The fact that the 12-month trailing gold price aligns with current spot at approximately $4,200/oz is particularly significant. It means mining sector earnings are not priced on elevated or unrealistic gold price assumptions. Current cash flow generation is real and sustainable at prevailing prices.
At four times revenues with 30% average net margins, the sector offers a compelling risk/reward profile for investors with a medium-term time horizon. The critical caveat is that miners require sustained metal price stability, not merely a short-term bounce, to fully re-rate. A gold price that oscillates around $4,200 without breaking higher will limit upside in mining equities even if the floor hypothesis proves correct.
The Demand Side Catalyst That Most Analysis Is Overlooking
Jewelry Demand Suppression as a Forward-Looking Bullish Signal
One dimension of the gold and silver rebound thesis that receives insufficient attention is the behavioural pattern of jewelry fabricators and manufacturers during periods of extreme price volatility.
When gold and silver prices move violently in either direction, downstream manufacturers, jewellers, and fabricators routinely pause inventory replenishment. This is not irrational panic; it is a well-documented industry practice. Fabricators cannot price their products accurately when input costs are swinging unpredictably, so they wait for stabilisation before committing to new stock purchases.
The consequence of this behaviour in Q1 2026 was meaningful:
- An estimated 200 annualised tonnes of jewelry-related gold demand was effectively withheld from the market in Q1
- This volume represents deferred demand, not destroyed demand
- As prices stabilise, that purchasing activity is expected to return to market progressively through the remainder of 2026
- This wave of deferred demand is not yet reflected in current spot pricing, meaning it represents a genuine latent catalyst
This dynamic is important precisely because it is not widely discussed. Most market commentary focuses on ETF flows, central bank purchasing, and speculative positioning. The jewelry channel, which historically accounts for a substantial share of annual physical gold demand globally, tends to be treated as a passive price taker. In reality, its temporary withdrawal from the market can create a demand vacuum that resolves sharply once stability returns. For a broader perspective on why gold and silver will rebound strongly, including this deferred demand mechanism, the analysis from Ainsley Bullion is worth reviewing.
Central Bank and Institutional Demand: The Structural Underpinning
Central bank gold accumulation has remained a consistent structural demand driver independent of price levels over recent years, providing a base-load demand floor that is relatively insensitive to short-term price movements. Investment demand through ETFs and physical channels has been more subdued, which itself represents a potential upside catalyst if retail and institutional sentiment improves. Deutsche Bank and other major institutional research teams have maintained that the long-term structural investment rationale for precious metals remains intact despite the current period of volatility.
Silver vs. Gold: Which Metal Offers the Stronger Near-Term Setup?
Comparing the Technical and Fundamental Profiles
| Factor | Gold | Silver |
|---|---|---|
| Recent Correction Depth | ~10% single-session decline | ~30% single-session decline |
| Rebound Magnitude | +4 to 5% | +7.8% |
| Key Resistance Level | $4,400 to $4,460 (200-DMA) | ~$70 |
| Structural Breakout Target | Consolidation above $4,200 | Potential breakout above $50 |
| Industrial Demand Component | Minimal | Significant (solar, EVs, electronics) |
| Relative Outperformance | Benchmark | Outperforming gold on rebounds |
Silver's dual nature as both a monetary metal and a significant industrial input explains its deeper corrections and sharper recoveries. Demand from solar photovoltaic manufacturing, electric vehicle systems, and consumer electronics provides a demand floor that has no direct equivalent in gold. In environments where manufacturing activity stabilises and monetary conditions ease simultaneously, silver historically outperforms gold on a percentage return basis, making it the higher-beta expression of the same macro thesis.
Furthermore, the gold-silver ratio remains a useful barometer for assessing relative value between the two metals, and current readings suggest silver remains historically undervalued relative to gold on a ratio basis.
What Needs to Happen for the Rebound to Be Confirmed
Three Conditions That Would Validate the Bull Case
- Rate hike risk is fully priced out: markets need to stop assigning any meaningful probability to additional Fed tightening. The elimination of that risk, not the delivery of actual rate cuts, is the primary trigger for precious metals re-rating.
- U.S. dollar momentum stalls or reverses: dollar strength has been the principal headwind for metals priced in USD. A period of dollar consolidation or modest weakening would remove a significant technical overhang.
- Deferred jewelry and industrial demand re-enters the market: the approximately 200-tonne Q1 demand gap needs to begin closing, which requires sustained price stability to encourage fabricator restocking.
Technical Milestones Worth Monitoring
- Gold sustaining above $4,200 confirms the equilibrium hypothesis and reduces downside risk for mining equities
- A clean break above $4,460 would signal the correction phase is definitively behind us
- Silver holding above $70 and tracking toward $81+ would confirm outperformance relative to gold
- A 2 to 3-month summer rebound window remains technically viable if current support levels hold through the near-term data cycle
According to Market Index data on historical rebounds, gold and silver have demonstrated a consistent pattern of recovering strongly after sharp corrections, which further supports the technical case for monitoring these key levels closely.
Frequently Asked Questions: Gold and Silver Bottom and Rebound
Has Gold and Silver Hit the Bottom?
While definitive confirmation requires additional macroeconomic data, particularly U.S. employment figures and dollar direction, multiple indicators point toward an equilibrium level having been reached. CME open interest at 15-year lows, a 50% miner retracement, and gold trading at its 12-month trailing average collectively support the floor thesis. Final confirmation will depend on whether upcoming data reinforces or disrupts the current trajectory of declining inflation expectations.
Do You Need a Fed Rate Cut for Gold to Rally?
No. The more important condition is the elimination of rate hike risk. Once markets price out the probability of further tightening, the opportunity cost of holding gold and silver declines materially, and both metals can begin re-rating before any actual rate reduction is announced. The market's forward-looking mechanism means sentiment can shift well ahead of official policy changes.
Why Did Gold and Silver Sell Off So Sharply?
The correction followed two converging catalysts: a geopolitical oil price shock that temporarily raised inflation expectations, and a misreading of the Federal Reserve chair's policy communication. Both catalysts have since materially faded. Oil prices have retreated approximately 40% from their peak, and 2 to 5-year inflation expectations continue trending lower.
What Is the Outlook for Silver Specifically?
Silver is currently outperforming gold on rebounds and offers a higher-beta expression of the precious metals recovery thesis. Key resistance sits near $70, with a structural breakout target above $50 on a longer-term basis. Its industrial demand component, particularly from solar energy and electric vehicles, provides an additional demand floor not present in gold.
Are Gold Mining Stocks a Better Investment Than Physical Gold Right Now?
At approximately 4x revenues and 30% average net margins, mining equities offer significant leverage to any recovery in gold prices. However, sustained metal price stability is a prerequisite for miners to fully re-rate. Physical gold and silver offer lower volatility with direct commodity exposure. The optimal allocation depends on an investor's risk tolerance and time horizon.
Key Takeaways: The Gold and Silver Bottom and Rebound Thesis in Summary
- Sentiment is at an extreme: 15-year lows in CME open interest signal maximum disengagement, historically a contrarian buy signal rather than a continuation of bearish trends
- The macro environment is quietly turning favourable: cooling inflation expectations, slowing GDP growth, and stable rate expectations are reducing headwinds for precious metals simultaneously
- The correction catalysts have faded: oil prices have retraced approximately 40% from peak, and inflation expectations on a 2 to 5-year horizon continue declining
- Kevin Warsh anchored long-term rates: this is structurally bullish for gold and silver in a way the market has not yet fully priced in
- Deferred jewelry demand is a hidden catalyst: approximately 200 annualised tonnes withheld from the market in Q1 2026 is expected to return through the remainder of the year
- Miners offer compelling risk/reward: a 50% retracement from peaks, 4x revenue multiples, and 30% net margins represent a historically attractive entry profile
- Silver offers higher beta: its deeper corrections and sharper rebounds, combined with its industrial demand exposure, make it the higher-leverage precious metals play in a recovery scenario
This article is intended for informational purposes only and does not constitute financial advice. All forward-looking statements, price forecasts, and market projections involve uncertainty and should not be relied upon as a basis for investment decisions. Readers should conduct their own research and consult a qualified financial adviser before making any investment.
Want To Capitalise on the Next Major Precious Metals Discovery Before the Market Catches On?
Discovery Alert's proprietary Discovery IQ model delivers real-time alerts on significant ASX mineral discoveries the moment they hit the exchange, instantly transforming complex data across 30+ commodities into actionable insights for both short-term traders and long-term investors — begin your 14-day free trial today and explore historic discovery returns to understand just how powerful early positioning can be.