June 18, 2026
When Monetary Systems Crack, Precious Metals Reveal Their True Purpose
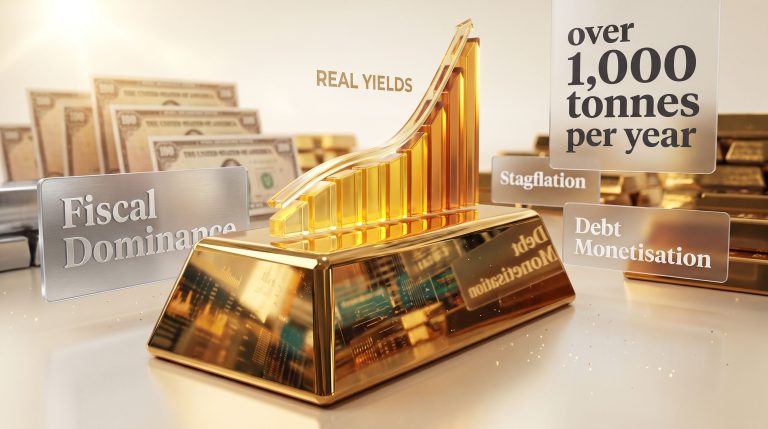
Across centuries of financial history, one pattern repeats with remarkable consistency: the more aggressively a monetary system expands its liabilities, the more compelling the case becomes for assets that exist outside that system entirely. Gold silver and the global financial crisis are inextricably linked, as both metals do not pay interest, do not carry counterparty risk, and cannot be printed into existence. These are not merely attractive qualities in a stable environment. In a world where sovereign debt loads are reaching levels not seen since the aftermath of the Second World War, they become defining ones.
The current macro environment carries characteristics that financial historians recognise immediately. U.S. debt has crossed 100% of GDP for the first time since 1946, a threshold that represents a qualitatively different risk environment than the relatively contained debt cycles of recent decades. Simultaneously, central bank balance sheets remain historically bloated, equity valuations in U.S. markets have reached levels that strain conventional valuation frameworks, and rising bond yields are compressing the fiscal space that governments would need to respond to the next major downturn. For investors who understand how gold and silver have historically behaved when these forces converge, the current moment demands serious attention.
When big ASX news breaks, our subscribers know first
The Architecture of Modern Financial Fragility
The global financial system's current vulnerability did not emerge overnight. It is the product of decades of compounding decisions: sovereign governments borrowing to sustain consumption rather than investment, central banks suppressing volatility through balance sheet expansion, and corporations loading balance sheets with cheap debt during extended periods of near-zero interest rates.
The relationship between these three forces is not additive but multiplicative. When sovereign debt loads are elevated, governments have less capacity to deploy fiscal stimulus during recessions. When corporate leverage is stretched, earnings downturns translate rapidly into credit stress. When household balance sheets carry high debt-service burdens, consumer spending contracts sharply at the first sign of employment weakness. Each vulnerability amplifies the others.
What distinguishes the current environment from previous debt cycles is the simultaneous presence of all three conditions at historically elevated levels, combined with interest rates that, while having risen from their post-2008 lows, remain insufficient to have meaningfully reduced any of these imbalances. The productive debt of the postwar era, which funded infrastructure, technology, and manufacturing capacity, is structurally different from debt accumulated to service existing obligations. Understanding this distinction is central to understanding why the current warning signals carry more weight than simple debt-to-GDP ratios might suggest.
The Threshold Indicators That Historically Precede Systemic Breakdown
Not all financial stress produces systemic crises. The critical question for investors is identifying when localised market corrections risk becoming self-reinforcing contagion events. History identifies several threshold indicators with reasonable reliability:
- Yield curve inversions: When short-term government borrowing costs exceed long-term rates, this reflects bond market expectations of deteriorating economic conditions and historically precedes recessions by 12 to 24 months.
- Credit spread widening: The gap between corporate bond yields and risk-free government rates serves as a real-time measure of perceived default risk. Rapid spread widening typically signals that institutional investors are repricing systemic risk simultaneously.
- Collateral chain stress: In a highly leveraged system, the value of collateral underpins the ability to borrow. When collateral values decline, forced deleveraging can cascade through interconnected counterparty relationships far beyond the original point of stress.
- Sovereign bond dysfunction: When the market for government debt, normally the deepest and most liquid market in the world, begins exhibiting volatility and pricing anomalies, it signals that the foundation of the entire financial system is under strain.
In a financial system constructed on compounding debt and leverage, the relevant question for investors is rarely whether a correction will occur. It is whether they are positioned before the inflection point rather than scrambling to respond after it.
What History Tells Us About Gold and Silver During Financial Crises
Understanding how precious metals actually behave during systemic financial stress requires separating two distinct phases that most crises move through. Conflating these phases is one of the most common errors investors make when constructing crisis-resilient portfolios. The precious metals market outlook for 2025 and beyond reinforces the importance of understanding these distinctions before stress events materialise.
Phase One: The Liquidity Panic and the Initial Selloff
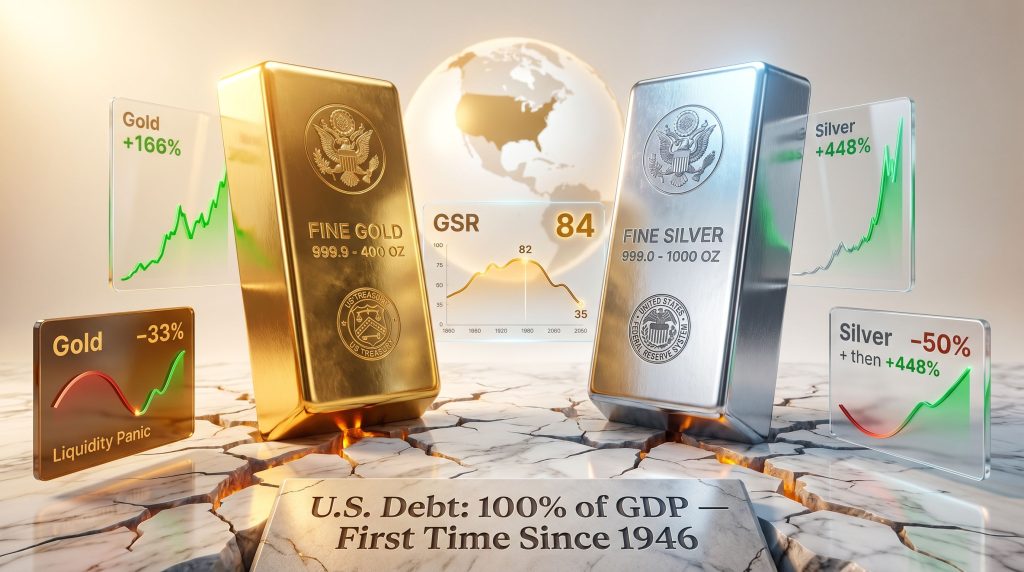
During the acute phase of the 2008 Global Financial Crisis, gold declined approximately 33% from its mid-year peak of roughly $1,000 per ounce to approximately $700 per ounce over a period of around seven months. Silver's contraction was considerably more severe, falling by more than 50% across the same period.
This behaviour surprises investors who purchase precious metals exclusively as crisis hedges, expecting immediate price appreciation when financial stress materialises. The mechanics, however, are straightforward. During acute liquidity panics, institutional investors do not discriminate between asset classes. They liquidate whatever is liquid to meet margin calls, satisfy redemption requests, and raise cash. Gold and silver, being highly liquid markets, become sources of emergency funding rather than safe havens in the first wave of selling.
Silver's underperformance relative to gold during this phase follows a consistent pattern. Its smaller market capitalisation, significant industrial demand exposure, and lower institutional liquidity buffers make it more susceptible to forced selling. Historically, silver has underperformed gold by a 2:1 to 3:1 ratio during pure liquidity events, a relationship that reflects market structure rather than any fundamental change in silver's monetary properties.
Phase Two: The Monetary Expansion Rally
The second phase of the 2008 crisis cycle tells a dramatically different story for precious metals investors. Following the acute panic, gold staged a 166% rally in under three years, reaching approximately $1,800 per ounce by 2011. Silver's recovery was far more explosive: a surge of approximately 448% over roughly 2.5 years, driven by retail investor participation, rising inflation expectations, and the collapse of the gold-silver ratio from its panic peak.
| Crisis Phase | Gold Performance | Silver Performance | Primary Driver |
|---|---|---|---|
| Acute Liquidity Panic (2008) | -33% over ~7 months | -50%+ over ~7 months | Forced liquidations, margin calls |
| Post-Crisis Monetary Expansion | +166% by 2011 | +448% over ~2.5 years | QE, fiat debasement, safe-haven demand |
| Gold-Silver Ratio (GSR) Movement | Baseline reference | GSR peaked ~82, fell to ~35 | Retail speculation, silver catch-up dynamics |
The fuel for both recoveries was the same: Federal Reserve balance sheet expansion at a pace that significantly outstripped underlying economic growth, M2 money supply growth accelerating well beyond GDP, and a broadly spreading loss of confidence in the purchasing power stability of fiat currencies. These are monetary phenomena, and they produced monetary responses. Furthermore, understanding gold and bonds dynamics across economic cycles helps contextualise why these recovery phases develop with such force.
The Geographic Dimension of Safe-Haven Demand
Not all financial crises generate equivalent precious metals responses. The 1982 Latin American debt crisis and the 1997 Asian financial crisis both produced initial gold price declines, as investors in those periods fled toward U.S. dollars as the primary reserve asset, effectively competing with gold for safe-haven capital flows.
Crises that originate within or directly implicate the U.S. financial system consistently generate stronger and more durable gold and silver rallies. When the reserve currency itself is under question, the alternatives that exist entirely outside the fiat monetary system become structurally more attractive. During the regional U.S. banking stress of early 2023, gold gained approximately 6.5% in the initial response phase while silver posted a more modest 3.2%, again consistent with the pattern of gold leading early and silver amplifying later.
The Core Macroeconomic Warning Signals Investors Should Monitor
Rising Bond Yields as a Systemic Stress Indicator
Sovereign bond yield movements are among the most consequential early-warning signals available to investors monitoring financial system health. The paradox of the current environment is that rising yields in a system carrying debt loads above 100% of GDP does not function the same way rising yields operated in lower-debt environments.
When debt servicing costs rise in a heavily indebted system, the fiscal multiplier reverses. Governments spend more on interest payments and less on productive expenditure. Higher borrowing costs compress the private sector simultaneously. The result is a self-reinforcing mechanism where the very medicine applied to control inflation, tighter monetary policy and higher rates, accelerates the stress it was designed to prevent.
Gold historically accelerates when bond market credibility deteriorates, because gold carries zero counterparty risk. Unlike a government bond, which is simultaneously the government's liability, physical gold is no one's obligation. This distinction becomes increasingly material as the counterparty chains running through the global financial system grow longer and more interconnected. Indeed, viewing gold as ultimate money provides a useful framework for understanding why this property becomes so critical during periods of systemic stress.
Equity Market Overvaluation: A Preparation Signal, Not a Timing Tool
The important distinction between valuation metrics and market timing is one of the most practically significant insights available to investors approaching an overvalued market. The NASDAQ bubble of 1999 to 2001 demonstrated with exceptional clarity how extreme valuations can persist far longer than rational models anticipate before rapid and severe mean reversion occurs.
Matthew Piepenburg, Partner at VON GREYERZ and author of Rigged to Fail, has noted through his macro analysis that the timing of a correction in overvalued markets matters considerably less than whether an investor is positioned appropriately before it occurs. Structural overvaluation is a preparation signal, not a market entry trigger.
The Debt-Leverage Spiral
The arithmetic of precious metals supply versus monetary expansion provides one of the most straightforward frameworks for understanding gold's long-term role as a debasement hedge. Global gold mine supply grows at approximately 1.5% to 2% per year, constrained by geology, capital expenditure cycles, and the multi-decade lead times required to bring new deposits into production. During crisis-response periods, central bank money supply expansions have repeatedly reached 20% or more within a single year.
This structural divergence between monetary metal supply growth and fiat currency supply growth is not a short-term phenomenon. It is a compounding arithmetic reality that strengthens the fundamental case for gold ownership over extended time horizons, independent of any specific geopolitical or macroeconomic event. In addition, central bank gold demand has emerged as a powerful structural tailwind reinforcing this dynamic.
How Gold and Silver Function Differently Within a Crisis Portfolio
Gold: Systemic Insurance and Monetary Anchor
Gold's primary portfolio function during periods of systemic stress is capital preservation rather than capital appreciation. Its role is to protect purchasing power when the fiat monetary system is under strain, not to generate the highest percentage return in the portfolio. Central banks worldwide have recognised this function by accumulating gold as net buyers consistently since 2010, reflecting an institutional-level concern about reserve currency stability that individual investors would be wise to consider. According to Sprott's analysis, gold has now overtaken dollar reserves in many central bank portfolios as global trust shifts away from traditional reserve currencies.
Physical gold's zero-counterparty-risk profile differentiates it fundamentally from bonds, equities, and bank deposits, all of which carry default risk of varying degrees. In an environment where counterparty chains extend across globally interconnected financial institutions, this property carries increasing value as systemic stress intensifies.
Silver: Amplified Upside With Higher Volatility
Silver's more complex crisis response profile stems from its dual identity as both a monetary metal and an industrial commodity. Its applications span electronics manufacturing, solar energy infrastructure, medical devices, and numerous industrial processes, creating a structural demand floor that pure monetary metals lack. This industrial demand component means silver does not respond to macro forces in the same linear fashion as gold.
Silver's smaller market capitalisation makes it considerably more susceptible to retail-driven price movements, which explains the dramatic asymmetry between its 448% post-GFC surge and gold's 166% over the same recovery period. A further dynamic that investors frequently overlook is the substitution effect: when gold prices reach elevated levels, retail and institutional investors increasingly rotate toward silver as a more accessible alternative, amplifying its price movements during recovery phases.
The Gold-Silver Ratio as a Strategic Positioning Tool
The gold-silver ratio analysis measures how many ounces of silver are required to purchase a single ounce of gold, functioning as a relative value indicator between the two metals that has demonstrated meaningful strategic utility across multiple market cycles.
| GSR Level | Historical Context | Implication |
|---|---|---|
| ~82 | 2008 crisis peak | Gold significantly outperforming silver; silver historically undervalued |
| ~35 | 2011 recovery trough | Silver significantly outperforming gold during monetary expansion |
| ~84 | Current levels (2026) | Historically elevated; consistent with pre-recovery positioning |
Investors who shifted capital from gold toward silver when the GSR peaked during the 2008 panic captured the majority of silver's subsequent 448% rally. The current GSR near 84 sits at historically elevated levels, consistent with the pre-recovery positioning observed in the 2008 cycle and suggesting that silver may be meaningfully undervalued relative to gold on a multi-year horizon.
A rising GSR signals gold is outperforming silver, typically occurring during acute panic phases. A falling GSR signals silver catching up, typically occurring during monetary expansion phases. Monitoring GSR inflection points provides a framework for timing rotation between the two metals across crisis cycles.
Does Geopolitical Conflict Drive Gold Prices, or Is It a Distraction?
Separating Event-Driven Noise from Structural Trend
Geopolitical events create identifiable but temporary disruptions to precious metals pricing. Middle East conflicts, trade escalations, and regional military developments consistently generate initial gold price spikes followed by partial retracements as the event-specific risk premium fades. This pattern is well-documented across decades of market data and reflects a genuine market mechanism rather than irrational behaviour.
Analysts examining the source material for gold's long-term secular direction consistently arrive at the same conclusion: geopolitical events influence the timing and magnitude of short-term moves, but the underlying secular trend is determined by monetary factors that operate on much longer timescales.
As Piepenburg has consistently argued through his work at VON GREYERZ and his widely followed macro reports published at SignalsMatter.com, Middle East conflict is distorting but not defining gold's ultimate price direction. The secular trajectory remains anchored to monetary dynamics. Consequently, investors who conflate event-driven spikes with structural trends risk misallocating capital at precisely the wrong moment.
What Actually Drives Gold's Long-Term Price Direction
Four structural forces determine gold's long-term secular direction:
- Monetary debasement: The rate at which central banks expand money supply relative to economic output is the single most powerful long-term determinant of gold's purchasing power appreciation.
- Real interest rates: When real yields (nominal rates minus prevailing inflation) are negative or near zero, the opportunity cost of holding non-yielding gold collapses, historically supporting gold price appreciation.
- Sovereign and institutional demand: Central bank net purchasing since 2010 has created a structural demand tailwind that operates independently of retail investor sentiment.
- Systemic trust erosion: As confidence in financial institutions, sovereign debt sustainability, and fiat currency stability declines, capital flows toward assets that exist outside the traditional financial system. Gold has historically been the primary beneficiary of this dynamic.
The next major ASX story will hit our subscribers first
What a Potential Systemic Crisis Looks Like for Precious Metals
Scenario Analysis: Three Macro Pathways
Given the range of macroeconomic conditions currently present, three broad scenarios frame the forward outlook for gold and silver. These scenarios are speculative and should not be interpreted as financial advice or reliable forecasts. Past crisis cycles provide historical context but do not guarantee future outcomes.
Scenario A: Controlled Slowdown (Base Case)
A gradual economic deceleration involving debt restructuring at manageable pace, central bank rate normalisation, and moderate recession. Gold maintains elevated levels supported by institutional demand. Silver consolidates. The GSR remains elevated in the 80 to 85 range without a dramatic expansion or compression.
Scenario B: Credit Market Dislocation (Elevated Risk Case)
Rising bond yields trigger sovereign debt stress in over-leveraged economies, producing a credit crunch that spreads through interconnected financial institutions. Gold accelerates as institutional capital seeks zero-counterparty-risk assets. Silver initially underperforms during the liquidity panic phase before staging a sharp recovery as monetary expansion follows. The GSR spikes above 85 to 90, then collapses as silver outperforms during the recovery.
Scenario C: Systemic Unwind (Tail Risk Case)
Cascading counterparty failures across leveraged financial institutions produce a crisis comparable to or exceeding the 2008 GFC in scale. Gold surges as the primary beneficiary of systemic trust collapse. Silver experiences extreme volatility, with a sharp initial decline followed by explosive recovery as the monetary policy response dwarfs previous interventions. Given current debt levels, the balance sheet expansion required to stabilise a crisis of this magnitude would likely be substantially larger than 2008, potentially amplifying subsequent precious metals rallies. Research examining how economic contractions affect precious metals provides further context for understanding these dynamics.
| Scenario | Gold Outlook | Silver Outlook | GSR Direction |
|---|---|---|---|
| Controlled Slowdown | Stable/Elevated | Consolidation | Elevated, stable |
| Credit Market Dislocation | Strong upside | Volatile, then strong rally | Spike then fall |
| Systemic Unwind | Explosive upside | Sharp drop, then major surge | Peak above 85-90, then collapse |
Frequently Asked Questions: Gold, Silver and Financial Crisis Dynamics
Does gold always rise during a financial crisis?
Not immediately. During the acute liquidity phase, gold often declines alongside other assets as investors liquidate everything to raise cash. The 2008 GFC saw gold fall approximately 33% before a subsequent 166% recovery. The critical distinction is between short-term liquidity dynamics and medium-term monetary dynamics. Understanding the full arc of gold silver and the global financial crisis behaviour across both phases is essential for effective positioning.
Why does silver fall harder than gold in a crisis but recover more strongly?
Silver's smaller market capitalisation, industrial demand exposure, and lower institutional liquidity make it more vulnerable to forced selling during panic phases. These same characteristics, combined with retail accessibility and the substitution effect when gold reaches elevated price levels, drive its amplified recovery. The asymmetry between silver's 448% post-GFC surge and gold's 166% illustrates this dynamic clearly.
What is the gold-silver ratio and why does it matter for investors?
The GSR measures how many ounces of silver are required to purchase one ounce of gold. Historically, a GSR above 80 suggests silver is undervalued relative to gold and has often preceded periods of significant silver outperformance. The GSR peaked near 82 during the 2008 panic before falling to approximately 35 as silver dramatically outperformed in the recovery. Current levels near 84 are historically elevated.
Are rising bond yields necessarily negative for gold?
Not necessarily. The critical variable is real yields rather than nominal yields. When inflation exceeds nominal rates, producing negative real yields, gold historically performs strongly. Additionally, rising yields in a heavily indebted system signal systemic stress independently, which supports gold demand through the safe-haven channel even when nominal yields are rising.
How should investors think about allocating between gold and silver during a crisis?
Gold offers more stable capital preservation during acute panic phases given its deeper liquidity and institutional demand characteristics. Silver offers amplified upside during recovery phases fuelled by monetary expansion. A strategic framework involves holding gold as core systemic insurance while monitoring the GSR for rotation opportunities into silver during peak panic phases when the ratio is historically elevated. According to financial crisis gold research, this two-phase approach has historically produced superior risk-adjusted outcomes compared with static allocation strategies.
Key Takeaways: Positioning Precious Metals Within a Macro Risk Framework
The convergence of elevated sovereign debt, stretched equity valuations, rising bond yields, and a historically high gold-silver ratio creates a macro backdrop with clear historical precedent. Understanding how gold and silver have actually behaved across previous crisis cycles, rather than how investors assume they behave, is the foundation of effective precious metals positioning. Gold silver and the global financial crisis represent one of the most instructive relationships in modern financial history, precisely because the lessons are so frequently misunderstood.
The most important insights from this analysis:
- Two-phase crisis behaviour: Precious metals typically decline in acute liquidity panics before staging powerful recoveries during monetary expansion phases.
- Gold leads, silver amplifies: Gold provides more stable early-phase protection; silver delivers larger percentage gains in recovery phases.
- The GSR as a rotation signal: A GSR above 80 historically signals silver undervaluation and potential future outperformance. Current levels near 84 are consistent with pre-recovery positioning.
- Monetary debasement as the structural driver: Geopolitical events create short-term noise; long-term monetary expansion driven by central bank balance sheet growth and debt accumulation creates the secular case for both metals.
- Preparation matters more than prediction: The timing of a systemic event is less important than whether an investor is positioned before it occurs.
- Supply mathematics reinforce the long-term case: Gold supply growing at 1.5% to 2% per year cannot keep pace with monetary systems capable of expanding by 20% or more during crisis-response periods.
Precious metals are not speculative assets in a crisis environment. They are structural hedges against the erosion of monetary system credibility. Their value proposition strengthens precisely when confidence in debt-based financial systems weakens, and the architecture of those systems has rarely carried more visible structural vulnerabilities than it does today.
This article is intended for informational and educational purposes only and does not constitute financial advice. All investment decisions should be made in consultation with a qualified financial adviser. Forward-looking scenarios and projections involve inherent uncertainty and should not be relied upon as predictions of future market behaviour. Past performance of gold, silver, and financial markets does not guarantee future results.
Want To Identify The Next Major Mineral Discovery Before The Broader Market Does?
Discovery Alert's proprietary Discovery IQ model delivers real-time alerts on significant ASX mineral discoveries, transforming complex mineral data into actionable insights for both short-term traders and long-term investors. Explore historic discoveries and their exceptional returns, then begin your 14-day free trial at Discovery Alert to position yourself ahead of the market.