July 16, 2026
The War Premium That Shook Global Energy Markets
Energy markets have an uncomfortable relationship with geography. Unlike most commodities, crude oil moves through a handful of narrow maritime passages that act as irreplaceable pressure points for global supply. When those passages are threatened, the consequences ripple far beyond the trading floor, embedding themselves into household budgets, central bank models, and the broader machinery of global inflation.
The conflict that disrupted the Strait of Hormuz beginning in late February 2026 was a case study in exactly this dynamic. Over three and a half months, the world watched a single chokepoint reshape oil pricing, inflation trajectories, and monetary policy decisions across multiple continents. The subsequent US Iran deal and oil prices narrative that emerged in mid-June became one of the most consequential macro stories of the year.
When big ASX news breaks, our subscribers know first
Why the Strait of Hormuz Functions as a Global Energy Pressure Valve
The Physics of an Irreplaceable Chokepoint
The Strait of Hormuz sits between Iran to the north and Oman to the south, narrowing to roughly 21 nautical miles at its tightest navigable point. Through this corridor flows approximately 20% of the world's crude oil supply, alongside a substantial share of global liquefied natural gas exports. What makes it uniquely consequential is the absence of any practical detour: Persian Gulf exporters including Saudi Arabia, Iraq, Kuwait, and the UAE have no viable alternative deepwater exit route that could absorb anything close to normal volumes.
The pipeline alternatives that do exist, such as Saudi Arabia's East-West Pipeline to Yanbu on the Red Sea coast, have combined capacity well below total Gulf export volumes and carry their own logistical and geopolitical constraints. In practice, if Hormuz closes, a significant portion of global crude supply simply cannot reach markets in sufficient quantities. Understanding the interplay of oil trade and geopolitics is essential context for grasping why this single waterway exerts such outsized influence on global pricing.
What Three and a Half Months of Disruption Actually Cost
The conflict that began in late February 2026 demonstrated precisely what happens when that pressure valve is threatened. Oil prices surged from pre-conflict baselines to a peak above US$120 per barrel during the height of hostilities. The pricing mechanism behind this spike was not just reduced physical throughput: it was the compounding effect of multiple simultaneous risk factors layered onto the same narrow waterway.
Tanker operators faced:
- Naval blockade enforcement raising transit risk and delay costs
- Mine and drone threats requiring route modifications and slower transit speeds
- Marine insurance underwriters dramatically repricing war risk premiums for vessels transiting the region
- Cargo owners absorbing higher freight rates passed through by carriers
These costs cascaded outward. Higher crude prices fed into refined product costs, which fed into transport fuel prices globally, which fed into consumer price indices measured by central banks. An event in a 21-nautical-mile waterway in the Persian Gulf was, within weeks, visible in fuel bills across Australia, Europe, and Asia.
Unpacking the US Iran Deal and Oil Prices Response
What the Agreement Actually Covers
Over the weekend preceding June 18, 2026, the US and Iran reached a verbal agreement structured around three core elements: toll-free transit rights through the Strait of Hormuz, removal of the US naval blockade, and a multi-front ceasefire that included Lebanon. A formal signing ceremony was scheduled in Switzerland for Friday June 19, with a 60-day negotiation window to follow covering the more complex questions of sanctions relief and Iran's nuclear programme.
Several important caveats apply to how investors and analysts should interpret this agreement:
- The full text of the agreement had not been publicly released as of the announcement date
- Implementation timelines remain contingent on the formal signing proceeding as planned
- The 60-day negotiation phase leaves substantial unresolved questions on both sides
- Physical security infrastructure, including mines, drone capabilities, and missile systems, does not disappear with a diplomatic announcement
The Immediate Market Reaction by the Numbers
Financial markets responded decisively to the news, with the clearest signal visible in crude benchmarks. According to reporting from Investopedia, stock futures surged while oil prices fell sharply on the announcement:
| Benchmark | Peak (Conflict Period) | Post-Deal Level | Approximate Monthly Decline |
|---|---|---|---|
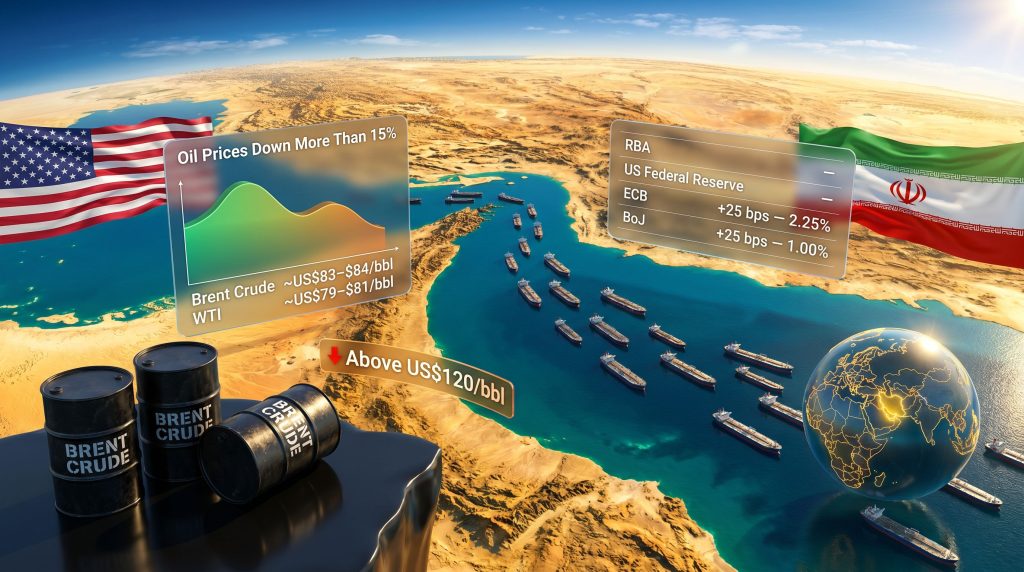
| Brent Crude | Above US$120/bbl | ~US$83-84/bbl | More than 15% |
| WTI Crude | Above US$120/bbl | ~US$79-81/bbl | More than 15% |
The oil price decline was accompanied by a broader risk-on rotation: equities rallied, bond yields fell, and the US dollar softened. This combination reflected markets unwinding the war risk premium simultaneously across multiple asset classes.
However, a critical detail sits within these numbers. Prices remained above pre-conflict levels, meaning markets had not fully restored confidence. The residual premium reflects rational uncertainty: tanker operators and marine insurers have institutional memory of prior ceasefire announcements that failed to hold, and they require sustained evidence of safe transit before normalising their risk models.
Why Shipping Confidence Lags the Diplomatic Signal
This gap between diplomatic announcement and commercial reality is one of the less-discussed dynamics of geopolitical oil shocks. The marine insurance market operates on its own evidence threshold. War risk premiums, once activated for a specific geographic zone, are not removed the moment a ceasefire is announced. Underwriters require:
- Verified passage of vessels through the zone without incident over a sustained period
- Confirmation that physical hazards such as mines have been cleared or neutralised
- Evidence that relevant military assets have been stood down or repositioned
This means that even a fully successful diplomatic agreement translates into weeks or months of gradual shipping cost normalisation rather than an immediate return to pre-conflict tanker economics. Analysts broadly expect that normal tanker traffic flows through Hormuz may take weeks or months to fully restore, a timeline that matters significantly for how quickly lower crude prices translate into real-world energy cost relief.
The Consumer Fuel Price Question: Relief Is Real But Lagged
How Crude Prices Travel to the Petrol Pump
The relationship between crude benchmarks and retail fuel prices is not direct or immediate. The journey from a Brent or WTI futures price to the figure on a petrol station forecourt involves several stages, each introducing its own timing delay:
- Crude purchase and shipping to the refinery destination (days to weeks depending on origin)
- Refinery processing converting crude into refined products including petrol, diesel, and jet fuel
- Product distribution through terminals, pipelines, and road tankers to retail sites
- Retail pricing decisions by fuel retailers, who may absorb or pass through movements at different speeds depending on competitive dynamics and inventory positions
Regional fuel tax structures and currency movements add further complexity. Australian fuel prices, for instance, incorporate an excise component that is fixed in dollar terms, meaning it represents a larger percentage of the total price when underlying costs fall, dampening the proportional relief consumers experience.
For Australian households, whose consumer sentiment had fallen to multi-decade lows during the conflict period, the direction of travel from lower crude prices is structurally positive. The practical expectation should be a lagged benefit: the most meaningful fuel price relief will likely appear in data releases several weeks after the deal demonstrates durability, rather than immediately at the pump.
Central Banks: What Cheaper Oil Does and Does Not Fix
The Monetary Policy Landscape Heading Into Mid-June
The fuel price shock from the Hormuz conflict had been one of the most direct contributors to the inflation challenge facing central banks through the first half of 2026. Higher energy costs are particularly problematic for monetary policymakers because they are simultaneously supply-side and pervasive, flowing into virtually every cost category in the economy. Furthermore, the broader market volatility reset across gold and bond markets during this period compounded the difficulty for policymakers attempting to read underlying economic conditions.
Against this backdrop, both the Reserve Bank of Australia and the US Federal Reserve held interest rates unchanged at their most recent meetings, with both institutions signalling that the inflation trajectory remains the dominant variable in their decision frameworks. The critical context is that markets are still pricing in a greater than 50% probability of rate hikes from both central banks before year-end, meaning the deal alone has not materially shifted the policy calculus. Assessments of inflation projections from the Fed have consistently reinforced this cautious stance.
Global Monetary Policy Divergence in Context
While the RBA and Fed held steady, the broader global tightening cycle continued during the same period:
| Central Bank | Recent Decision | Current Rate | Context |
|---|---|---|---|
| RBA (Australia) | Hold | Unchanged | Monitoring inflation evolution |
| US Federal Reserve | Hold | Unchanged | Inflation watch; hike probability above 50% |
| European Central Bank | +25 bps hike | 2.25% | First hike since 2023 |
| Bank of Japan | +25 bps hike | 1.00% | Highest policy rate since 1995 |
The ECB and Bank of Japan decisions are particularly instructive. Both institutions hiked into an inflationary environment that the Hormuz deal may now begin to unwind. If oil prices stabilise at materially lower levels, central banks that tightened into the energy price shock may find the inflation impulse they were responding to partially self-correcting, creating a different calculus for subsequent decisions.
What Lower Oil Prices Can and Cannot Deliver for Rate Policy
Lower crude benchmarks reduce near-term headline inflation pressure in a measurable way, creating breathing room for central banks that are otherwise inclined to hold. However, there are clear limits to what falling oil prices can accomplish within a broader inflationary environment:
- Services inflation is driven by wages and domestic demand, not energy prices, and remains elevated in both Australia and the United States
- Core price pressures excluding energy have demonstrated persistence that oil price movements alone cannot address
- Labour market tightness in Australia continues to support the wage growth that underpins domestic inflation
The Australian CPI release for May (scheduled June 24) will reflect fuel costs largely from before the mid-June oil pullback, meaning the statistical benefit of cheaper energy will not be visible in this particular data point. The June 25 Labour Force data carries equal weight for the RBA: a persistently tight employment market sustains the argument for rates remaining elevated regardless of what happens to crude.
The May CPI print is essentially a backward-looking snapshot of an inflationary environment that the Hormuz deal has begun to change. The real test for central bank positioning comes in the subsequent monthly and quarterly reads, when lower energy costs will have had time to work through the pipeline.
Geopolitical Fault Lines That Could Reverse the Oil Price Relief
The Fragility Built Into the Current Agreement
Several structural vulnerabilities in the current deal framework deserve attention from investors positioning around the US Iran deal and oil prices dynamic. In addition, the trade war impact on oil remains a parallel risk that could compound any breakdown in the Hormuz agreement:
- The ceasefire encompassed Lebanon, but Israeli and Hezbollah forces were still exchanging strikes at the time of the announcement, creating an active contradiction within the agreement's scope
- Israeli Prime Minister Netanyahu publicly acknowledged divergence with the US position on deal terms, introducing a known point of potential breakdown
- The 60-day negotiation window on sanctions and nuclear questions represents a sustained period during which the fragile initial agreement must hold without the benefit of resolved underlying disputes
Furthermore, OPEC's market influence adds another layer of complexity, as the cartel's production decisions will interact with any supply normalisation flowing from the Hormuz reopening.
Three Scenarios for the Weeks Ahead
Scenario 1: Deal Holds and Flows Normalise
Formal signing proceeds on June 19, tanker operators gradually resume Hormuz transit over the following weeks, marine insurance costs decline, and oil prices stabilise in the US$75-85 per barrel range. Inflation relief materialises in Q3 data readings, giving central banks sufficient cover to hold rates through the remainder of 2026. This scenario represents the most constructive outcome for energy-intensive sectors and inflation-sensitive households.
Scenario 2: Partial Implementation with Persistent Uncertainty
The signing proceeds but ongoing security concerns keep tanker operators cautious for one to three months. Oil prices trade in a volatile US$80-95 range as residual risk premiums are only partially unwound. Central banks maintain a hawkish bias with rate hike probability staying above 50% through year-end.
Scenario 3: Deal Collapses or Re-escalation
Hormuz transit disruptions resume, the war risk premium returns rapidly to crude pricing, and oil retests or exceeds prior highs above US$100-120 per barrel. Central banks face a genuinely difficult stagflationary scenario: rising inflation from energy costs combined with slowing growth from the broader economic shock. Analysis from CBS News highlights that markets remain acutely sensitive to any signals of deal fragility.
The next major ASX story will hit our subscribers first
Investment Implications: Reading the Signal Across Asset Classes
Energy Sector Equities Face a Recalibration
The fall in crude prices has driven underperformance in energy sector stocks in the near term, as revenue expectations for oil producers are revised downward from conflict-period highs. This creates a nuanced environment for investors:
- Integrated oil majors face margin compression if prices stabilise materially below the US$100+ levels that defined conflict-period revenue expectations
- ASX-listed energy producers with significant oil exposure are particularly sensitive to sustained moves below US$85 per barrel, as project economics and capital allocation decisions are recalibrated
- Exploration-stage companies with higher cost structures face the sharpest earnings pressure in a normalising price environment
The Beneficiaries of Lower Energy Costs
Lower oil prices create a structural tailwind for energy-intensive sectors that struggled during the conflict period:
- Airlines and logistics operators, where fuel represents a significant share of operating costs
- Manufacturing and industrials, where energy is a direct input cost
- Consumer discretionary, where household fuel savings increase discretionary spending capacity
- Transport and freight, where diesel cost relief flows directly to operating margins
The broader market context reinforces this picture. The oil price decline has coincided with equity market rallies, falling bond yields, and a softer US dollar: a classic risk-on rotation that reflects markets pricing a more benign inflation outlook, at least conditionally on the deal holding.
Key Dates and Watchpoints for Investors
The following events represent the most consequential near-term signposts for assessing how the US Iran deal and oil prices story develops:
| Date | Event | What to Watch |
|---|---|---|
| June 19 | Formal Hormuz Signing, Switzerland | Whether signing proceeds; full text release; tanker response |
| Ongoing | Ceasefire durability monitoring | Lebanon front activity; US-Israel alignment on deal terms |
| June 24 | Australian CPI (May) | Elevated fuel costs will likely still weigh; relief in later prints |
| June 25 | Australian Labour Force Data (May) | Tight labour market sustains case for higher rates |
Frequently Asked Questions: US-Iran Deal and Oil Prices
Why did oil prices fall after the US-Iran deal was announced?
Markets interpreted the agreement as removing the primary supply disruption risk from the Strait of Hormuz, through which approximately 20% of global crude oil flows. Traders unwound the war risk premium that had driven prices above US$120 per barrel during the conflict, causing Brent and WTI to fall by more than 15% within the month of June 2026.
How much have oil prices dropped since the deal was announced?
Brent crude declined to approximately US$83-84 per barrel and WTI to approximately US$79-81 per barrel following the announcement. Both benchmarks remain above pre-conflict levels, reflecting residual market uncertainty rather than full confidence in the deal's durability.
Will petrol prices fall because of the US-Iran deal?
Crude price reductions take time to work through to retail fuel prices due to refinery processing timelines, distribution lags, regional tax structures, and retailer pricing decisions. Analysts broadly expect that fuel prices will not return to pre-conflict levels quickly, even if the deal holds and crude benchmarks stabilise at lower levels.
What does the deal mean for the RBA and Australian interest rates?
Lower oil prices reduce near-term inflationary pressure, giving the RBA some additional flexibility to hold rates steady. However, markets are still pricing in more than a 50% probability of an RBA rate hike before year-end, as the US Iran deal and oil prices alone do not resolve underlying domestic inflation dynamics or labour market tightness.
What are the main risks that oil prices could rise again?
The primary risks include the formal agreement failing to be signed or implemented, a resumption of hostilities in Lebanon or elsewhere in the region, tanker operators refusing to resume Hormuz transit due to ongoing physical security concerns, or a breakdown in the 60-day negotiations covering sanctions and nuclear questions.
How does the Strait of Hormuz affect global oil supply?
The Strait of Hormuz is the single most critical maritime energy chokepoint in the world. Approximately 20% of global crude oil, along with a significant share of liquefied natural gas, transits this narrow passage between Iran and Oman. There is no practical alternative route for most Persian Gulf exporters at anywhere near current volumes, making any meaningful disruption immediately consequential for global energy pricing.
This article is general in nature and does not constitute financial advice. Readers should consider whether the information is appropriate to their personal circumstances and, where appropriate, seek independent professional advice from a qualified financial adviser. Past market behaviour is not a reliable indicator of future outcomes. SelfWealth Pty Ltd ABN 52 154 324 428 (AFSL 421789).
Readers seeking further analysis of how geopolitical events shape global energy markets and central bank policy can explore ongoing market commentary at the SelfWealth Insights Blog, which covers market-moving developments from an Australian investor perspective.
Want to Identify the Next Major ASX Discovery Before the Market Does?
While geopolitical shocks reshape global energy prices, Discovery Alert's proprietary Discovery IQ model scans ASX announcements in real time, delivering instant alerts on significant mineral discoveries across more than 30 commodities — turning complex data into actionable opportunities the moment they emerge. Explore historic examples of major discoveries and their market returns, then start your 14-day free trial at Discovery Alert to position yourself ahead of the broader market.