June 21, 2026
The Slow Drain Nobody Talks About: Inflation, Hard Assets, and the Case for Precious Metals
Most investors spend their time worrying about the wrong risks. Market crashes make headlines, recessions trigger panic, and geopolitical crises dominate financial news cycles. But the risk that quietly compounds in the background, year after year, is one that rarely gets the attention it deserves: the steady, relentless erosion of purchasing power through inflation.
Understanding this erosion is not just an academic exercise. It is the foundation of any rational long-term wealth strategy, and it is why gold and silver as an inflation hedge have remained relevant for centuries, even as entire monetary systems have been rebuilt around them.
When big ASX news breaks, our subscribers know first
Understanding What Inflation Actually Does to Wealth Over Time
The numbers are more confronting than most people realise. Cumulative U.S. inflation since 2020 is estimated at somewhere between 25% and 30%, depending on the methodology used. A basket of goods that cost $100 in 2020 now costs at least $125. Critically, the categories of spending that have risen above that average baseline are the ones that matter most to everyday households: food, energy, and housing.
The U.S. Bureau of Labor Statistics provides an inflation calculator that illustrates the longer arc of this problem. $1,000 in the year 2000 now carries the equivalent purchasing power of roughly $2,000, meaning the dollar has lost approximately half its value over roughly 25 years. The important caveat here is that this backward-looking calculator reflects an era of historically subdued inflation, generally running between 1.5% and 2.5% annually. Today's elevated inflation regime is structurally more damaging than that historical baseline implies.
What a 4% Sustained Inflation Rate Does to $1,000 Over 25 Years
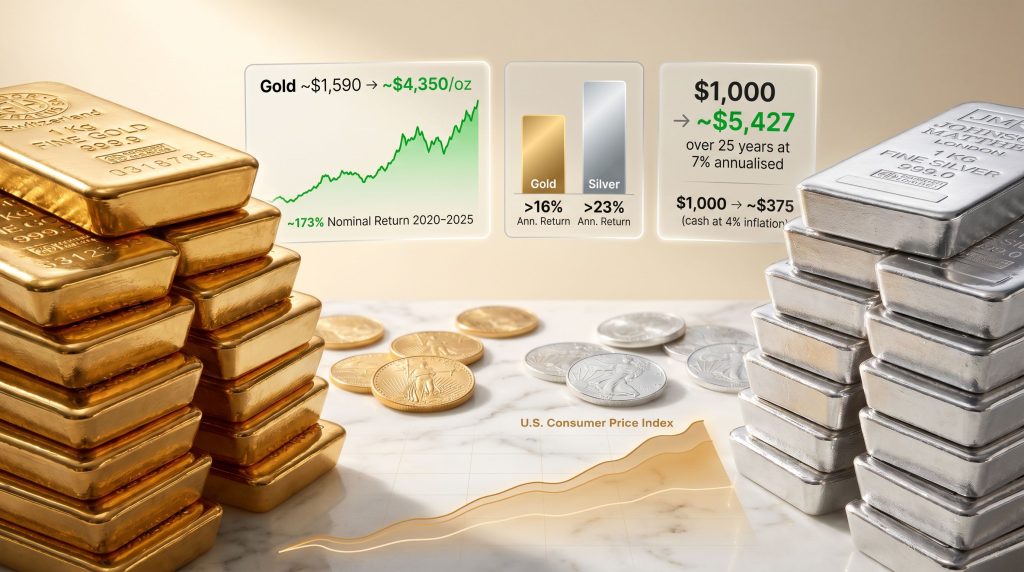
Running a straightforward scenario model clarifies the stakes involved. If $1,000 is held in cash over 25 years at a sustained 4% annual inflation rate, the real purchasing power of that savings falls to approximately $375. To simply break even and preserve the original standard of living, that same $1,000 needs to nominally grow to approximately $2,666 over the same period.
This creates a structural reality that passive savers rarely acknowledge: holding cash is not a neutral strategy. It is a guaranteed path to wealth destruction in any meaningful inflationary environment.
| Scenario | Starting Value | 25-Year Real Purchasing Power Outcome |
|---|---|---|
| Cash held at 4% inflation | $1,000 | ~$375 |
| Break-even threshold required | $1,000 | ~$2,666 |
| Precious metals at 7% annual return | $1,000 | ~$5,427 |
The mathematics of compounding inflation are asymmetric. Modest annual inflation rates produce dramatic long-term wealth erosion, yet the damage feels invisible in any given year, which is precisely why so few investors treat it with appropriate urgency.
Inflation has also proven far stickier than many policymakers anticipated. The U.S. Federal Reserve has maintained a 2% inflation target for an extended period, yet 2024 delivered a CPI average of approximately 2.9%, and subsequent data has trended higher rather than lower. According to Investopedia's inflation hedge overview, a sustained return to target remains elusive, which reinforces the relevance of inflation-resistant asset classes.
Hard Assets: Why Physical Value Outlasts Financial Sentiment
The concept of a hard asset is straightforward but frequently misunderstood in its application. Hard assets are physical, tangible resources whose value derives from intrinsic utility, material scarcity, or raw composition, rather than from forward earnings projections, debt-financed growth stories, or market sentiment cycles.
This distinction becomes especially important during inflationary periods, when the real value of financial claims can deteriorate faster than investors recognise. Equities, for instance, carry significant debt exposure within their valuations. A meaningful market washout during a period of elevated inflation can compress both nominal and real returns simultaneously, leaving portfolios doubly exposed.
Hard assets span several categories:
- Precious metals including gold, silver, and platinum
- Real estate across residential, commercial, and agricultural forms
- Productive infrastructure such as machinery, energy assets, and farmland
Each of these categories has inflation-hedging characteristics, but they differ meaningfully in terms of practical utility for most investors.
How Precious Metals Compare to Other Hard Asset Classes
| Asset Class | Portability | Ongoing Costs | Liquidity | Inflation Track Record |
|---|---|---|---|---|
| Gold and Silver | High | Minimal | Global, deep market | Strong over long-term |
| Real Estate | Low | Ongoing maintenance and taxes | Moderate | Strong, with tax advantages |
| Machinery and Equipment | Very Low | High (depreciation) | Limited | Moderate |
| Equities | High | Minimal | High | Mixed, inflation-sensitive |
What places gold and silver in a unique position within the hard asset universe is the combination of characteristics they carry simultaneously. Unlike real estate, bullion can be moved across borders. Unlike machinery, it carries no depreciation or maintenance burden. And unlike equities, its value does not rest on quarterly earnings, management decisions, or debt covenant compliance. A deeply liquid global market ensures gold and silver can be converted into goods, services, or currencies across virtually any jurisdiction in the world.
Gold and Silver Performance Since 2020: What the Numbers Reveal
The post-2020 period has provided a real-world stress test of how precious metals perform against sustained inflationary pressure, and the results are striking.
Gold entered 2020 priced at approximately $1,590 per troy ounce. As of mid-2025, it trades near $4,350 per troy ounce, representing a nominal return of approximately 173% over that period. Against cumulative inflation of 25% to 30%, gold as an inflation hedge has delivered a substantial positive real return, not merely kept pace.
Silver's performance over the same window is even more pronounced in raw return terms. Starting near $18 per troy ounce in January 2020 and now trading around $70 per troy ounce, silver has delivered a nominal return of approximately 288%. The annualised return figures are equally compelling: gold has exceeded 16% annually since 2020, while silver has exceeded 23% annually over the same period.
A Side-by-Side Performance Comparison
| Metric | Gold | Silver |
|---|---|---|
| Price (January 2020) | ~$1,590/oz | ~$18/oz |
| Price (Mid-2025) | ~$4,350/oz | ~$70/oz |
| Nominal Return (2020-2025) | ~173% | ~288% |
| Annualised Return | Over 16% | Over 23% |
| Inflation Hedge Consistency | Strong and reliable | Mixed, regime-dependent |
| Primary Price Driver | Monetary demand, safe-haven flows | Inflation plus industrial demand |
| Volatility Profile | Moderate | Higher |
It is worth noting that both metals were already outpacing inflation before the post-2020 surge. Gold's pre-2020 annualised return was estimated at between 7% and 9%, during a period when annual inflation was running between 1.5% and 2.5%. That baseline performance provides a more durable foundation for long-term return expectations than the exceptional recent surge alone.
Gold as an Inflation Hedge: Strengths and Limitations
Academic research and institutional analysis broadly align on a consistent conclusion: gold is the more reliable long-term inflation hedge of the two primary precious metals. This is largely because gold's pricing is driven predominantly by monetary demand and safe-haven flows, rather than by fluctuating industrial cycles. Furthermore, understanding gold as an inflation hedge helps clarify why institutional portfolios continue to prioritise it during periods of sustained monetary pressure.
Gold's effectiveness as a hedge strengthens specifically in environments where currency purchasing power faces sustained, structural pressure, which is precisely the regime that has characterised the post-pandemic global economy. Its global liquidity ensures that holders face minimal friction in converting positions into other currencies or goods at any point in time.
However, gold's short-term hedging performance is less consistent than its long-term record. In environments where central banks are raising interest rates aggressively, the opportunity cost of holding a non-yielding asset like gold increases, which can create short-term price headwinds even as underlying inflation remains elevated. This is an important nuance for investors who measure performance over months rather than decades.
Gold is most accurately understood as a multi-decade monetary insurance instrument, not a short-term speculative trade. Measuring its effectiveness over a 12-month window fundamentally misaligns with the core value proposition it delivers.
Consequently, the gold safe-haven investment case becomes most compelling not in response to short-term volatility, but as a structural component of any long-duration wealth preservation strategy.
Silver's Dual-Use Dynamic: Higher Returns, Higher Complexity
Silver presents a more complex hedging profile than gold, and understanding that complexity is essential before building a meaningful position. Unlike gold, silver's dual role as both a monetary metal and an industrial commodity introduces a layer of price sensitivity that gold simply does not carry.
Industrial sectors including solar photovoltaic manufacturing, consumer electronics, electric vehicle components, and medical applications account for a significant portion of annual global silver demand. This dual-use dynamic means that during periods of strong economic expansion, rising industrial demand can amplify silver's price performance beyond what monetary factors alone would justify. During economic contractions, however, falling industrial activity can suppress silver prices even when inflationary pressures remain elevated.
This makes silver's inflation-hedging characteristics regime-dependent in a way that gold's are not. The conditions of the 2020 to 2025 period, combining persistent inflation with accelerating industrial demand driven by the clean energy transition, created an unusually favourable environment for silver on both fronts simultaneously.
When Silver Tends to Outperform
Several conditions historically correlate with stronger silver performance:
- Simultaneous inflation and industrial demand expansion, as seen throughout much of the post-2020 period
- Elevated Gold-to-Silver ratios, which have historically preceded periods of silver catching up toward gold's relative performance — a dynamic explored in detail through gold-silver ratio analysis
- Monetary easing cycles, which reduce the opportunity cost of holding non-yielding assets while typically stimulating broader commodity demand
For investors seeking asymmetric upside within a precious metals allocation, silver offers genuine return potential. That upside, however, is paired with asymmetric downside risk, and this balance must be explicitly considered within any portfolio construction framework.
The next major ASX story will hit our subscribers first
Building a Precious Metals Allocation: Strategic Framework
The most common error investors make when approaching gold and silver is measuring performance through a short-term lens. Tracking how gold has moved over six months, or speculating on silver's performance over the next calendar year, is structurally misaligned with the fundamental value proposition these metals deliver.
The correct analytical frame is a multi-decade wealth preservation lens. The relevant question is not what gold will do in the next 12 months, but how a combined allocation to gold and silver as an inflation hedge protects real purchasing power across the next 20 to 30 years.
Returning to the scenario mathematics: a conservative 7% annualised return on a gold and silver position, which sits at the lower end of the pre-2020 historical range for gold alone, would grow $1,000 to approximately $5,427 over 25 years. That figure more than doubles the ~$2,666 required simply to break even against 4% sustained inflation. It is not a speculative outcome; it reflects the low end of documented historical performance for these assets.
Portfolio Construction Considerations
- Overall allocation range: Financial planning frameworks commonly suggest a 5% to 15% portfolio allocation to precious metals for inflation hedging purposes, though individual risk tolerance and time horizons will vary
- Gold as the core position: Given its more consistent hedging characteristics and lower volatility, gold typically forms the primary allocation within a precious metals position
- Silver as a satellite position: Silver's higher volatility and elevated return potential make it appropriate as a smaller, complementary allocation for investors with higher risk tolerance and longer time horizons
- Physical vs. paper exposure: Considering physical gold vs ETFs is essential — physical bullion provides direct inflation protection without counterparty risk, whereas ETFs, futures, and mining equities introduce additional layers of risk that must be evaluated separately
- Avoiding black swan dependency: Building a precious metals position on the expectation of geopolitical crises or financial system shocks introduces significant timing and sentiment risk. The more durable thesis rests on structural inflation persistence, long-run monetary debasement, and fundamental metal scarcity
Frequently Asked Questions: Gold and Silver as an Inflation Hedge
Is gold or silver a better inflation hedge?
Gold is the more reliable and consistent inflation hedge of the two. Because its price is primarily driven by monetary demand and safe-haven flows, it maintains more predictable hedging characteristics across different economic regimes. Silver can also provide inflation protection but is more volatile and less reliable as a standalone hedge because industrial demand introduces a significant additional variable into its pricing.
How much have gold and silver returned since 2020?
From January 2020 to mid-2025, gold has delivered approximately 173% in nominal terms, moving from roughly $1,590 to around $4,350 per ounce. Silver has returned approximately 288%, moving from roughly $18 to around $70 per ounce. Both returns substantially outpace the cumulative inflation of 25% to 30% over the same period.
What percentage of a portfolio should be in gold and silver?
Many established financial planning frameworks suggest a 5% to 15% allocation to precious metals as an inflation hedge, though the right figure depends on individual goals, time horizon, and risk tolerance. Gold typically forms the larger portion of this allocation, with silver serving as a higher-volatility complement. Research from Bullion Vault's gold inflation analysis supports a similar range for long-term investors seeking structural purchasing power protection.
Does gold protect against inflation in the short term?
Gold's short-term hedging performance is less consistent than its long-term record. Rising interest rate environments can create short-term headwinds for gold. Its most reliable inflation-protection characteristics emerge over multi-year and multi-decade timeframes, reinforcing the importance of holding perspective across the full investment horizon.
What makes gold and silver different from other hard assets as inflation hedges?
Gold and silver combine the portability and low maintenance costs of financial instruments with the intrinsic scarcity-based value of physical commodities. Unlike real estate, they can be moved freely across borders. Unlike machinery, they carry no depreciation. And unlike equities, their value does not depend on corporate debt levels, management execution, or earnings cycles. This combination of characteristics places them in a uniquely useful position within any inflation-protection strategy.
Key Takeaways: The Strategic Case for Precious Metals in an Inflationary Era
- Sustained inflation at 4% annually reduces $1,000 in purchasing power to approximately $375 over 25 years, making passive saving structurally equivalent to wealth destruction
- Gold has delivered an annualised return exceeding 16% since 2020; silver has exceeded 23% annually over the same period, with both substantially outpacing cumulative inflation
- Gold is the more consistent inflation hedge; silver is a higher-return, higher-volatility complement whose performance is sensitive to industrial demand cycles
- Even before 2020, gold's annualised return of 7% to 9% comfortably outpaced the 1.5% to 2.5% inflation environment of that era, demonstrating structural long-run outperformance rather than a recent anomaly
- The correct analytical framework for precious metals is long-term wealth preservation across decades, not short-term price speculation driven by geopolitical events or policy announcements
- A conservative 7% annualised return on a precious metals position would grow $1,000 to approximately $5,427 over 25 years, far exceeding the $2,666 required simply to preserve purchasing power against sustained 4% inflation
This article is intended for educational and informational purposes only and does not constitute financial advice. Past performance of any asset class, including gold and silver, does not guarantee future results. Investors should conduct their own research and consult a qualified financial adviser before making investment decisions.
Want to Stay Ahead of the Next Major Mineral Discovery?
While precious metals offer long-term wealth preservation, the most dramatic wealth-creation events in the resources sector often stem from significant new mineral discoveries — and Discovery Alert's proprietary Discovery IQ model delivers real-time ASX alerts the moment these opportunities emerge, transforming complex geological data into actionable insights for investors at every experience level. Explore historic discovery returns on Discovery Alert's dedicated discoveries page and begin a 14-day free trial to position yourself ahead of the broader market.