July 21, 2026
When Prices Fall Hard, the Real Question Is Whether the Foundation Has Cracked
Precious metals investors have lived through this psychological terrain before. A multi-year bull market produces extraordinary gains, positioning becomes crowded, and then a convergence of cyclical forces triggers a sharp, disorienting selloff. The instinct in those moments is to ask whether everything has changed. The more useful question is whether anything structural has changed.
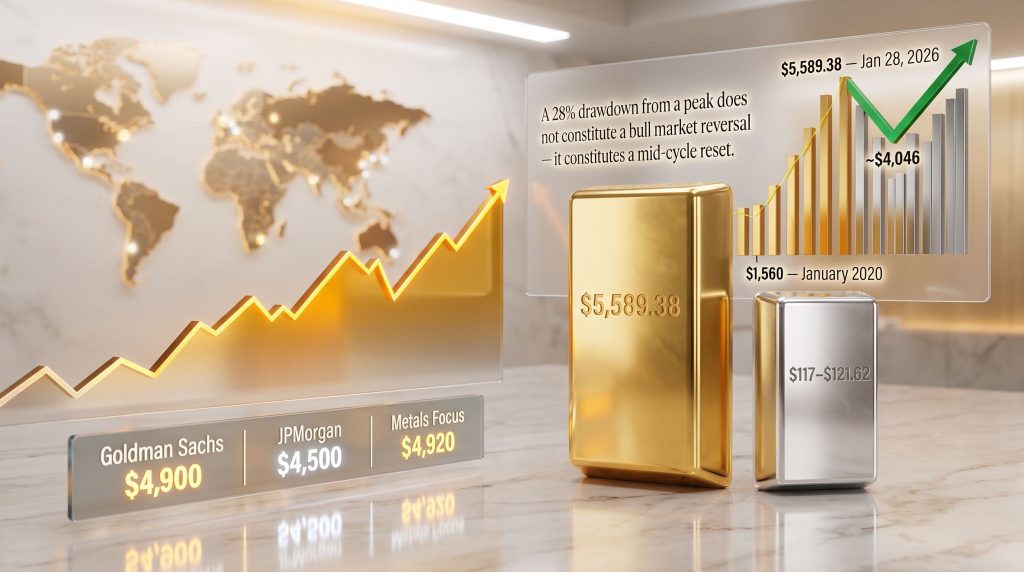
The gold and silver market correction of 2026 sits squarely inside this framework. Gold fell approximately 28% from its all-time high of $5,589.38 reached on January 28, 2026, sliding to around $4,046 by mid-July 2026. Silver's drawdown was considerably steeper, declining from an all-time high of approximately $121.62 to the $58-$64 range, a peak-to-trough decline of roughly 43-52%. The speed and magnitude of both moves triggered genuine anxiety across investor communities.
But steep price declines and bull market endings are not the same event. Distinguishing between the two requires examining what actually moves precious metals structurally versus what produces short-term cyclical turbulence. In 2026, the answer to that question is traceable, specific, and ultimately more reassuring than the raw price numbers suggest. For broader context, precious metals market analysis confirms that these cycles have well-documented historical precedents.
Disclaimer: This article is for informational and educational purposes only and does not constitute financial or investment advice. Precious metals investing involves risk, including the potential loss of capital. Always consult a qualified financial adviser before making investment decisions.
When big ASX news breaks, our subscribers know first
How Bull Markets in Precious Metals Actually End
The Four Conditions Required for a Structural Reversal
Gold bull markets do not terminate because prices correct. They terminate when the underlying demand architecture reverses. Specifically, four structural conditions must shift before a secular gold bull market can credibly be declared over:
-
Real yields normalize and remain sustainably elevated across a multi-year horizon, removing gold's monetary bid.
-
Central bank demand reverses structurally, with sovereign institutions becoming net sellers rather than net buyers at a systemic level.
-
Dollar reserve dominance recovers materially, with de-dollarisation stalling and the greenback reclaiming its share of global reserve assets.
-
Fiscal consolidation meaningfully reduces sovereign debt trajectories, particularly in the United States, eliminating the long-run purchasing power erosion argument.
None of these four conditions was met during the 2026 correction. In fact, three of the four moved in the opposite direction.
Historical Precedent: What Mid-Cycle Corrections Have Actually Looked Like
Every significant gold bull market in modern history has included at least one correction severe enough to generate widespread conviction that the rally had ended. The table below documents the historical pattern:
| Bull Market Cycle | Peak-to-Trough Correction | Duration | Bull Market Outcome |
|---|---|---|---|
| 1970s Gold Bull | ~47% mid-cycle drawdown | ~18 months | Continued to new all-time highs |
| 1999-2011 Gold Bull | ~30% correction (2008) | ~8 months | Recovered and exceeded prior peak |
| 2018-2020 Silver | ~35% correction | ~6 months | New cycle highs followed |
| 2025-2026 Correction | ~28% (gold), ~43-52% (silver) | Ongoing | Structural case intact |
The 2026 drawdown falls comfortably within the historical range of normal bull market consolidation at 15% to 47%. A price decline of this magnitude, absent a reversal in the four structural conditions above, is a mid-cycle reset rather than a secular turning point.
A 28% drawdown from a peak does not constitute a bull market reversal. It constitutes a mid-cycle reset. The question is not how far prices fell, but whether the conditions that drove them higher have changed.
What Actually Caused the 2026 Gold and Silver Market Correction
Force One: The Federal Reserve's Hawkish Recalibration
Entering 2026, futures markets had priced in a sequence of rate cuts from the Federal Reserve. Gold had been powered substantially higher throughout 2025 by the expectation that real yields would fall. The June 2026 FOMC meeting delivered a significant repricing shock: the committee split 9-to-8 in favour of at least one rate hike before year-end, with Chair Warsh taking the unprecedented step of withholding his individual dot plot projection, the first Fed chair ever to do so. [Federal Reserve, June 2026 FOMC Minutes]
The relationship between gold and real yields is precise and well-documented. The mechanism connecting this hawkish pivot to gold prices operates as follows:
-
Gold carries a strong negative correlation with real yields (nominal yields minus inflation expectations).
-
A 25-basis-point shift in real yields historically moves gold by approximately $40-$60 per ounce.
-
The June FOMC repriced real yield expectations sharply upward across the forward curve, eliminating the rate-cut tailwind that had been gold's primary driver through 2025.
The good news, from a structural perspective, is that this headwind is entirely reversible. On July 2, 2026, gold gained over 2% in a single session after Chair Warsh publicly acknowledged that inflation expectations and inflation risks had moderated, a signal that the hawkish narrative was already beginning to unwind. [Reuters, July 2026]
Force Two: The Iran Conflict's Paradoxical Inflationary Effect
The US-Iran military conflict commenced on February 28, 2026, and created what can only be described as an inverted geopolitical signal for gold. Standard market logic positions armed conflict as unambiguously bullish for safe-haven metals. However, the 2026 cycle demonstrated that this assumption depends entirely on how a conflict affects inflation and monetary policy expectations.
The transmission mechanism operated in sequence:
-
Military escalation pushed crude oil above $90 per barrel.
-
Rising oil prices sharply elevated near-term inflation expectations.
-
Higher inflation expectations caused markets to price out rate cuts and begin pricing in hikes.
-
Rate-hike pricing strengthened the US dollar and lifted real yields.
-
Rising real yields directly suppressed gold's monetary bid.
The implication was counterintuitive but clearly traceable: in the context of 2026's specific macro architecture, a ceasefire was more bullish for gold than ongoing hostilities. [CNBC, March 2026] Events appeared to confirm this logic when silver surged nearly 5% in a single session on July 21, 2026, following reports of a proposed 10-day ceasefire between the US and Iran, with the move driven directly by the oil-inflation-rate expectations chain unwinding in reverse.
Force Three: Extreme Positioning After an Extraordinary Prior-Year Run
Gold gained approximately 60% in 2025, its strongest annual performance since 1979. [World Gold Council] During that year, the metal set 53 new all-time highs before peaking in late January 2026. Silver's percentage gains through the prior cycle were even more dramatic.
When extreme ETF positioning and leveraged long exposure meet two simultaneous headwinds, the technical mechanics of deleveraging amplify price moves significantly beyond what fundamentals alone would justify. In March 2026 alone, gold fell $611, the largest absolute monthly decline ever recorded. [IGWT 2026]
This positioning-driven amplification is a feature of how modern paper markets work, not evidence that the underlying demand thesis collapsed.
The Full Scope of the 2026 Correction: By the Numbers
| Metric | Gold | Silver |
|---|---|---|
| All-Time High (2026 Peak) | $5,589.38 (Jan 28, 2026) | ~$121.62 |
| Correction Low (Mid-2026) | ~$4,046 | ~$58-$64 |
| Peak-to-Trough Decline | ~28% | ~43-52% |
| Largest Single-Month Drop | $611 (March 2026) | N/A |
| Classification | Steepest quarterly correction since 2013 | Deepest drawdown of current cycle |
| Recovery Signal | +2% on July 2, 2026 | +5-8% off lows |
Placing this correction within a six-year context clarifies the structural picture considerably. Gold traded near $1,560 in January 2020. At $4,046 in mid-July 2026, the metal has still delivered approximately 160% in gains over six years, absorbing the full 2026 drawdown and remaining vastly above pre-cycle levels. [goldsilver.com/price-charts/]
Why Silver Fell So Much Harder Than Gold
The Structural Volatility Asymmetry
Silver's deeper drawdown has a straightforward structural explanation rooted in market architecture rather than fundamental deterioration. Silver's total market capitalisation is approximately one-tenth the size of gold's. Consequently, identical capital flows produce proportionally larger price movements in silver. This asymmetry functions in both directions, amplifying rallies as well as corrections, and it is a permanent feature of the silver market rather than a temporary condition.
Silver's Dual Demand Identity and Why It Creates Compounding Drawdowns
Silver occupies a unique position among investment assets because it simultaneously serves two demand functions with different economic sensitivities:
-
Monetary demand (approximately 42% of annual consumption): driven by investor sentiment, real yield dynamics, and currency debasement concerns, behaving similarly to gold.
-
Industrial demand (approximately 58% of annual consumption): electronics manufacturing, photovoltaic solar panels, electric vehicles, and semiconductor applications. [Silver Institute / Metals Focus, World Silver Survey 2026]
When rate-hike expectations rise alongside recession risk repricing, silver faces a simultaneous markdown of both its monetary bid and its industrial demand component. Gold carries no such industrial exposure, which is why silver's drawdown consistently exceeds gold's in risk-off, rate-sensitive environments. Furthermore, the widening silver supply deficits add another layer of structural complexity to silver's price dynamics.
The Gold-Silver Ratio as a Relative Value Signal
The gold-silver ratio, which measures how many ounces of silver are required to purchase one ounce of gold, currently sits at approximately 69:1. This places it above the 50-year historical average of approximately 65:1. [goldsilver.com]
| Ratio Metric | Current Reading | Historical Context |
|---|---|---|
| Gold-Silver Ratio (Mid-2026) | ~69:1 | Above 50-year average |
| 50-Year Historical Average | ~65:1 | Long-run mean reversion level |
| Late-Cycle Bull Market Compression | 55:1 or below | Observed in prior precious metals cycle peaks |
A gold-silver ratio sitting above the 50-year historical average does not signal silver weakness. It signals silver has not yet caught up. Historically, the catch-up phase has produced some of the most asymmetric return opportunities in the entire precious metals complex.
Three Structural Pillars the 2026 Correction Did Not Break
Pillar One: Central Bank Gold Accumulation Is Accelerating
Central bank gold demand reached a net 244 tonnes in Q1 2026 alone, a year-over-year increase of 3% and the fastest quarterly pace in over a year. Full-year 2025 central bank purchases reached 863 tonnes, the third-highest annual total ever recorded. [World Gold Council, Q1 2026 Gold Demand Trends, April 29, 2026]
The World Gold Council's 2025 Central Bank Survey, which drew responses from 73 central banks (the highest participation rate in the survey's history), produced two particularly striking findings:
-
95% of respondents expected global gold reserves to increase over the next 12 months, a record reading.
-
Zero central banks anticipated any reduction in gold holdings.
Central banks occupy a unique analytical position in this debate. These are the institutions that issue fiat currency professionally. Their sustained, accelerating accumulation of gold at historically elevated prices represents a multi-decade institutional perspective on monetary architecture, not a quarterly trading decision.
Pillar Two: Gold Has Surpassed US Treasuries as the World's Largest Reserve Asset Class
In June 2026, the European Central Bank confirmed that gold accounted for 27% of global central bank reserve assets at end-2025, up from 20% the prior year. US Treasuries fell to 22% of global reserves from 25% over the same period. [European Central Bank, International Reserve Report, June 2, 2026] The last time gold held a larger share of global reserves than US Treasuries was 1996.
This structural shift has a specific and well-understood catalyst. The 2022 freezing of Russian dollar-denominated reserves demonstrated to every sovereign reserve manager globally that dollar assets can be immobilised as a geopolitical instrument. Gold carries no counterparty risk and cannot be sanctioned, frozen, or seized by any foreign government. That lesson has been systematically absorbed into sovereign reserve management frameworks worldwide and is unlikely to be forgotten.
The dollar's broader reserve trajectory reinforces this picture. The US dollar's share of global central bank reserves has declined from approximately 72% in 2000 to around 58% by 2024, per IMF COFER data. This multi-decade structural trend did not reverse in 2026.
Pillar Three: Silver's Supply Deficit Is Widening, Not Narrowing
2026 marks the sixth consecutive year of structural supply deficit in the silver market. The projected 2026 deficit stands at 46.3 million troy ounces, up from 40.3 million troy ounces in 2025. Since 2021, the silver market has drawn down a cumulative 762 million troy ounces from above-ground inventories to cover the structural gap between supply and annual demand. [Silver Institute / Metals Focus, World Silver Survey 2026]
This structural tightness was not resolved by the 2026 price correction. In fact, lower prices create less incentive for new mine development, which means the supply response to deficit conditions is likely to be slow and insufficient over any foreseeable near-term horizon.
The next major ASX story will hit our subscribers first
What Institutional Forecasters Are Projecting for H2 2026
The Consensus Landscape Across Major Institutions
| Institution | H2 2026 / Year-End Target | Key Assumption |
|---|---|---|
| World Gold Council | ~$4,100 base case (range: $3,895-$4,305) | Base-case macro conditions |
| World Gold Council (Upside) | $4,500+ | Fed pivot or new demand surge |
| JPMorgan | $4,500 (Q4 2026); Q3 avg $4,300 | Rate sensitivity, softer demand |
| JPMorgan (2027 Target) | $6,300 | Structural bull case intact |
| Goldman Sachs | $4,900 year-end 2026 | Post-June 19 forecast revision |
| Metals Focus | $4,920 full-year 2026 average | LBMA Annual Survey |
JPMorgan reduced its Q4 2026 gold target by approximately 25% on July 3, 2026, revising from approximately $6,000 down to $4,500, citing softer demand conditions and heightened sensitivity to real interest rate movements. [J.P. Morgan Global Research, Reuters, July 3, 2026] The bank's longer-term 2027 target of $6,300 remains unchanged, signalling that the revision reflects near-term caution rather than a structural thesis change.
Goldman Sachs maintained its $4,900 year-end 2026 target following its June 19, 2026 forecast revision. [Goldman Sachs Global Commodities Research] Metals Focus, in the LBMA 2026 Annual Precious Metals Forecast Survey, places the full-year 2026 average at $4,920. [Metals Focus, LBMA 2026 Survey]
A critical observation across the entire institutional forecast landscape: no major forecasting house anticipates gold returning to pre-2025 levels. The range of disagreement is entirely about the magnitude of recovery, not whether one occurs.
The World Gold Council's Fair Value Framework
The World Gold Council's mid-year 2026 outlook, published July 1, 2026 under the title Point Break, places gold's fair value at approximately $4,100 under base-case conditions, with a tolerance band of plus or minus 5%, implying a range of $3,895 to $4,305. [World Gold Council, Gold Mid-Year Outlook 2026]
The WGC's Gold Valuation Framework also documents a historically consistent pattern: gold price declines exceeding 10% have reliably attracted countercyclical institutional accumulation, which constrains further downside from current price levels to approximately 15% within the model's framework under base-case conditions.
The WGC's valuation model does not guarantee a specific price floor. What it documents is a consistent historical pattern of institutional accumulation at these relative valuation levels, which structurally constrains the downside scenario in the absence of a genuine fundamental shift.
Scenario Modelling: Three Pathways for Gold and Silver Through Year-End 2026
Scenario A: Gradual Recovery as Cyclical Headwinds Ease (Base Case)
-
The Federal Reserve holds rates at the July 28-29 FOMC meeting.
-
June PCE data (due July 30) prints soft, reducing rate-hike probability below 10%.
-
Oil prices stabilise as Iran conflict tensions plateau.
-
Gold consolidates in the $4,000-$4,300 range through Q3, then recovers toward $4,500 by year-end.
-
Silver outperforms gold as the gold-silver ratio compresses from 69:1 toward the historical average.
Scenario B: Fed Pivot Accelerates the Recovery (Upside Case)
-
Economic growth slows faster than consensus expectations, prompting the Fed to signal a rate cut before year-end.
-
Real yields decline materially, removing the primary structural headwind.
-
ETF inflows resume as institutional sentiment turns constructive.
-
Gold tests $4,500-$4,900 in Q4 2026; silver enters fresh price discovery above prior resistance.
-
Trajectory aligns with Goldman Sachs ($4,900) and JPMorgan's 2027 structural target ($6,300).
Scenario C: Surprise Rate Hike Extends the Correction (Low-Probability Tail Risk)
-
The July 28-29 FOMC delivers a surprise rate hike, currently assigned approximately 20% probability by futures markets per CME FedWatch data.
-
Real yields spike; gold tests the WGC's lower fair-value bound near $3,895.
-
Iran conflict escalates further, sustaining oil above $90 and keeping inflation expectations elevated.
-
Silver tests prior lows near $58-$64 before structural buyers absorb supply.
-
This scenario does not terminate the bull market. It extends the consolidation phase.
| Scenario | Primary Trigger | Gold Year-End Target | Silver Outlook | Bull Market Status |
|---|---|---|---|---|
| A: Base Case | Fed holds; oil stabilises | $4,300-$4,500 | Outperforms gold | Intact |
| B: Upside | Fed pivot; growth slows | $4,500-$4,900 | Strong outperformance | Accelerating |
| C: Downside | Surprise rate hike | $3,895-$4,000 | Tests prior lows | Intact, extended |
Key Risk Factors Investors Should Monitor in H2 2026
The Three Critical Near-Term Catalysts
1. July 28-29 FOMC Meeting
The single most important near-term pricing event for gold. A surprise rate hike carries approximately 20% probability per futures markets and would represent a significant shock, likely pushing gold toward the lower bound of the WGC's fair value range near $3,895. A hold, by contrast, removes the most proximate headwind.
2. June PCE Data (July 30)
The Federal Reserve's preferred inflation measure. A soft print would meaningfully reduce rate-hike probabilities and provide the most direct near-term catalyst for a sustained recovery in both metals. The PCE reading therefore functions as a near-simultaneous confirming or disconfirming signal for the base case scenario.
3. ETF Flow Dynamics
Paper markets drive short-term price discovery. ETF outflows, particularly from US-listed gold and silver funds, have amplified the downside since the January 2026 peak. A stabilisation or reversal in ETF flows would signal that institutional sentiment is turning, typically a precondition for sustained price recovery.
A Less-Discussed Dynamic: Paper Market Architecture and Physical Demand Divergence
One dimension of the gold and silver market correction that deserves analytical attention is the divergence between paper market pricing and physical demand signals. China's largest banks announced the termination of retail leveraged gold trading on the Shanghai Gold Exchange after July 24, 2026. While this removes a layer of speculative paper exposure from one of the world's largest gold markets, it simultaneously shifts price discovery toward physical demand channels, a structural change that could reduce the paper-market amplification of future corrections.
Additionally, China's bar and coin gold demand reached a record 207 tonnes in Q1 2026, even as India paused on elevated import duties. Physical accumulation at the consumer level in Asia has not followed the paper market selloff with equivalent conviction, a divergence that historically resolves in favour of the physical price signal over multi-year horizons.
The Macro Architecture That Keeps the Structural Case Intact
One set of numbers rarely emphasised in market commentary frames the fiscal backdrop with unusual clarity. The US national debt stood at approximately $39.4 trillion in mid-July 2026, having grown by more than $10 trillion since 2021. Annual interest payments have exceeded $1 trillion for the first time in US history. [US Treasury Fiscal Data, July 2026]
These numbers do not retreat on a quarterly cycle. They compound. The mechanism that connects fiscal deterioration to gold's long-run performance, specifically the erosion of confidence in the purchasing power of fiat currency over time, is not resolved by a single hawkish FOMC meeting or a temporary oil shock. It is a structural force operating on a decade-long horizon.
Every major structural argument that existed for gold and silver in January 2026 still exists in July 2026. The 2026 gold and silver market correction changed the price. It did not change the case.
Past performance is no guarantee of future results. All investments involve risk. This article is for informational purposes only and does not constitute financial or investment advice. Forecasts referenced are from third-party institutions and represent their views at the time of publication. Always consult a qualified financial adviser before making investment decisions.
Ready to Act on the Next Major ASX Mineral Discovery Before the Broader Market?
Discovery Alert's proprietary Discovery IQ model delivers real-time alerts on significant ASX mineral discoveries, transforming complex geological data into actionable investment insights for both short-term traders and long-term investors — start your 14-day free trial today and explore how historic mineral discoveries have generated extraordinary returns for those positioned early.