June 23, 2026
The Monetary Architecture That Makes This Precious Metals Cycle Unlike Any Before It
The history of modern monetary policy is, in many ways, a history of deferred consequences. Every major economic disruption since the early 1980s has been met not with structural reform, but with the same response: inject liquidity, suppress rates, and buy time. For decades, that strategy worked well enough to maintain the illusion of stability. However, the compounding arithmetic of deficit spending has a terminal velocity, and a growing body of evidence suggests that velocity has now been reached.
Understanding why the gold and silver mining stocks bull market is positioned for what may be the most powerful phase of the current cycle requires going back further than most analysts care to look.
When big ASX news breaks, our subscribers know first
From Voodoo Economics to the Doom Loop: Forty Years in the Making
The Budget Deficit Nobody Wanted to Fix
When the United States first began running persistent budget deficits in the mid-1980s, the figures that alarmed fiscally conservative observers were in the range of $200 to $250 billion annually. At the time, critics warned that borrowing to fund consumption rather than investment would eventually produce consequences that could not be papered over. Those warnings were largely dismissed.
What followed over the next four decades was a systematic normalisation of deficit spending. Each successive administration, regardless of political affiliation, ran larger structural deficits. Each successive crisis, from the dot-com collapse in 2000 to the September 2001 attacks, from the 2008 global financial crisis to the pandemic shock of 2020, was met with the same policy prescription: print, borrow, and defer the reckoning.
Japan had pioneered this approach after its own debt bubble burst in 1989. Rather than allowing a painful but necessary restructuring, Japanese policymakers chose to prop up failing institutions and suppress rates indefinitely, effectively inventing what would later be codified as modern monetary theory. The United States, watching Japan navigate its own lost decade, initially advocated for the opposite approach. When its own crisis arrived in 2008, it adopted the Japanese model wholesale.
The Federal Reserve's balance sheet, which sat below $1 trillion as recently as 2000, was expanded aggressively in response to the 2008 financial crisis and again during the pandemic. By 2022 it had reached approximately $8 trillion, and while it has been partially reduced since, it remains above $6 trillion. The structural implication of that expansion is still working its way through the global financial system.
The Doom Loop Mechanics: Why This Cycle Cannot Self-Correct
Modern monetary theory rests on a specific assumption: that as long as liquidity is available, economic growth can be sustained. The fatal vulnerability in that framework is inflation. Once inflation takes hold, the cost of maintaining liquidity rises, and the system begins to feed on itself in a destructive cycle.
That cycle now appears to be in operation. The United States government is currently facing a borrowing requirement of approximately $10 trillion over a 12-month period, representing close to $1 trillion in new issuance every single month. The scale of that demand creates an immediate structural problem: bond markets struggle to absorb that volume at acceptable yields, which pushes long-term interest rates higher.
Higher rates increase the cost of servicing existing debt, which widens the deficit further, which requires even more issuance. Critically, the Treasury has responded to weak long-end demand by shifting issuance to the short end of the curve. This is a textbook signal of bond market stress.
The feedback loop that results — where higher borrowing requirements drive up rates, which increase deficits, which require more borrowing — is what analysts who follow this space describe as a doom loop. Once entered, it cannot be resolved through conventional monetary tools alone.
A critical insight for investors: much of the official US GDP figure incorporates government deficit spending as if it were genuine economic output. A private business that borrows money does not count those borrowed funds as revenue. The US government does, which means the headline growth figures used to justify current equity valuations are, in part, a product of the very debt spiral that threatens their sustainability.
Why the S&P 500's Current Level Tells a Misleading Story
At current levels above 7,000, the S&P 500 appears to be pricing in a robust economic future. However, the underlying composition of that performance deserves scrutiny. The strong earnings cited as justification for elevated valuations are concentrated in a narrow cohort of large-cap technology companies. Strip away that concentration effect and the broader economic picture looks considerably less healthy.
The housing market remains deeply dysfunctional. Labour market conditions have softened noticeably from their post-pandemic tightness. GDP growth has decelerated from roughly 3% in recent periods to below 2%. Furthermore, the Strait of Hormuz has reportedly been closed for approximately two months, a development with significant implications for energy prices and global supply chains. That combination of denial and surface-level stability is a market dynamic that has historically preceded significant capital rotation events.
Where the Gold and Silver Mining Bull Market Stands Today
Mapping the Cycle: Four Phases, and Where Are We Now?
Gold bull markets have a recognisable structural pattern. They begin with a breakout that most participants dismiss or overlook, then move through an accumulation phase characterised by rising prices but persistently weak sentiment, before entering an expansion phase where institutional capital begins to rotate in earnest. The final phase, froth, is where multiples expand dramatically and retail participation surges.
| Bull Market Phase | Characteristics | Approximate Timeline |
|---|---|---|
| Breakout Phase | Gold breaks long-term resistance; institutional interest minimal | 2019–2021 |
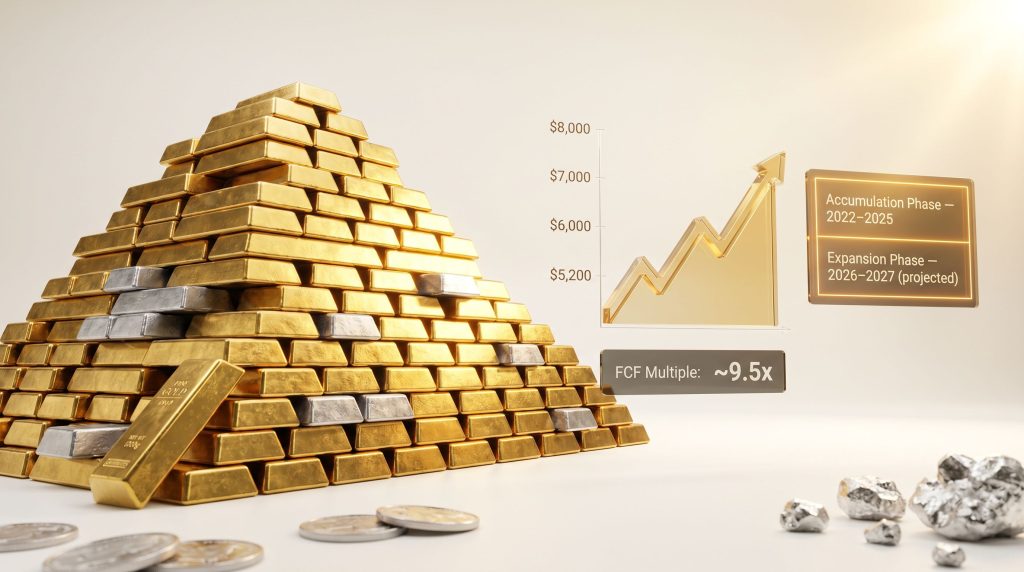
| Accumulation Phase | Prices rise; sentiment remains weak; valuations historically low | 2022–2025 |
| Expansion Phase | Fear trade emerges; capital rotation into miners accelerates | 2026–2027 (projected) |
| Froth Phase | Free cash flow multiples expand significantly; retail participation surges | 2027–2028 (projected) |
The breakout for the current cycle is most accurately dated to December 2019, when gold cleared a significant long-term resistance level. The two prior major gold bull markets — the 1972 to 1980 cycle and the 2002 to 2011 cycle — each lasted approximately nine years from breakout to peak. Applying that historical duration to the December 2019 breakout point projects a cycle peak around 2028.
The Frothiness Signal: Are Mining Stocks Still Historically Undervalued?
The most compelling evidence that the current gold bull market has significant runway remaining is the near-total absence of frothiness in mining equity valuations. Free cash flow multiples provide the clearest lens for assessing where sentiment stands relative to cycle history. In fact, many analysts tracking undervalued mining stocks have highlighted this persistent disconnect as one of the defining features of the current cycle.
Looking at the top eight global gold producers, often referred to in the sector as the elite eight, the group currently averages a free cash flow multiple of approximately 9.5x. Individual names in that cohort range from roughly 8x at the low end to 12 or 13x at the high end. By any historical comparison, these are not frothy numbers.
During the froth phase of the 1979 to 1980 cycle, when ETFs did not exist and all mining equity capital was concentrated in a handful of large producers, free cash flow multiples reached 30x, 50x, and in some cases 100x. Even in the more modest 2010 to 2011 cycle, elevated multiples were observed before the sharp reversal.
Consider what the current numbers imply in practical terms: a major gold producer generating approximately $3 billion in annual free cash flow, with margins of roughly $2,000 per ounce at current gold prices, is attracting essentially no excitement from institutional investors. According to gold stocks revaluing higher, this divergence between fundamental performance and market sentiment is one of the most consistent early-to-mid-cycle indicators available to precious metals investors.
When a senior gold producer with billion-dollar free cash flow trades at a single-digit cash flow multiple, sentiment analysis places that squarely within early-to-mid bull market territory. Froth-phase multiples are typically 3x to 10x higher than current readings.
Understanding the Fear Trade: The Catalyst Most Investors Are Not Watching
What the Fear Trade Actually Means
The fear trade is one of the most misunderstood concepts in precious metals investing, and understanding it properly changes how an investor interprets current market conditions. The fear trade is not simply a period of gold price appreciation. It describes a market environment where investors actively shun equities and seek capital preservation above all else.
The last true fear trade ran from approximately 2002 to 2011, catalysed by the sequential shocks of the dot-com collapse, the September 2001 attacks, and the 2008 financial crisis. During that period, gold moved from roughly $250 per ounce to approximately $1,900 per ounce, an approximately 8x move. The 1970s cycle was similarly driven by a fear trade environment, producing even larger gains from a lower base.
The critical observation is that no fear trade has yet materialised in the current cycle, despite gold having already reached historically significant price levels. The S&P 500 remains above 7,000. Institutional investors are still constructive on equities. Mining equity multiples sit at single digits. This is not a fear trade environment. When it does arrive, the gold-stock market relationship will become unmistakably clear to even the most sceptical observers.
The Gold-to-S&P 500 Crossover: The Signal That Changes Everything
The most important technical and psychological signal for the onset of the fear trade is the crossover between gold and the S&P 500. Currently, gold sits in the approximate $4,600 to $4,900 range following its correction from the $5,600 recent high, while the S&P 500 trades above 7,000. Those two lines are converging.
The scenario most consistent with fear trade activation involves the S&P falling below 6,000 while gold climbs toward the $5,300 to $5,400 range. That convergence would provide the visual and psychological confirmation that capital is structurally rotating from equities into hard assets. If gold reaches $7,000 in that environment, historical analysis suggests the S&P 500 would be trading below 7,000 simultaneously.
| Scenario | S&P 500 Level | Gold Level | Implication |
|---|---|---|---|
| Fear trade threshold approaches | Below 6,000 | ~$5,300–$5,400 | Crossover imminent |
| Fear trade activates | ~5,500 | ~$5,500 | Gold-S&P crossover confirmed |
| Mid-fear trade | Below 7,000 | $7,000 | Structural capital rotation underway |
| Projected cycle peak (~2028) | TBD | $7,000–$8,000 | FCF multiples at 20x–30x+ |
The Strait of Hormuz and the Four Possible Outcomes
Geopolitical conflict affects gold in a counterintuitive pattern that many investors misread. Gold tends to appreciate in anticipation of conflict, then decline modestly during active military engagement, as capital is mobilised and uncertainty resolves partially into known variables. The longer-term inflationary and fiscal consequences of conflict, however, are powerfully constructive for precious metals.
The current situation involving the Strait of Hormuz presents four possible resolution pathways, and three of them are constructive for gold:
| Outcome | Description | Gold Impact |
|---|---|---|
| Prolonged Stalemate | No resolution; oil supply disruption continues | Strongly bullish: inflationary pressure builds persistently |
| Unfavourable Deal | Concessions that reward the blocking party | Moderately bullish: geopolitical risk premium sustained indefinitely |
| Withdrawal Without Agreement | Disengagement without resolution | Moderately bullish: uncertainty premium maintained |
| Full Resolution on Favourable Terms | Strait reopens fully | Neutral to short-term bearish: risk premium deflates temporarily |
The fiscal dimension of military conflict reinforces the structural gold thesis regardless of how the geopolitical situation resolves. Military spending is spending that must be borrowed, borrowing that expands deficits, deficits that tighten the doom loop described earlier. Every dollar spent on geopolitical conflict is, in the context of current fiscal arithmetic, a dollar that deepens the structural case for gold.
Building a Precious Metals Portfolio: The Pyramid Architecture
Starting with Personality Before Stock Selection
One of the most overlooked aspects of mining equity investment is the relationship between an investor's psychological tolerance for loss and their portfolio construction decisions. Before any analysis of individual companies, sectors, or price targets, an investor needs to identify their personal pain point: the maximum loss on a single position that can be absorbed without emotional distress.
This is not a theoretical concept. When a company fails or a position declines sharply, an investor operating above their pain point will make emotionally driven decisions. An investor who has correctly sized positions relative to their pain point treats a failed investment as a capital recycling event, sells the position without distress, and reinvests in the next opportunity. That mechanical simplicity is what allows experienced investors in this sector to hold 100 or more positions simultaneously without being paralysed by individual outcomes.
The Pyramid Structure: From Physical Metals to Speculative Plays
The pyramid portfolio model used by experienced precious metals investors builds from the most stable, low-risk layer at the base through progressively higher-risk, higher-leverage allocations toward the apex.
Level 1: Physical Metals (Foundation)
- A baseline allocation of at least 1,000 ounces of physical silver is frequently cited as a starting point for investors constructing a pyramid portfolio.
- As the gold-to-silver ratio compresses, the relative allocation between physical gold and physical silver can be adjusted accordingly.
- Physical holdings sit at the base because they carry no counterparty risk and no bankruptcy risk.
Level 2: Mutual Funds and ETFs (Core Diversification)
- Gold mining mutual funds provide diversified mid-tier exposure with professional management.
- Owning multiple silver and gold ETF products simultaneously, rather than concentrating in a single fund, replicates the diversification benefit of royalty companies at considerably lower valuation premiums.
- For context, royalty companies typically trade at approximately 30x free cash flow, while senior producer ETFs currently trade at roughly 9x to 10x, providing comparable diversification at a significantly lower entry multiple.
Level 3: Senior Producers (The Elite Eight)
- The top-tier global gold producers currently trade at 8x to 13x free cash flow.
- At $7,000 gold, with projected margins of approximately $5,000 per ounce and multiple expansion toward 20x to 30x, senior producers offer a credible 3x to 5x return potential from current levels.
- Newmont, as one example, is a company where some analysts project a share price path toward $400 to $500 from its current approximate level near $115, representing a roughly 3x return anchored to a $7,000 gold price environment.
Level 4: High-Quality Mid-Tier Producers
- Selection criteria include production growth trajectory, cost discipline relative to the industry average AISC of approximately $1,800 per ounce, reserve quality, and management track record.
- Companies with above-average costs can still be attractive if their current valuation multiple is sufficiently depressed and their production growth trajectory is strong.
Level 5: Developers with Near-Term Construction Timelines
A six-factor checklist applies to developer selection:
- Resource size sufficient to justify development capital
- Construction timeline within approximately three years
- Jurisdiction with stable regulatory and permitting environments
- Financing visibility or existing capital structure
- Experienced management with a track record of project delivery
- Cost profile aligned with or below the industry AISC average
Developers entering construction within three years carry the highest price elasticity of any category: as the gold price rises, their projected net present value increases on a leveraged basis because fixed capital costs become a smaller proportion of total project value.
Level 6: Exploration and Optionality Plays (Speculative Apex)
Two specific rules govern exploration stock selection for investors seeking an edge:
- The optionality rule: gold or silver resources priced deeply below in-situ value. Current optionality valuations in some cases sit around $20 per ounce in the ground, against potential values of $200 per ounce or more at cycle peak. That 10x differential in in-situ valuation represents genuine optionality edge.
- The drill intercept quality rule: a minimum threshold of 200 gram-metres for a drill hole to qualify as an excellent intercept. When interpreting drill results, an early-stage exploration company with its best hole at 59 gram-metres in oxide material, even with 95% metallurgical recovery, does not clear this threshold.
Critically, exploration companies without resource elasticity tend to underperform in bull markets. If a company cannot demonstrate that its value increases as the gold price rises, holding it through a bull market is essentially a drill-bit gamble rather than a leveraged precious metals trade. Developers with near-term construction timelines have elasticity. Early-stage explorers without significant resources generally do not.
All-In Sustaining Costs, Forward Valuations, and the Margin Mathematics
Why Valuing Miners at Spot Price Is the Standard Analyst Error
The conventional approach to valuing mining stocks uses current spot prices as the valuation anchor. For investors who believe the current gold price represents fair value, that methodology is appropriate. For investors who believe gold is in a structural bull market with a multi-year trajectory toward significantly higher prices, however, it dramatically understates the potential value of mining equities.
Using $7,000 per ounce gold and $200 per ounce silver as forward valuation anchors, and applying those prices to current cost structures, transforms the apparent risk-reward profile of virtually every category of producer.
| Gold Price Scenario | Industry Average AISC | Margin Per Ounce | FCF Multiple Range |
|---|---|---|---|
| Current (~$4,800/oz) | ~$1,800 | ~$3,000 | 9–10x |
| $6,000/oz | ~$1,900 | ~$4,100 | 12–15x |
| $7,000/oz | ~$2,000 | ~$5,000 | 20–30x |
| $8,000/oz | ~$2,100 | ~$5,900 | 30x+ |
The industry average AISC has been rising steadily and currently sits at approximately $1,800 per ounce, up from roughly $1,700 in the preceding quarter. Cost inflation in mining is a persistent challenge, but at the projected gold prices that define the bull market thesis, even companies with AISCs approaching $2,200 per ounce maintain compelling margins.
High-Cost Silver Producers: The Counterintuitive Leverage Case
Some of the most asymmetric opportunities in the current silver market are counterintuitively found among high-cost producers, specifically those with all-in sustaining costs above $40 per ounce that were operating near breakeven or at a loss when silver traded around $55 per ounce in Q4 2024.
Two companies in this category, Guanajuato Silver and SilverX, exemplify the thesis. Both reported losses at Q4 silver prices near $55 per ounce. With silver subsequently moving higher, both companies are positioned to generate profits at current prices. The leverage dynamic is straightforward: a company that loses money at $55 silver but survives to see $75 silver has moved from loss to profit. If silver reaches $200, the margin expansion from that cost structure is dramatic, with some analysts projecting 20-bagger potential for select names in this category.
The survival-and-leverage thesis does require one critical condition: the company must survive through the correction. Consequently, balance sheet health matters. A company like Guanajuato Silver, which had approximately $41 million in cash as of its most recent reporting period, has the financial buffer to navigate a prolonged price correction without forced dilution.
Risk Callout: High-cost producers carry meaningful dilution and insolvency risk during prolonged price corrections. The leverage that makes them attractive in a rising price environment works in reverse when prices fall. These are speculative positions sized to the investor's pain point, not core portfolio holdings.
The next major ASX story will hit our subscribers first
Silver's Structural Opportunity: Separate Analysis for a Different Animal
Silver's 2025 Performance and the Supply Implication
Silver reportedly rose approximately 148% in 2025, followed by continued gains into early 2026. That price performance has pushed silver miner margins to levels that compare favourably with high-margin technology companies, a development that would have seemed implausible to most participants even three years ago.
Silver's dual role as both a precious metal and an industrial commodity means its price dynamics are influenced by a broader set of demand factors than gold alone. Furthermore, one of the less-discussed implications of this price surge is the disconnect between silver prices and exploration activity. Despite the significant price increase, exploration budgets in the silver sector have not expanded meaningfully, implying a structural supply constraint in the medium term that higher prices alone cannot quickly resolve.
The Gold-to-Silver Ratio as a Portfolio Allocation Signal
The gold-silver ratio analysis has historically compressed significantly during the late phases of precious metals bull markets, as silver's smaller market size amplifies the price moves driven by investment capital rotation. Monitoring the GSR provides a systematic framework for adjusting the relative allocation between physical gold and physical silver within the foundational layer of a pyramid portfolio.
As the ratio compresses toward historical late-cycle lows, silver's outperformance relative to gold accelerates, which has implications not only for physical holdings but for the relative weighting of silver mining equities versus gold producers.
Current Correction: Context, Duration, and Tactical Positioning
Reading the Correction Against Historical Duration Patterns
The current correction, which began approximately in late January 2026 when gold was trading near $5,600 per ounce, has produced a decline of roughly 20% in gold itself and approximately 25% in major gold mining indices including GDX and GDXJ. In the context of the current bull market, the longest previous correction lasted approximately five months.
The current correction is projected to run for approximately five to six months total from its January onset, with a near-term downside target in the $4,300 range for gold before the uptrend resumes. Dollar-cost averaging into this correction, while maintaining the expectation that lower prices may still occur, represents the tactical approach most consistent with the multi-year bull market thesis. Indeed, analysis exploring the current correction as a buying opportunity reinforces this view for investors with a longer time horizon.
Strategic Note: A 20% to 25% correction within an established bull market is consistent with historical consolidation patterns rather than cycle reversal signals. The structural drivers behind the gold and silver mining stocks bull market — including fiscal doom loop dynamics, monetary expansion, geopolitical stress, and persistently weak mining equity sentiment — have not diminished during this correction period.
Royalty Companies Versus ETFs: A Comparative Framework
The question of royalty companies versus ETFs involves a genuine trade-off between valuation entry point and structural risk profile.
| Investment Vehicle | FCF Multiple | Gold Leverage | Bankruptcy Risk | Best Suited For |
|---|---|---|---|---|
| Royalty Companies | ~30x | Low-moderate | Very low | Wealth preservation, dividend income |
| Senior Producer ETFs | ~9–10x | Moderate-high | Very low | Core bull market exposure |
| Individual Senior Producers | 8–13x | High | Low | Active investors |
| Mid-Tier Producers | Variable | Very high | Low-moderate | Growth-oriented investors |
| Developers (pre-construction) | N/A | Extreme | Moderate | Speculative allocation |
Royalty companies, currently trading at approximately 30x free cash flow on average, are already priced for substantial appreciation. That elevated entry multiple limits their upside relative to senior producers at 9x to 10x. For investors focused on maximising leverage to a rising gold price through the bull market expansion phase, ETF exposure to senior and mid-tier producers offers the same diversification benefit as a royalty portfolio at one-third the valuation entry point.
The exception is for investors with very large pools of capital where capital preservation and income generation are the primary objectives. In that context, the lower-risk royalty model, combined with dividend income from senior producers, may be appropriate as part of a broader precious metals allocation.
Frequently Asked Questions: Gold and Silver Mining Stocks Bull Market
What Is the Current Stage of the Gold and Silver Mining Stocks Bull Market?
Based on free cash flow multiples, sentiment indicators, and historical cycle duration analysis, the current gold bull market appears to be in a mid-cycle accumulation phase. Senior producer valuations remain near historical averages, frothiness indicators are completely absent, and institutional participation is still building. All of these characteristics are consistent with a market that has significant upside remaining rather than one approaching its peak.
Why Are Gold Mining Stocks Underperforming Gold Itself?
Mining equities tend to lag physical gold during the early phases of a bull market as investors remain sceptical of the durability of higher prices. As the cycle matures and free cash flow generation becomes undeniable and sustained, capital typically rotates aggressively into producers, creating the leverage effect that defines late-cycle mining stock performance. This lag is not a structural problem with miners. It is a sentiment phenomenon that resolves as the cycle progresses.
What Is the Fear Trade and Why Does It Matter for Gold and Silver Mining Stocks?
The fear trade describes a market environment where investors actively avoid equity exposure and seek capital preservation in hard assets. Historically, fear trade conditions produced the most powerful and sustained gains for both gold prices and mining equities. The fear trade has not yet arrived in the current cycle despite gold reaching historically significant prices. When it does, the gold-to-S&P 500 crossover will serve as the definitive confirmation signal. For further context on miners requiring time before this phase fully activates, see this analysis of gold and silver miners.
What Is the Minimum Exploration Drill Intercept Quality Worth Analysing?
Experienced sector investors use a gram-metre threshold of at least 200 as the benchmark for what constitutes an excellent drill intercept. Early-stage exploration companies with best holes below this threshold, even in favourable metallurgical settings, lack the geological substance required to generate material stock price moves independent of broader market conditions.
What Gold Price Signals a Cycle Peak for This Bull Market?
Based on historical bull market analysis and current valuation frameworks, the $7,000 to $8,000 per ounce range represents a plausible cycle peak zone, particularly if accompanied by S&P 500 weakness and free cash flow multiples on senior producers expanding to 20x to 30x or higher. The projected cycle peak timeframe is approximately 2027 to 2028 based on the nine-year duration pattern observed in both prior major gold bull markets.
How Should Investors Approach All-In Sustaining Cost Analysis When Evaluating Producers?
While lower AISC producers are preferable for obvious margin and cash flow reasons, AISC analysis should always be weighed against current valuation multiples and production growth trajectory. A high-cost producer trading at 2x to 3x free cash flow with a strong production growth profile can offer superior risk-adjusted returns compared to a low-cost producer already trading at a premium multiple. The critical threshold for acceptability is approximately $2,200 per ounce AISC in the current environment, provided the cost trajectory is stable rather than escalating.
The Structural Case for Precious Metals Mining Stocks Remains Intact
Key Takeaways for Investors Evaluating the Gold and Silver Mining Sector
- The macroeconomic forces driving gold higher — including fiscal doom loop dynamics, structural bond market stress, monetary expansion, and geopolitical instability — are structural rather than cyclical in nature.
- Mining equities remain historically undervalued relative to metal prices, with elite senior producers trading at 9x to 10x free cash flow versus historical froth-phase multiples of 30x to 100x.
- The pyramid portfolio model, from physical metals through ETFs, senior producers, mid-tiers, developers, and selective exploration plays, provides both capital protection and asymmetric upside depending on position sizing and risk tolerance.
- The fear trade has not yet arrived. The gold-to-S&P 500 crossover, projected to occur somewhere in the zone of S&P 500 below 6,000 and gold above $5,300, remains the definitive confirmation signal for structural capital rotation.
- The current correction of 20% to 25% in gold and mining indices is consistent with historical bull market consolidation patterns. The underlying structural drivers have not changed during this correction period.
- Silver's dual role as an industrial and monetary metal, combined with the absence of meaningful new exploration spending despite dramatic price appreciation, creates a compelling case for dedicated silver equity exposure alongside gold.
- Investors entering today face a correction, but the multi-year trajectory toward projected cycle peak levels remains strongly intact based on historical cycle duration, current valuation metrics, and macroeconomic fundamentals.
Further Exploration: Readers seeking additional perspectives on precious metals investing and gold and silver mining stocks analysis can explore ongoing interviews with sector specialists and analysts through Palisades Gold Radio on YouTube, which provides complementary viewpoints for investors researching the precious metals mining sector.
This article is intended for general informational and educational purposes only. It does not constitute financial advice, an offer to buy or sell securities, or a solicitation of any kind. All projections, price targets, and cycle timing references are speculative in nature and subject to significant uncertainty. Past performance of precious metals or mining equities is not indicative of future results. Investors should conduct their own research and consult a licensed financial adviser before making any investment decisions.
Want to Know When the Next Major ASX Mineral Discovery Hits the Market?
Discovery Alert's proprietary Discovery IQ model delivers real-time alerts on significant ASX mineral discoveries, turning complex mineral data into actionable insights for investors at every experience level — from those building pyramid portfolios of senior producers to those seeking speculative exploration exposure. Explore historic discoveries and their exceptional returns, then start your 14-day free trial to position yourself ahead of the broader market.