May 22, 2026
The Architecture of a Resilient Portfolio: Why Both Metals Belong in It
Few investment decisions reveal more about an investor's understanding of risk than how they approach hard asset allocation. Most retail investors who hold precious metals default to one of two extremes: an all-gold position built around fear, or a silver-heavy speculative bet built around the next big rally. Both approaches misunderstand the fundamental mechanics of how these metals function differently within a portfolio, and both leave significant value on the table.
The question of gold and silver portfolio allocation is not about which metal is superior. It is about understanding that these two assets occupy structurally different roles, respond to different economic inputs, and deliver different outcomes across market cycles. Getting the balance right is where portfolio construction actually happens.
When big ASX news breaks, our subscribers know first
Why the Gold-Only and Silver-Only Approaches Both Fail
The instinct to simplify is understandable. Gold has the longer track record, the institutional credibility, and the cleaner narrative. Silver has the industrial growth story, the supply deficit data, and the outsized return potential. However, investors who concentrate entirely in either metal are implicitly claiming that one function is sufficient for all market conditions.
Gold held in isolation protects against systemic risk but generates no exposure to the industrial and technological demand cycles that could drive asymmetric returns during periods of economic expansion. Silver held in isolation introduces meaningful volatility and cyclical sensitivity without the stabilising anchor that a core gold position provides during market dislocations.
The data from recent market cycles makes this contrast concrete. During the sharp volatility event of early 2026, gold demonstrated its characteristic resilience. Silver, by contrast, experienced far larger percentage drawdowns from its January peak of $121.67 per ounce before stabilising. Each metal behaved exactly as its structural characteristics predict. Together, they would have produced a more balanced outcome than either alone.
The Structural Case for Gold: What 16 Years of Institutional Buying Actually Signals
Understanding gold's role begins with the demand architecture. According to the World Gold Council's Gold Demand Trends: Full Year 2025, approximately 46% of annual gold demand originates from investment flows and central bank gold demand combined. Unlike copper, which lives or dies on construction activity, or crude oil, which tracks transportation and industrial output, gold's primary demand drivers are monetary and institutional in nature.
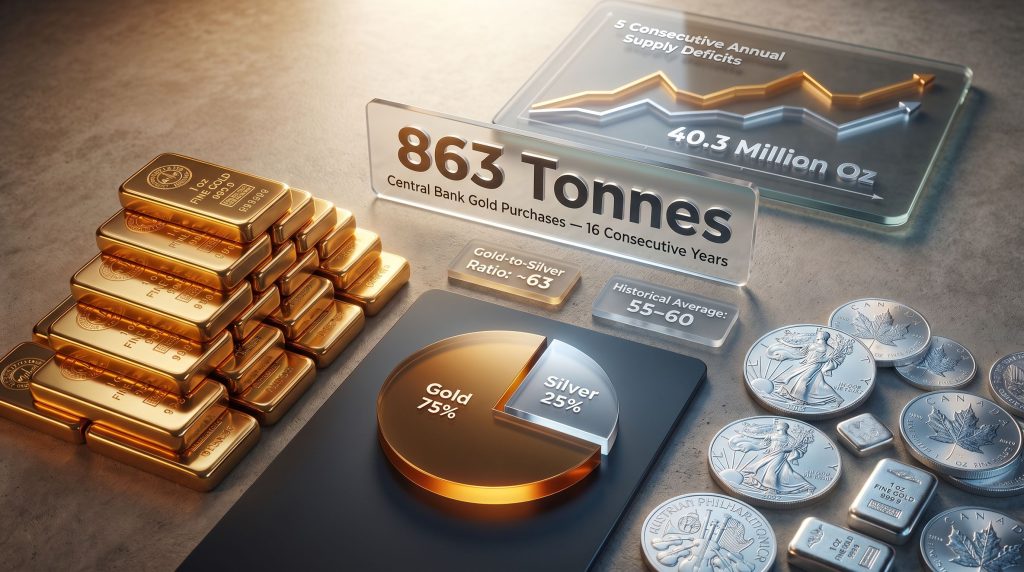
The significance of central bank behaviour cannot be overstated. Global central banks collectively purchased 863 tonnes of gold in 2025, marking the sixteenth consecutive year of net institutional accumulation, according to the World Gold Council. Critically, this buying has continued even as prices reached record levels, signalling that accumulation is driven by strategic reserve considerations rather than price-sensitive opportunism.
The world's most capitalised monetary institutions have added gold to their reserves every single year for sixteen consecutive years. When that behaviour persists at record price levels, it reflects institutional conviction in gold's monetary function, not speculative momentum.
J.P. Morgan Global Research projects that combined central bank and investor demand will average approximately 585 tonnes per quarter throughout 2026. That sustained institutional demand provides a structural floor that distinguishes gold from assets whose value depends on earnings growth, credit quality, or production economics.
Furthermore, gold's gold safe haven role carries a property that is easy to state but difficult to fully internalise: it has no counterparty risk. Physical gold is not a claim on an institution's balance sheet, not a promise to pay, and not contingent on any third party remaining solvent. In a world where financial contagion can cascade through interconnected institutional systems within hours, that structural independence is not a minor feature.
Silver's Dual Identity: Monetary Metal and Industrial Input
Silver's dual role means it operates on two distinct economic frequencies simultaneously, which is both the source of its appeal and the origin of its volatility. Its monetary properties are genuine: like gold, physical silver carries no counterparty risk, no issuer liability, and has functioned as a store of value across centuries. However, its demand base is fundamentally different.
According to the Silver Institute, more than 50% of annual silver demand now derives from industrial applications. The three dominant growth vectors are photovoltaic solar manufacturing, electric vehicle systems, and the infrastructure buildout supporting artificial intelligence and data centre expansion. Each of these represents a structural, multi-decade demand trend rather than a cyclical consumption pattern.
The solar sector alone consumed an estimated 197.6 million ounces of silver in 2024, according to Silver Institute data. This figure reflects silver's irreplaceable role in photovoltaic cell production, where it functions as a conductive paste on solar cell contacts. As global solar installation capacity expands, silver demand from this single application will continue compressing available supply.
Compounding the demand picture is a supply constraint that most investors fail to appreciate. Approximately 70% of global silver production occurs as a byproduct of copper, zinc, and lead mining rather than from dedicated primary silver mines, according to the Silver Institute. This byproduct structure fundamentally limits supply responsiveness to price signals.
The result is a structural supply-demand imbalance that has now persisted for five consecutive years. In addition, silver supply deficits reached approximately 40.3 million ounces in 2025, representing the fifth consecutive annual shortfall, according to the Silver Institute's 2026 World Silver Survey. Over a five-year cumulative period, this deficit represents more than 200 million ounces of consumption in excess of mine production.
A five-year cumulative supply deficit of over 200 million ounces does not resolve itself automatically. The structural imbalance between accelerating industrial consumption and constrained mine supply is a medium-to-long-term fundamental consideration, not a short-term trading thesis.
How the Two Metals Behave Across Different Market Environments
One of the most practically useful frameworks for gold and silver portfolio allocation is understanding how each metal performs under different macro conditions. The table below summarises the observed behavioural patterns based on historical market cycles:
| Market Condition | Gold Behaviour | Silver Behaviour |
|---|---|---|
| Risk-off or crisis | Holds or appreciates | Higher volatility; potential underperformance |
| Inflationary environment | Strong appreciation | Performs well; industrial demand supports |
| Bull market or growth phase | Steady gains | Historically outperforms gold significantly |
| Currency debasement | Core beneficiary | Benefits, but with elevated volatility |
| Persistent supply deficit | Broadly neutral | Structurally supportive over medium term |
The important takeaway from this table is that the two metals are not substitutes. They cover different parts of the cycle. Gold tends to outperform when the primary investment concern is systemic risk, financial instability, or monetary debasement. Silver tends to outperform when economic growth is driving industrial consumption higher and precious metals sentiment is broadly constructive.
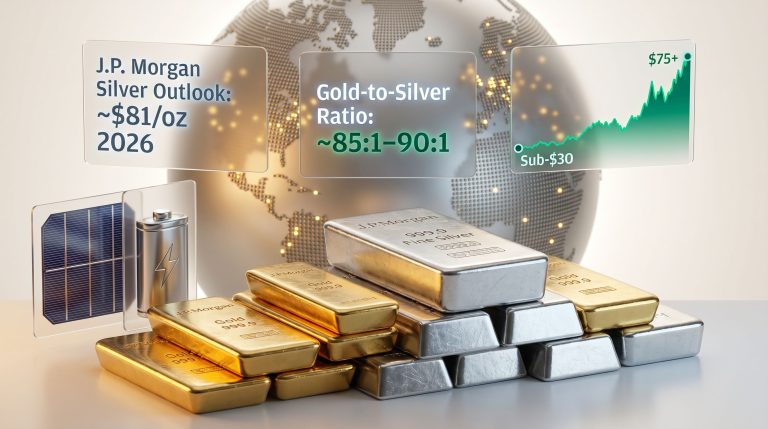
In major precious metals bull markets, silver has historically delivered returns that substantially exceed gold's gains from the same starting point. Silver reached a nominal all-time high of $121.67 on January 29, 2026, more than doubling in value over the preceding twelve months, according to Investing News Network. Over the same period, gold delivered approximately 43% gains from already-elevated price levels. Both outcomes were exceptional; silver's was larger, but so was its subsequent correction.
Building the Allocation: How Much and in What Proportion
Research and practitioner frameworks converge on a reasonably consistent range for total precious metals allocation. According to expert portfolio allocation guidance, academic studies examining portfolio optimisation and Sharpe ratio improvement consistently identify a 5% to 20% allocation to precious metals as the range that enhances risk-adjusted returns without creating excessive concentration. The appropriate point within that range depends on several portfolio-specific factors:
- Existing paper asset exposure: portfolios heavily weighted toward equities and bonds benefit more from a larger precious metals allocation as a non-correlated offset
- Investment time horizon: longer horizons can absorb silver's cyclical volatility in pursuit of its structural upside
- Risk tolerance and drawdown capacity: investors with lower tolerance for interim volatility should anchor more heavily in gold
- Macro environment assessment: elevated systemic uncertainty, currency instability, or persistent inflation may justify allocations toward the upper end of the range
Once total allocation is determined, the internal split between gold and silver is where strategy actually takes shape. A rough practitioner benchmark positions gold at approximately two-thirds of the metals allocation and silver at one-third. However, this should be treated as a starting point rather than a fixed rule.
The table below provides a risk-profile-based framework for structuring the internal split:
| Investor Profile | Total Metals Allocation | Gold (% of Metals) | Silver (% of Metals) |
|---|---|---|---|
| Conservative | 5 to 10% | 70 to 80% | 20 to 30% |
| Balanced | 10 to 15% | 50 to 65% | 35 to 50% |
| Growth-oriented | 15 to 25% | 20 to 40% | 60 to 80% |
A practical illustration: a balanced investor with $100,000 in investable assets applying a 20% total metals allocation would deploy $20,000 across the two metals. At a 75/25 gold-to-silver split, this translates to $15,000 in gold and $5,000 in silver, providing both a systemic risk buffer and meaningful industrial upside exposure.
The next major ASX story will hit our subscribers first
The Gold-to-Silver Ratio: A Rebalancing Instrument, Not a Trading Signal
The gold-silver ratio insights that practitioners rely on are often misunderstood by newer investors. The ratio expresses how many ounces of silver are required to purchase a single ounce of gold at prevailing spot prices. In late April 2026, this ratio stood at approximately 63, meaning 63 ounces of silver were required to buy one ounce of gold, according to Trading Economics historical data.
The significance of this reading becomes apparent when viewed against historical context. The modern free-market era average for the ratio sits in the 55 to 60 range. A reading of 63 indicates that silver is trading at a relative discount to gold compared to its long-run norm.
Historical ratio extremes offer useful reference points:
| Period | Ratio Level | Subsequent Outcome |
|---|---|---|
| 1991 peak | Approximately 100 | Silver significantly outperformed gold over the following decade |
| 2020 COVID peak | Approximately 125 | Silver surged from approximately $12 to $30 within 12 months |
| Late April 2026 | Approximately 63 | Above modern average; silver carrying a relative discount to gold |
The practical application of this tool follows a systematic logic rather than a speculative one. When the ratio is elevated well above its historical average, silver is statistically cheap relative to gold, and a rebalancing tilt toward silver has historically preceded periods of silver outperformance. When the ratio compresses below 55 to 60, silver has closed the valuation gap and rotating back toward gold locks in relative gains.
A step-by-step rebalancing framework based on the ratio:
- Establish your baseline total metals allocation as a percentage of total investable assets
- Set your default gold-to-silver split based on your risk profile using the table above
- Monitor the gold-to-silver ratio against its modern historical average of 55 to 60
- When the ratio exceeds 75: Consider tilting the internal allocation toward silver, as it is historically undervalued relative to gold
- When the ratio falls below 55 to 60: Consider rotating weight back toward gold, consolidating gains from silver's relative outperformance
- Rebalance at minimum annually, or when ratio movements suggest a meaningful relative valuation shift
The gold-to-silver ratio functions as a systematic rebalancing guide rather than a market timing instrument. Investors who have applied it consistently across multiple cycles have grown their total ounce count without deploying additional capital, simply by rotating between the two metals at historically favourable relative valuations.
What Industrial Demand Growth Actually Means for Silver's Long-Term Supply Picture
One of the less widely understood dynamics in silver markets is how the byproduct supply structure interacts with the accelerating industrial demand base. Because roughly 70% of silver mine output is incidental to base metal production, the silver price alone cannot incentivise the supply increases that would normally resolve a persistent deficit.
For a new dedicated silver mine to become economically viable, the price must clear a sufficiently high hurdle to justify standalone capital expenditure, permitting timelines, and infrastructure development — processes that typically require five to ten years even under favourable conditions. Consequently, primary silver miners cannot simply turn on additional production in response to a deficit signal.
Meanwhile, the industrial demand ceiling keeps rising. Solar panel manufacturing intensity per megawatt continues to evolve as manufacturers improve cell efficiency while simultaneously increasing panel volumes. Electric vehicle penetration is expanding globally, and each vehicle contains meaningful silver content in its electrical systems, battery management circuitry, and power electronics.
Data centre buildout driven by artificial intelligence infrastructure deployment is adding additional demand through silver-containing semiconductors, connectors, and thermal management components. The compounding of these demand trends against a structurally inelastic supply base is the mechanism behind five consecutive years of market deficits.
Selecting the Right Holding Structure for Your Allocation
The question of how to hold precious metals is as important as how much to hold. Different structures offer different trade-offs between security, liquidity, tax treatment, and counterparty exposure. Furthermore, according to guidance on precious metals buying decisions, the holding structure chosen can meaningfully affect both the risk profile and the practical utility of your allocation.
- Physical bullion (coins and bars): The preferred structure for core strategic holdings. Direct ownership eliminates counterparty risk entirely. Suitable for investors prioritising genuine monetary insurance
- Allocated vault storage: Appropriate for larger positions requiring professional custody. Metal is segregated and assigned to the owner. Third-party storage introduces a custody relationship but not a financial counterparty risk in the same sense as an ETF
- Precious metals IRA: A tax-advantaged structure for retirement-oriented allocations. Subject to IRS purity requirements and approved custodian rules; offers meaningful long-term compounding advantages
- Precious metals ETFs: Provide liquidity and ease of access but reintroduce a form of counterparty risk through the fund structure. Appropriate for tactical or liquidity-oriented portions of the allocation but not a substitute for physical ownership as the core holding
- Mining equities (0 to 5% tactical): Offer leveraged exposure to metal prices through operational leverage. Higher volatility than physical metal; subject to company-specific risks including management, geology, and jurisdiction
For most investors building a long-term gold and silver portfolio allocation, physical bullion and allocated storage form the strategic core. Other formats can serve supplementary roles but should not replace direct metal ownership where genuine systemic risk protection is the objective.
Common Questions About Gold and Silver Allocation
How much of my portfolio should be in precious metals?
Research and practitioner frameworks suggest 10% to 20% of investable assets for a balanced approach. Conservative investors anchor at 5% to 10%, while those managing elevated systemic risk concerns or strong inflation hedging mandates may extend toward 20% to 25%. The appropriate level depends on existing asset mix, time horizon, and risk tolerance.
Is silver riskier than gold as an investment?
In terms of price volatility, yes. Silver's higher beta reflects its sensitivity to both monetary conditions and industrial demand cycles simultaneously. It tends to amplify both gains and losses relative to gold. This characteristic makes it a growth complement to gold's stabilising function rather than a direct substitute for it.
What does the gold-to-silver ratio tell me?
It provides a relative valuation signal between the two metals. A ratio above the historical average of 55 to 60 indicates silver is relatively cheap compared to gold, and has historically preceded periods of silver outperformance. A ratio below this range suggests the opposite. It is most useful as a periodic rebalancing guide rather than a short-term trading indicator.
Should I hold physical metal or ETFs?
Physical bullion is generally preferred for the core strategic allocation because it eliminates counterparty and issuer risk. ETFs can serve tactical or liquidity purposes but do not replicate the systemic risk protection that unencumbered physical ownership provides.
Disclaimer: This article is for informational and educational purposes only and does not constitute financial or investment advice. Precious metals prices are subject to significant volatility. Past performance is not indicative of future results. Readers should consult a qualified financial adviser before making any investment decisions. All price references and market data cited reflect information available as of late April 2026 and are subject to change.
Want to Stay Ahead of the Next Major Mineral Discovery on the ASX?
While gold and silver form the foundation of a resilient hard asset portfolio, significant wealth has also been built through early positioning in transformative ASX mineral discoveries — Discovery Alert's proprietary Discovery IQ model delivers real-time alerts the moment significant discoveries are announced, turning complex data across 30+ commodities into actionable insights for investors at every experience level. Explore historic discovery returns on Discovery Alert's dedicated discoveries page and begin your 14-day free trial to secure your market-leading edge.