May 13, 2026
The recent gold and silver price decline has sent shockwaves through global precious metals markets, creating one of the most significant corrections witnessed since the 1920s. This extraordinary market movement reflects complex interactions between monetary policy expectations, leveraged trading products, and systematic deleveraging that extends far beyond traditional supply-demand dynamics. Understanding these developments requires careful analysis of how modern financial engineering has fundamentally altered precious metals price discovery mechanisms.
Understanding the Structural Forces Behind Recent Precious Metals Volatility
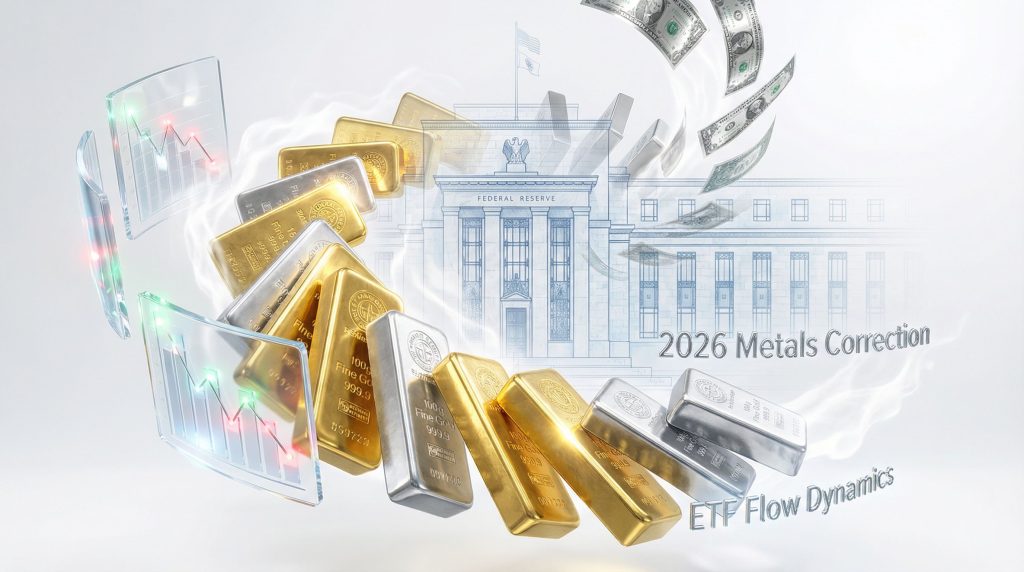
Macroeconomic Context of the 2026 Metals Correction
The extraordinary precious metals correction reflects deeper structural imbalances that accumulated throughout the unprecedented monetary expansion cycle. Exchange-traded product mechanics have fundamentally altered how precious metals markets absorb and amplify economic shocks, creating leverage dynamics that extend far beyond traditional futures markets.
Central bank monetary policies worldwide created artificial price trajectories that became increasingly disconnected from underlying supply-demand fundamentals. The ProShares AGQ leveraged silver ETF exemplifies this distortion, achieving +158% year-to-date gains through late January 2026 before experiencing a dramatic -60% single-day decline, effectively erasing months of accumulated profits.
Furthermore, the silver market squeeze demonstrates how modern financial engineering can amplify both upward momentum and subsequent corrections beyond historical precedents.
Global liquidity conditions enabled speculative positioning at unprecedented scales. The iShares SLV silver ETF generated trading volumes that exceeded major equity index funds during peak volatility periods, indicating retail participation levels typically associated with speculative bubbles rather than traditional safe-haven accumulation patterns.
ETF Flow Dynamics and Market Structure Impact
Exchange-traded product flows have become primary drivers of precious metals price discovery, fundamentally altering market structure compared to traditional commodity trading patterns. The following analysis reveals how these modern instruments create systemic amplification effects:
| ETF Product | Peak Performance | Maximum Decline | Net Result |
|---|---|---|---|
| ProShares AGQ (3x Silver) | +158% YTD | -60% Single Day | +3% YTD |
| iShares SLV | Volume exceeded SPY | Significant outflows | Trading disruption |
| SPDR GLD | Record volume activity | $40B daily turnover | All-time highs |
The $40 billion daily turnover recorded in State Street's GLD gold ETF represents an unprecedented level of institutional and retail participation, comparable to major market-wide liquidity events such as the 2008 financial crisis or March 2020 pandemic-driven selling. This volume magnitude suggests systematic deleveraging rather than conventional profit-taking behaviour.
Retail versus institutional participation patterns reveal concerning imbalances. Exchange-traded product turnover typically indicates retail positioning adjustments, while primary dealer creation/redemption activity reflects institutional flows. The extraordinary volume levels recorded during the correction period suggest retail capitulation rather than strategic institutional repositioning.
Leverage unwinding across futures and ETF products created cascade effects that amplified downward pressure beyond fundamental price discovery mechanisms. Three-times leveraged products require daily rebalancing that forces mechanical selling during decline periods, creating artificial supply pressure independent of investor sentiment or economic fundamentals.
When big ASX news breaks, our subscribers know first
What Triggered the Sharp Reversal in Precious Metals Markets?
Federal Reserve Policy Expectations and Dollar Dynamics
The announcement of Kevin Warsh as a Federal Reserve appointment candidate fundamentally shifted market expectations regarding future monetary policy direction. Financial markets interpreted this nomination as signalling a more measured approach to interest rate policy, contradicting earlier expectations of aggressive accommodation measures.
However, analysis from The Conversation suggests that markets had previously anticipated substantial rate cuts regardless of inflation or employment data, with Warsh's reputation as a measured policymaker creating disappointment relative to those dovish expectations.
Currency dynamics present an apparent paradox in the gold and silver price decline narrative. Despite precious metals experiencing their sharpest corrections in decades, the U.S. dollar simultaneously retained significant losses accumulated in preceding weeks. This disconnect suggests that factors beyond traditional dollar strength drove the metals sell-off, indicating more complex market mechanics than conventional safe-haven theory predicts.
The Federal Reserve policy expectation reversal created a fundamental reassessment of opportunity costs associated with holding non-yielding assets. When markets anticipate lower real interest rates, precious metals become more attractive relative to yield-bearing alternatives. Warsh's appointment signalled potential resistance to extreme monetary accommodation, effectively increasing the relative attractiveness of dollar-denominated fixed-income instruments.
Technical Market Structure Breakdown
Margin call cascades represent a critical but often overlooked transmission mechanism during precious metals corrections. The following sequence illustrates how leverage unwinding accelerates price declines:
- Initial Price Decline: Spot precious metals experience modest selling pressure
- Variation Margin Calls: Futures traders receive margin calls requiring additional capital
- Forced Liquidation: Unable to meet margin requirements, traders liquidate positions
- ETF Rebalancing: Leveraged ETFs automatically sell exposure to maintain target ratios
- Stop-Loss Activation: Retail investors' stop-loss orders trigger additional selling
- Liquidity Evaporation: Market makers widen bid-ask spreads during volatility spikes
Algorithmic selling pressure contributed significantly to the correction magnitude. Modern precious metals trading involves substantial algorithmic participation that can amplify movements during stress periods. These systems often employ momentum-based strategies that accelerate selling when technical support levels are breached.
Stop-loss clustering at psychologically significant price levels created artificial support and resistance zones that became focal points for automated selling. When precious metals breached these technical levels, concentrated stop-loss orders triggered simultaneously, overwhelming available bid liquidity and exacerbating price declines.
How Do Current Price Levels Compare to Historical Precedents?
Historical Volatility Patterns in Bull Market Corrections
The recent precious metals decline represents the most significant correction since the 1920s for gold and establishes new records for silver volatility. Historical analysis reveals that secular bull markets in precious metals typically experience periodic corrections of 25-40% before resuming upward trajectories.
| Historical Period | Peak-to-Trough Decline | Recovery Timeline | Final Bull Market Peak |
|---|---|---|---|
| 1970s Gold Bull | -32% (1975-1976) | 18 months | +2,300% total return |
| 2000s Gold Bull | -26% (2008 crisis) | 24 months | +650% total return |
| Current Cycle | TBD | TBD | Ongoing |
Volume and momentum indicators during the current correction show similarities to previous bull market interruptions rather than secular bear market commencements. The extraordinary ETF trading activity, while concerning from a stability perspective, often indicates capitulation phases that precede trend resumption rather than permanent trend reversals.
In addition, percentage retracement analysis suggests current price levels remain within historical ranges for bull market corrections. Furthermore, current technical gold analysis shows that gold's decline from recent peaks maintains price levels substantially above long-term moving averages, while silver's volatility, though extreme, reflects its traditional role as the more speculative precious metals investment.
Valuation Metrics Versus Fundamental Drivers
Real inflation-adjusted pricing analysis reveals that current precious metals valuations, despite recent corrections, remain elevated compared to historical purchasing power metrics. This suggests that fundamental demand drivers continue supporting higher price levels than traditional inflation-hedging models would predict.
Central bank accumulation trends provide crucial fundamental support that distinguishes the current cycle from previous speculative episodes. Global gold demand achieved record highs throughout 2025, with central banks continuing systematic accumulation programs designed to reduce dollar-denominated reserve dependency.
Key fundamental support levels across different economic scenarios include:
• Inflation persistence scenario: Central bank accumulation maintains price floors above historical averages
• Recession scenario: Safe-haven demand typically increases during economic contraction periods
• Currency crisis scenario: Precious metals benefit from dollar debasement concerns
• Technological demand growth: Silver industrial applications continue expanding regardless of investment sentiment
What Are the Underlying Economic Forces Still Supporting Precious Metals?
Fiscal Policy and Monetary System Pressures
Structural fiscal imbalances across major economies create persistent pressure for monetary accommodation, regardless of short-term policy expectations. Global debt-to-GDP ratios have reached levels that historically correlate with currency debasement and increased precious metals demand.
Advanced economies maintain aggregate debt-to-GDP ratios exceeding 100%, creating structural pressure for financial repression policies that benefit real assets over nominal financial instruments.
De-dollarisation trends among emerging market central banks represent a secular shift that supports precious metals demand independent of cyclical economic conditions. Countries including China, Russia, and India have systematically increased gold reserves while reducing dollar-denominated holdings, creating persistent bid support for precious metals markets.
Quantitative easing legacy effects continue influencing asset allocation strategies across institutional portfolios. The extraordinary monetary expansion of the past decade created asset price distortions that require ongoing accommodation to prevent deflationary corrections, effectively creating a policy floor under precious metals prices.
Industrial Demand Dynamics for Silver Specifically
Silver's dual role as both precious metal and industrial commodity creates unique demand drivers that distinguish its price dynamics from gold. Technology sector consumption patterns continue expanding across renewable energy, electronics manufacturing, and emerging applications in battery technology and medical devices.
| Application Sector | Annual Demand (Million oz) | Growth Rate | Price Sensitivity |
|---|---|---|---|
| Solar Panels | 130-150 | +8-12% annually | Moderate |
| Electronics | 180-200 | +3-5% annually | High |
| Automotive | 55-65 | +15-20% annually | Low |
| Medical Devices | 25-35 | +10-15% annually | Very Low |
Supply constraint analysis from mining production data reveals structural deficits that support higher silver prices over extended periods. Primary silver production has remained relatively flat despite increased demand across industrial applications, creating fundamental supply-demand imbalances that monetary policy cannot directly influence.
Technology sector expansion into artificial intelligence, electric vehicle manufacturing, and renewable energy infrastructure creates secular demand growth that provides price support during financial market corrections. These industrial applications represent inelastic demand that continues regardless of investment sentiment or monetary policy changes.
Which Market Scenarios Could Drive Future Price Direction?
Bullish Case: Continued Monetary Debasement Scenario
Several catalysts could reignite precious metals momentum despite recent corrections:
- Federal Reserve policy reversal due to economic weakness or financial stability concerns
- Inflation acceleration beyond central bank tolerance levels requiring accommodation
- Geopolitical crisis escalation increasing safe-haven demand globally
- Currency crisis emergence in major economies driving precious metals accumulation
- Central bank acceleration of gold accumulation programs amid dollar concerns
Inflation persistence calculations suggest that real interest rates remain negative across major economies when using alternative inflation measures that include asset prices and healthcare costs. Negative real yields historically correlate with precious metals outperformance over extended periods.
Geopolitical risk premium quantification methods indicate that current precious metals prices inadequately reflect potential crisis scenarios involving trade wars, military conflicts, or currency system disruptions. Consequently, historical analysis suggests geopolitical premiums of 10-25% above fundamental valuations during crisis periods.
Bearish Case: Policy Normalisation and Dollar Strength
Federal Reserve credibility restoration could significantly impact safe-haven demand for precious metals. If policymakers successfully reduce inflation while maintaining economic growth, the opportunity cost of holding non-yielding assets increases substantially.
Rising real interest rates historically reduce precious metals valuations by increasing the opportunity cost of holding non-yielding assets relative to interest-bearing alternatives.
Economic growth acceleration scenarios could reduce defensive asset allocation preferences among institutional investors. Strong economic performance typically correlates with reduced precious metals demand as investors rotate toward growth-oriented equity and credit instruments.
Dollar strength driven by superior U.S. economic performance or interest rate differentials could pressure precious metals prices through both opportunity cost and foreign exchange mechanisms. Historical analysis shows that sustained dollar appreciation periods often correspond with precious metals bear markets.
Base Case: Consolidation Within Secular Bull Market
Most institutional analysis suggests precious metals will experience consolidation within ongoing secular bull market trends rather than dramatic directional moves. The following table summarises major investment bank perspectives:
| Institution | Gold Price Target | Silver Price Target | Timeline | Key Assumption |
|---|---|---|---|---|
| Goldman Sachs | $4,200-4,800/oz | $45-55/oz | 12-18 months | Continued accommodation |
| JPMorgan Chase | $3,800-4,200/oz | $35-45/oz | 18-24 months | Gradual normalisation |
| Bank of America | $4,000-5,000/oz | $40-60/oz | 24-36 months | Structural demand growth |
Volatility expectations suggest trading ranges of $3,500-5,500/oz for gold and $25-65/oz for silver over the next 12-18 months. These ranges reflect ongoing uncertainty regarding monetary policy direction while acknowledging fundamental support levels.
Timeline analysis for potential trend resumption indicates that precious metals bull markets typically resume within 6-18 months following major corrections, assuming fundamental drivers remain intact. Current correction magnitude and duration suggest potential trend resumption during the second half of 2026, particularly when considering the gold price forecast for the coming period.
How Should Investors Position for Precious Metals Going Forward?
Risk Management Strategies for Metals Exposure
Portfolio allocation frameworks during high volatility periods require careful consideration of correlation dynamics and position sizing relative to total portfolio risk tolerance:
• Conservative allocation: 5-10% precious metals exposure through physical holdings and established ETFs
• Moderate allocation: 10-20% exposure combining physical metals, mining equities, and ETF positions
• Aggressive allocation: 20%+ exposure including leveraged products and junior mining companies
• Tactical allocation: Variable positioning based on technical indicators and sentiment measures
Hedging techniques using options and futures markets can provide downside protection while maintaining upside exposure. Put option strategies on precious metals ETFs offer defined-risk protection during volatile periods, while collar strategies combine put purchases with call sales to reduce net hedging costs.
Precious metals allocation should not exceed an investor's ability to withstand 40-50% corrections without forcing liquidation, based on historical volatility analysis and correlation studies during market stress periods.
Timing Considerations and Market Entry Points
Technical support level identification methodology suggests focusing on long-term moving averages and previous consolidation zones rather than short-term technical indicators during high volatility periods. Gold's 200-week moving average currently provides significant technical support, while silver's historical volatility ranges indicate potential accumulation zones.
Dollar-cost averaging approaches may prove superior to tactical allocation strategies given the difficulty of timing precious metals market inflection points. Historical analysis shows that systematic accumulation during correction periods typically outperforms attempts to identify exact market bottoms.
Furthermore, understanding gold-silver ratio insights can help investors make more informed allocation decisions between the two metals.
Hypothetical Portfolio Scenario Analysis:
Consider a $100,000 portfolio with 15% precious metals allocation:
- Conservative approach: $15,000 divided equally between physical gold, gold ETFs, and silver ETFs
- Growth approach: $10,000 in established metals, $5,000 in quality mining equities
- Speculative approach: $7,500 in physical metals, $7,500 in junior miners and leveraged products
Under various precious metals price scenarios over 24 months, the conservative approach provides stability with moderate returns, while speculative approaches offer higher potential returns with proportionally increased volatility and downside risk.
The next major ASX story will hit our subscribers first
Frequently Asked Questions About Precious Metals Market Dynamics
Why Do Gold and Silver Prices Move Together?
Gold and silver prices exhibit strong positive correlation due to shared monetary properties and similar investor demand patterns during periods of currency uncertainty. Both metals serve as alternatives to fiat currency systems, causing institutional and retail investors to view them as complementary rather than competing assets. However, silver's industrial demand creates additional volatility that can cause temporary price divergences during economic cycles.
How Do Interest Rates Affect Precious Metals Valuations?
Interest rates impact precious metals through opportunity cost calculations and real yield dynamics. When real interest rates (nominal rates minus inflation) increase, the relative attractiveness of yield-bearing assets improves compared to non-yielding precious metals. Conversely, negative real rates historically correlate with precious metals outperformance as investors seek inflation protection and currency alternatives.
What Role Do Central Banks Play in Setting Gold Prices?
Central banks influence gold prices through both direct market participation and monetary policy decisions. Physical gold accumulation by central banks creates fundamental demand that establishes price floors during corrections, while monetary policy affects the opportunity cost calculations that drive investment demand. Recent central bank accumulation trends suggest systematic efforts to diversify away from dollar-denominated reserves.
When Might the Next Major Rally Begin?
Historical analysis suggests precious metals rallies typically commence when fundamental drivers align with technical oversold conditions and sentiment capitulation. Current indicators suggest potential rally catalysts include Federal Reserve policy shifts, inflation acceleration, geopolitical developments, or currency crisis events. Timeline expectations range from 6-18 months based on historical correction and recovery patterns during secular bull markets.
However, investors should note that despite recent volatility, many analysts still expect record high gold prices to emerge once market conditions stabilise and fundamental drivers reassert themselves in the precious metals market.
Disclaimer: This analysis is for educational purposes only and does not constitute investment advice. Precious metals investments carry substantial risk of loss and may not be suitable for all investors. Market forecasts and price predictions are speculative and subject to significant uncertainty. Investors should conduct independent research and consult qualified financial advisors before making investment decisions. Past performance does not guarantee future results, and precious metals markets can experience extended periods of volatility and decline.
Ready to Capitalise on the Next Major Mineral Discovery?
Discovery Alert's proprietary Discovery IQ model delivers instant alerts on significant ASX mineral discoveries, providing subscribers with actionable insights to identify opportunities ahead of the broader market. Understand why major mineral discoveries can lead to substantial market returns by exploring Discovery Alert's dedicated discoveries page, showcasing historic examples of exceptional outcomes, and begin your 14-day free trial today to position yourself ahead of the market.