June 19, 2026
When the Strait Becomes a Variable: Understanding the IEA Oil Demand Fall and 2026 Deficit
Energy markets have long been shaped by the assumption that critical maritime chokepoints remain accessible. The Strait of Hormuz, through which roughly one-fifth of global oil supply moved before hostilities began between the US, Israel, and Iran, has always been treated as a geopolitical pressure point but rarely as a genuine supply removal mechanism. That assumption has now been stress-tested in real time, and the consequences are being felt across every layer of the global economy.
The IEA oil demand fall and 2026 deficit picture that has emerged from the agency's May 2026 Oil Market Report represents something qualitatively different from previous energy shocks. This is not a repeat of 2020's demand collapse caused by economic shutdown, nor is it the sharp but temporary price spike that followed Russia's 2022 invasion of Ukraine. What is unfolding now involves simultaneous demand destruction and supply removal at a scale that has overwhelmed the market's self-correcting mechanisms.
When big ASX news breaks, our subscribers know first
A Forecast Reversal Without Precedent Outside a Pandemic
To understand the weight of the IEA's May 2026 revision, it helps to trace the trajectory of its own forecasting. Prior to the outbreak of conflict in early 2026, the agency was projecting global oil demand growth of 640,000 barrels per day (b/d) for the year. By April, that figure had already shifted to a projected contraction of 80,000 b/d. The May revision takes the outlook to a contraction of 420,000 b/d, landing total 2026 demand at 104 million b/d.
That represents a swing of more than 1 million b/d within a single forecast cycle. To put this in context, revisions of this magnitude have historically occurred only during global pandemics or financial crises. The IEA's willingness to make this adjustment mid-year signals that the agency is treating the current conflict as a structural event, not a temporary disruption that markets will absorb naturally. Furthermore, understanding crude oil price trends in the lead-up to this crisis provides essential context for how dramatically expectations have shifted.
The scale of this forecast reversal effectively communicates that the agency no longer views Hormuz disruption as a manageable shock to be smoothed out by inventory drawdowns and alternative supply routing. It is being modelled as a persistent structural constraint on global supply.
The Anatomy of Demand Destruction: Sector by Sector
One of the most analytically significant aspects of the current situation is where demand is falling. Not all consumption reductions are equal. Demand destruction, as distinct from demand deferral, implies that some portion of lost consumption will not return even after the conflict ends.
The IEA's May 2026 report identifies the petrochemical sector as the most severely affected area. Feedstock availability for LPG, ethane, and naphtha has become materially constrained as Gulf supply chains have been disrupted. Downstream chemical producers in Asia are facing both input shortages and margin compression, with cascading effects moving through plastics, packaging, and manufacturing supply chains.
The sector breakdown of demand losses illustrates the uneven nature of the shock:
| Sector | Estimated Demand Loss (b/d) | Primary Driver |
|---|---|---|
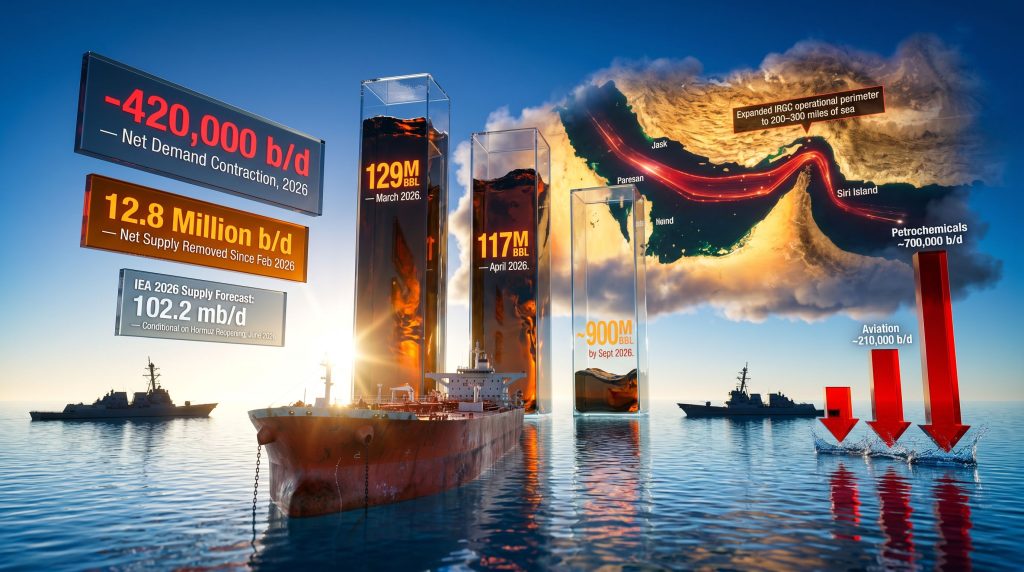
| LPG / Ethane / Naphtha | ~700,000 | Petrochemical feedstock constraints |
| Jet Fuel / Aviation | ~210,000 | Airspace disruptions and route closures |
| Road Fuels (OECD) | ~240,000 | Price-driven behavioural change |
| Industrial / Non-OECD | ~150,000 net offset | Partial demand resilience in Asia |
| Total Net Contraction | ~420,000 | Combined war and economic effect |
Approximately half of the total demand downgrade from pre-war baselines, or 700,000 b/d, is attributable specifically to LPG, ethane, and naphtha. Aviation contributes a further 210,000 b/d reduction, with Middle Eastern and Asia-Pacific route networks bearing a disproportionate share of that impact. The IEA projects the steepest overall demand hit in the current quarter, forecasting a 2.45 million b/d decline, with 1.5 million b/d of that concentrated in non-OECD countries across the Middle East and Asia-Pacific.
Why Petrochemicals Are the Structural Epicentre
The petrochemical sector's outsized contribution to demand losses reflects a vulnerability that is less visible to mainstream energy commentary but critical to understanding the depth of the disruption. Unlike road fuels or aviation, where consumers can reduce consumption relatively quickly, petrochemical feedstock demand is embedded in industrial production cycles. Manufacturers cannot simply substitute away from naphtha or ethane in the short term.
When Gulf feedstock flows contract sharply, Asian chemical producers face a choice between accepting input shortages, sourcing alternative feedstocks at elevated cost premiums, or curtailing production. Many are doing all three simultaneously. The downstream effects reach well beyond the energy sector, affecting packaging and polymer availability across consumer goods manufacturing.
Supply Removal at Scale: The 12.8 Million Barrel Problem
While demand has contracted sharply, the supply picture is far more severe. Net lost supply since February 2026 stands at 12.8 million b/d, driven by approximately 14 million b/d of shut-in Mideast Gulf production. Partial offsets from increased exports originating in the US, Kazakhstan, Russia, and Venezuela have proven insufficient to meaningfully close the gap.
To contextualise that number: 12.8 million b/d represents approximately 12 to 13 percent of total global consumption. Removing that volume from the market is roughly equivalent to eliminating the entire output of the world's second-largest oil producer overnight. No combination of surge production from non-Gulf suppliers has come close to replacing it.
The IEA's 2026 supply forecast of 102.2 million b/d carries a critical conditional qualifier: it assumes the Strait of Hormuz reopens to commercial tanker traffic in June 2026. Without that assumption, every projection in the agency's current modelling framework requires revision downward. The broader geopolitical landscape for mining and energy sectors alike underscores how deeply interconnected these regional conflicts have become with global commodity flows.
The IRGC's Expanded Operational Perimeter
A development that significantly complicates even the optimistic Hormuz reopening scenario is the IRGC's formal expansion of what it defines as its operational area. On 12 May 2026, Iran's Islamic Revolutionary Guard Corps announced it had widened its Hormuz framework from a narrow geographic corridor around Hormuz and Hengam islands to a zone extending from the coast of Jask to Siri Island (Argus Media, 12 May 2026).
IRGC Navy deputy political director Mohammad Akbarzadeh described the new footprint as a complete crescent, with the operational perimeter expanding from the previous 20 to 30 miles to more than 200 to 300 miles. Siri Island sits roughly 70 kilometres west of the UAE emirate of Umm al-Quwain. This was the second expansion announced since the conflict began, following a 4 May announcement in which the IRGC published maps showing an extended area it described as under its management and control.
Even if a formal ceasefire holds and Hormuz is declared open, the IRGC's expanded operational definition introduces persistent interdiction risk across a maritime zone that commercial shipping cannot simply route around. Tanker insurance premiums and cargo risk pricing reflect this ambiguity.
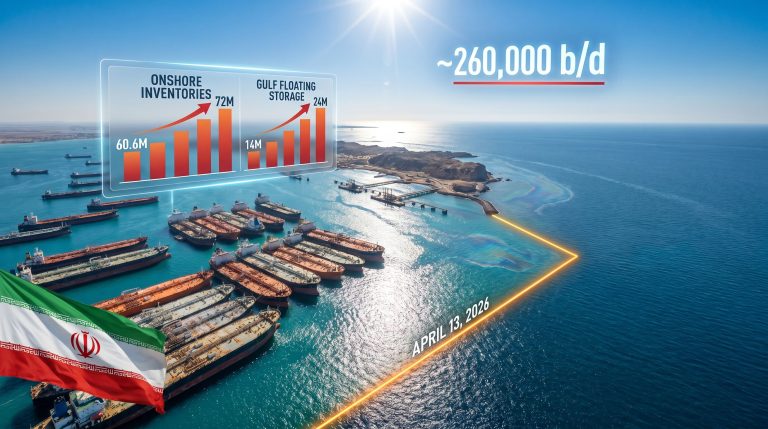
The Inventory Crisis: Speed of Drawdown and the Recovery Arithmetic
The demand contraction has done nothing to prevent a rapid deterioration of global oil inventory levels. With supply removal far exceeding the demand reduction, stocks are being drawn down at a pace that is unprecedented outside of the COVID-19 period.
| Month | Inventory Drawdown |
|---|---|
| March 2026 | 129 million barrels |
| April 2026 (preliminary) | 117 million barrels |
| Projected cumulative drawdown by September 2026 | ~900 million barrels |
The projected cumulative drawdown of approximately 900 million barrels by September 2026 incorporates both commercial inventory reductions and the IEA's co-ordinated emergency stock release activated in March 2026. Rebuilding this deficit requires approximately +1 million b/d of surplus supply sustained for three consecutive years, and that timetable assumes a June 2026 Hormuz resumption.
The IEA's decision to postpone indefinitely its Oil 2026 long-term report, originally scheduled for June and intended to provide analysis and forecasts through to 2031, carries significant analytical weight. It reflects institutional acknowledgement that the trajectory of the conflict has rendered long-term supply and demand modelling unreliable under current conditions.
Three Geopolitical Pathways to 2027
The range of outcomes from this point is wide, and the divergence between scenarios has major implications for energy markets, inflation, and investment allocation globally. Indeed, the trade war impact on oil has already demonstrated how quickly geopolitical tensions can translate into structural market disruptions.
Scenario 1: Negotiated Resolution
The US-Iran ceasefire holds and Hormuz reopens to commercial traffic by June 2026. Supply begins recovering through the second half of the year, demand destruction partially reverses, and inventory rebuild commences. Even under this scenario, the IRGC's expanded operational definition creates persistent ambiguity about the security of passage.
Scenario 2: Prolonged Stalemate
Diplomatic negotiations stall and the ceasefire remains fragile. Hormuz closure extends through Q3 to Q4 2026. Cumulative inventory drawdown exceeds 900 million barrels, petrochemical sector disruption deepens into multiple quarters, and non-OECD demand destruction widens.
Scenario 3: Escalation and Extended Conflict
The ceasefire collapses and IRGC interdiction operations activate across the expanded operational area. The global supply deficit widens beyond the IEA's current modelling range and emergency co-ordinated stock releases accelerate. Structural demand destruction in aviation and petrochemicals becomes semi-permanent.
The diplomatic signals as of mid-May 2026 are not encouraging. US President Donald Trump has characterised Iran's most recent offer as unacceptable, and has publicly stated that the ceasefire in place since 8 April is under significant strain (Argus Media, 11 May 2026). Iran's foreign ministry has countered by describing its own proposals as reasonable and responsible. The negotiating distance between the two parties on core issues, including Iran's nuclear enrichment activities and the disposition of approximately 400 kilograms of highly enriched uranium, remains substantial.
The next major ASX story will hit our subscribers first
Non-Gulf Producers: Opportunity, Caution, and Capital Constraints
US Shale: The Measured Response
Above $100/bl, the production incentive for US shale operators is theoretically unambiguous. In practice, the industry's response has been considerably more restrained than in previous price cycles. The consolidation that has reshaped the shale sector over the past three years has reduced the number of operators capable of rapid drilling acceleration, and the survivors are applying capital discipline that was conspicuously absent during earlier boom cycles.
Diamondback Energy has emerged as one of the first independents to formally shift its drilling posture, signalling a transition from caution to expansion mode in the Permian basin (Argus Media, 11 May 2026). The company is drawing down drilled-but-uncompleted well inventories to maintain output above 520,000 b/d and expects to add two to three rigs while running five completion crews consistently through the remainder of the year. Diamondback's leadership estimates the Permian could absorb 20 to 30 additional rigs industrywide in response to the current price environment, with privately held operators leading the pace.
That figure contrasts sharply with the approximately 100 rigs added during the 2022 Ukraine-driven price rally. The reduced response reflects both sectoral consolidation and a smaller universe of private operators willing to move aggressively on price signals alone.
The major integrated producers have been more circumspect. ExxonMobil, which was already projecting 12 percent Permian output growth to 1.8 million barrels of oil equivalent per day before the conflict, is maintaining its pre-war trajectory rather than accelerating. Chevron, which has moderated Permian growth in favour of cash flow discipline with output just above 1 million boe/d, has signalled that a rapid pivot to volume growth could dilute operational efficiency gains already in progress. EOG Resources is reallocating some capital from natural gas to liquids but keeping overall expenditure unchanged.
Latin America: Strait-Free Advantage and Investment Competition
Brazil, Guyana, and Argentina collectively produce approximately 6 million b/d, a figure that is six times Venezuela's output and well above Mexico's 1.64 million b/d. All three are actively positioning their upstream sectors as strategically advantaged alternatives to Gulf supply, partly because none of their export supply chains transit the Strait of Hormuz.
Brazil recorded a production record of 4.2 million b/d in March 2026. Guyana's output has exceeded 900,000 b/d, driven primarily by the ExxonMobil-led Stabroek block consortium, and Argentina is approaching the same threshold as investment in the Vaca Muerta formation continues to grow. At last week's Offshore Technology Conference in Houston, representatives from all three countries made explicit pitches to upstream investors, highlighting the combination of geological prospectivity and strait-free logistics as competitive advantages (Argus Media, 11 May 2026).
The challenge is capital availability. Globally, two-thirds of energy investment is currently flowing toward renewable energy, according to IEA forecasts. Latin American upstream expansion is structurally compelling but must compete for a shrinking share of fossil fuel investment capital in an environment where renewables command both policy priority and institutional investor preference.
Latin America's upstream window may be narrower than its geology suggests. The combination of record production, Hormuz-free supply routes, and proven deepwater prospectivity creates a compelling investment case, but capturing capital requires governance stability and investment framework predictability that some of these countries are still working to establish.
Consumer Policy Response: Fuel Tax Relief and Its Fiscal Limits
On the demand side, US policymakers are examining available tools to cushion consumers from the impact of sustained high fuel prices. US average retail gasoline reached $4.45/USG in the week ending 4 May 2026, approaching a four-year high. President Trump has publicly backed suspension of the federal excise tax on gasoline, currently set at 18.4 cents per USG, alongside the diesel tax of 24.4 cents per USG (Argus Media, 11 May 2026).
The fiscal arithmetic of a tax suspension is not straightforward:
- Suspending both the gasoline and diesel taxes would cost an estimated $39 billion per year
- A one-year tax holiday would exhaust the US Highway Trust Fund by June 2027, fourteen months ahead of schedule
- The policy has bipartisan political support, with both Republican and Democratic senators having introduced related bills
- Congressional approval is required before any suspension can take effect
The policy paradox is real. Fuel tax relief provides meaningful short-term consumer savings but directly undermines road and highway funding infrastructure. There is no mechanism at current scale to offset the demand destruction caused by sustained high fuel prices without creating significant fiscal collateral damage.
The Energy Transition Dimension: An Unintended Accelerant
One underappreciated dimension of the current shock is its potential to function as an involuntary accelerant of energy transition in specific sectors. Sustained high fuel prices create substitution incentives that policy alone cannot manufacture. In aviation and petrochemicals, where demand destruction is currently most acute, some portion of the reduced consumption will not recover even if the conflict resolves.
Airlines accelerating fleet renewal toward more fuel-efficient aircraft, chemical producers investing in alternative feedstock pathways, and industrial consumers accelerating electrification are all responding rationally to a price signal that may persist longer than previous cycles. The IEA's revised forecast implicitly models some element of permanent demand loss alongside the cyclical suppression. In this respect, the energy transition in mining and heavy industry more broadly is being shaped as much by conflict-driven price shocks as by deliberate policy.
This creates a genuinely bifurcated investment landscape. High oil prices incentivise upstream fossil fuel expansion at exactly the moment that two-thirds of global energy investment is flowing to renewables and transition technologies. Capital allocation decisions made in 2026 and 2027 will shape supply capacity well into the next decade, regardless of how the current conflict resolves. Furthermore, OPEC's market influence continues to be a critical variable in how quickly any post-conflict supply recovery could materialise.
Frequently Asked Questions: IEA Oil Demand Fall and 2026 Deficit
What is the IEA's current forecast for global oil demand in 2026?
The IEA's May 2026 Oil Market Report projects global oil demand at 104 million b/d in 2026, representing a contraction of approximately 420,000 b/d compared to 2025 levels. This is a dramatic reversal from the pre-conflict forecast of 640,000 b/d demand growth for the same year.
Why does a supply deficit persist despite falling demand?
Even with demand contracting, net supply losses from the Mideast Gulf of approximately 12.8 million b/d far exceed the reduction in consumption. The result is a persistent supply-demand imbalance that is drawing down global inventories at a rate exceeding 100 million barrels per month. The IEA oil demand fall and 2026 deficit dynamic is, consequently, driven more by the supply side than by any weakening of underlying consumption trends.
How much have global oil inventories fallen in 2026?
Global oil stocks declined by 129 million barrels in March and a preliminary 117 million barrels in April 2026. Including co-ordinated IEA emergency releases, the cumulative drawdown could reach approximately 900 million barrels by September 2026.
What would rebuilding global oil inventories require?
The IEA estimates that restoring depleted stocks would require approximately +1 million b/d of surplus supply sustained over three consecutive years, and that estimate assumes Hormuz reopens to tanker traffic by June 2026.
Why has the IEA postponed its Oil 2026 long-term report?
The Oil 2026 report, intended to provide analysis and forecasts through to 2031, has been postponed from its scheduled June 2026 release to an unspecified later date. The delay reflects the IEA's institutional acknowledgement that the ongoing conflict and supply uncertainty make long-term modelling unreliable under current conditions.
Key Data Points: The 2026 Oil Market at a Glance
- -420,000 b/d: Net contraction in global oil demand projected for 2026, a swing of over 1 million b/d from pre-war forecasts
- 12.8 million b/d: Net supply removed from global markets since February 2026
- ~900 million barrels: Projected cumulative inventory drawdown by September 2026
- 3 years: Estimated time required to rebuild depleted stocks at +1 million b/d surplus
- 102.2 million b/d: IEA's 2026 supply forecast, conditional on Hormuz reopening in June
- 200 to 300 miles: IRGC's expanded operational perimeter in the Hormuz region, up from 20 to 30 miles previously
This article is based on publicly available market intelligence and is intended for informational purposes only. It does not constitute financial or investment advice. Forecasts, scenarios, and projections referenced herein involve inherent uncertainty and should not be relied upon as predictive of actual market outcomes. Readers are encouraged to consult qualified professional advisers before making investment decisions.
Want to Track the ASX Mining and Energy Stocks Most Exposed to These Market Shifts?
Discovery Alert's proprietary Discovery IQ model delivers real-time alerts the moment significant mineral discoveries are announced on the ASX, translating complex commodity and geopolitical data into actionable investment insights — explore the historic returns major discoveries have generated and start a 14-day free trial at Discovery Alert to position yourself ahead of the market.