
June 20, 2026
When Momentum Stalls: Reading the Precious Metals Correction With Discipline
Corrections in precious metals markets are not anomalies. They are a structural feature of every bull market cycle, and the investors who navigate them most effectively are those who understand what is actually happening beneath the surface of price movement. Raw price data tells only part of the story. The deeper signal lies in the behaviour of momentum, correlation shifts between asset classes, and the subtle mechanics of volume and volatility compression. In late April 2026, gold and silver are exhibiting precisely these characteristics simultaneously, making the current environment one of the more technically significant inflection points of the past year for anyone following a gold and silver price forecast lower levels thesis.
When big ASX news breaks, our subscribers know first
Gold and Silver in Late April 2026: What the Price Structure Reveals
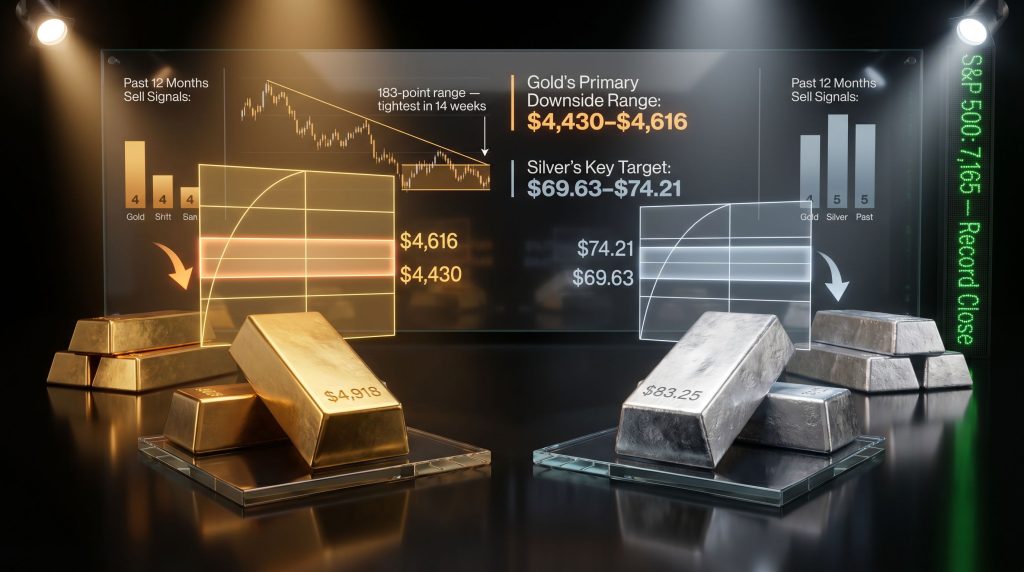
Following a remarkable rally through the first quadrimester of 2026, both gold and silver have entered a consolidation phase that carries meaningful near-term implications. Gold settled around $4,725 after pulling back from its April 17 peak of $4,918, while silver settled near $75.69 after reaching $83.25 on the same date. Both dominant cycle lows were recorded on March 22, 2026, with gold bottoming at $4,129 and silver at $61.21.
What makes this consolidation phase noteworthy is not just the price retreat itself, but the accompanying compression in volatility. Gold's weekly trading range narrowed to just 183 points during the week ending April 25, 2026, making it the tightest weekly range in 14 weeks. The expected weekly trading range for gold remains a comparatively robust 349 points, and the expected daily range sits at 112 points, suggesting that the current compression is a temporary condition rather than a permanent shift in character.
Contract volume in April has run comparably subdued relative to March, a development that reflects reduced conviction among participants at current price levels. When price consolidates on declining volume, it typically signals that the prior directional impulse is losing energy. This observation, taken together with near-term technical sell signals across multiple frameworks, builds a coherent case for at least a moderate additional correction before any resumption of the broader uptrend.
The 21-Day Linear Regression Consistency Model and Why It Matters
One of the more nuanced leading indicators applied to precious metals markets involves measuring the consistency of short-term directional momentum rather than simply tracking price direction itself. The 21-day linear regression consistency model, sometimes referred to in technical analysis circles as the "Baby Blues," measures whether a market's short-term trend is accelerating or deteriorating on a day-to-day basis.
The critical threshold within this framework is the +80% level. When the consistency reading falls through this level to the downside, historical data suggests near-term price weakness is likely in the following period. This is a leading indicator rather than a lagging confirmation, meaning the signal precedes the price deterioration rather than confirming it after the fact.
As of late April 2026, both gold and silver have seen their respective readings breach the +80% threshold to the downside. This is significant because the signals arrived within 24 hours of each other, suggesting synchronised momentum deterioration across both metals rather than idiosyncratic price action in one.
Historical Sell Signal Performance Over the Prior 12 Months
The table below summarises the performance history of these sell signals over the past year, based on analysis published at Gold-Eagle.com by independent market analyst Mark Mead Baillie:
| Metal | Sell Signals (Past 12 Months) | Outcome Window | New Active Signals |
|---|---|---|---|
| Gold | 4 signals | Within 21 trading days | 1 (outcome pending) |
| Silver | 5 signals | Within 21 trading days | 1 (outcome pending) |
Both newly active signals remain unresolved as of late April 2026. Historical precedent across the prior set of signals tracked meaningful price drawdowns within the 21-trading-day window in each case, though the magnitude varied.
Important Disclaimer: Past signal performance does not guarantee future outcomes. Technical indicators are probabilistic tools, not certainties. Investors should use these signals as one input within a broader risk management framework, not as standalone trade directives.
Fibonacci Retracement Analysis: Gold's Downside Target Range
With the price structure alone offering limited directional guidance following the pullback from recent highs, Fibonacci retracement analysis provides a structured framework for identifying where buyers may re-engage. This methodology identifies mathematically derived price zones where the balance between buyers and sellers has historically shifted. Furthermore, when combined with momentum signals, these zones become considerably more actionable for disciplined investors tracking gold price forecasts.
Gold's Key Fibonacci Levels
Using the dominant recent low of $4,129 (March 22, 2026) and the dominant recent high of $4,918 (April 17, 2026), the key retracement levels are as follows:
| Retracement Level | Price Target | Distance from April 17 High |
|---|---|---|
| 38.2% retracement | $4,616 | -$302 |
| 61.8% retracement (Golden Ratio) | $4,430 | -$488 |
| 78% retracement (deeper correction) | $4,568 | -$350 |
| 200-day EMA structural support | ~$4,200 | -$718 |
The $4,430 to $4,616 band represents the Golden Ratio retracement zone and is considered the most technically significant area where buying interest may re-emerge with sufficient conviction to stabilise price. A sustained break below $4,430 would shift attention toward the $4,200 to $4,300 structural support band, anchored by the long-term 200-day exponential moving average.
Analyst Note (Mark Mead Baillie, Gold-Eagle, April 26, 2026): The preferred scenario remains one where both metals simply resume their upward trajectory without testing these retracement levels. However, the technical framework demands preparation for the alternative.
Fibonacci Retracement Analysis: Silver's Downside Target Range
Silver's price structure carries its own set of Fibonacci dynamics, and the current position of the white metal relative to its retracement levels is particularly instructive. In addition, understanding silver's dual demand profile — spanning both monetary and industrial drivers — helps contextualise why its retracement levels attract such close attention from a diverse range of market participants.
Silver's Key Fibonacci Levels
Using the dominant recent low of $61.21 (March 22, 2026) and the dominant recent high of $83.25 (April 17, 2026), the key retracement levels are:
| Retracement Level | Price Target | Distance from April 17 High |
|---|---|---|
| 38.2% retracement | $74.21 | -$9.04 |
| 50% retracement | $72.23 | -$11.02 |
| 61.8% retracement (Golden Ratio) | $69.63 | -$13.62 |
| 200-day EMA structural support | ~$63.00 | -$20.25 |
Silver settled at $75.69 as of late April, placing it just above the 38.2% retracement level of $74.21. This proximity to the first meaningful Fibonacci level is important: a sustained break below $74.21 would technically open the pathway toward the Golden Ratio target of $69.63.
The $70 level has demonstrated structural significance in 2026, having held on multiple prior tests. This makes it a closely watched zone for both technical traders and longer-term investors looking to accumulate at better valuations.
Silver's greater percentage distance from the top of its market profile (-9.0% versus gold's -3.7%) reflects the white metal's characteristically higher beta. Silver amplifies both upside and downside moves relative to gold, a dynamic that veteran precious metals investors account for in position sizing. Consequently, monitoring the gold-silver ratio analysis during these corrective phases can provide additional clarity on relative value between the two metals.
The Oil-Dollar-Gold Correlation: A Key Driver of Near-Term Weakness
The macro backdrop complicating any near-term gold and silver price forecast lower levels assessment involves an important and often underappreciated inter-market dynamic. Since the commencement of the USA/Iran conflict on February 28, 2026, gold and crude oil have entered a phase of negative correlation within the broader BEGOS market framework, which tracks the interrelationships between Bonds, the Euro, Gold, Oil, and the S&P 500.
The transmission mechanism works as follows:
- Geopolitical conflict disrupts oil supply routes or creates restriction of transit, pushing crude oil prices higher.
- Because oil is globally priced and transacted in US dollars, rising crude demand translates into rising demand for US dollars.
- Elevated dollar demand strengthens the US Dollar Index, which creates a headwind for gold pricing.
- Gold, priced in dollars, becomes more expensive in foreign currency terms, reducing international demand at the margin.
The US Dollar Index reached a conflict-period high of 100.500 and was trading near 98.340 as of late April 2026. Over the first 78 trading days of 2026, gold declined approximately 10.8% from its early-year peak of $5,296, a drop attributable in significant part to this oil-dollar-gold correlation dynamic.
This negative correlation phase is not necessarily permanent. Historical analysis of precious metals markets demonstrates that gold safe-haven demand often reasserts itself once the initial currency demand surge subsides, particularly if geopolitical uncertainty persists without resolution.
The next major ASX story will hit our subscribers first
Equity Market Resilience: The Unsung Headwind for Safe-Haven Demand
One of the more counterintuitive pressures on gold in the current environment is the sustained strength of equity markets. Historically, precious metals benefit from capital rotation during periods of equity market stress. When equities are performing strongly, the urgency for safe-haven positioning diminishes. However, understanding gold in volatile markets remains essential context, given how rapidly these dynamics can reverse.
The pattern of equity market performance during modern military conflicts is instructive:
| Conflict | S&P 500 Performance at 39 Trading Days |
|---|---|
| Afghanistan (2001) | +6.4% |
| Iraq (2003) | +8.8% |
| Libya (2011) | +4.6% |
| Syria (2014) | +1.4% |
| Iran/USA (2026, current) | +4.2% (record close: 7,165) |
The S&P 500 has now been technically overbought for 12 consecutive trading days as of late April 2026, with a price-to-earnings ratio of 48.5x and a dividend yield of approximately 1.109%, both at historically stretched levels. This combination of elevated valuations and sustained overbought conditions raises the probability of an eventual equity correction, which could catalyse a rotation of capital back toward precious metals.
Speculative Note: If the S&P 500's current overbought condition leads to a correction in the weeks ahead, gold and silver could benefit from renewed safe-haven demand precisely at the technical support levels identified through Fibonacci analysis. This potential alignment of technical and flow dynamics is worth monitoring closely.
Support Converting to Resistance: A Classic Bearish Signal
The 10-day volume-weighted market profile provides another layer of analytical depth to the current precious metals picture. In previous weeks, gold's profile showed meaningful volume support in the $4,800s, and silver's profile showed support around the $79 handle. Both of these zones have now converted into overhead resistance.
This support-to-resistance conversion is one of the most reliable concepts in technical analysis. When a price level that previously attracted buyers instead becomes a level at which sellers dominate, it reflects a fundamental shift in the psychology of market participants. Those who bought at support and are now underwater become motivated sellers on any rally back to their entry level, transforming prior support into a natural resistance ceiling.
Risk Management Principle: The most effective application of this concept is in pre-defining exit levels before entering a position, not after. Knowing where a trade has failed before placing it is the foundation of disciplined capital management, regardless of one's conviction about the broader directional trend.
The Probability Trap: Why 10 Consecutive Wins Do Not Guarantee an 11th
A critical and frequently misunderstood concept in trading and investment decision-making involves the relationship between historical streaks and forward-looking probability. Analysis of gold's four-hour Price Oscillator — one of 405 market rhythm studies tracked across the BEGOS markets on a nightly basis — found that this particular study generated profitable outcomes across 10 consecutive swings from February 5, 2026 onward, with an average swing duration of approximately 5 calendar days.
At $100 per point per contract, the theoretical in-hindsight profit across those 10 swings was significant. However, this historical performance carries an important statistical warning that every investor in precious metals should understand.
The French mathematician Pierre-Simon, Marquis de Laplace, developed what is known as his Rule of Succession. Applied to this case, after 10 consecutive like outcomes, the mathematical probability of an 11th consecutive success is 91.67%. This figure can create a powerful and dangerous psychological pull toward overconfidence.
The critical counterpoint: in the reality of live markets, the actual probability of any single trade outcome remains 50.00%. Historical streaks do not alter the fundamental probability of the next independent event. This distinction between theoretical succession probability and actual market probability is one of the most consequential concepts for retail investors to internalise, particularly when assessing precious metals volatility in conditions where recent success can breed complacency.
The Long-Term Structural Case: Why Corrections Don't Break Bull Markets
Near-term technical weakness and a gold and silver price forecast lower levels thesis do not invalidate the long-term structural drivers that have powered precious metals higher throughout 2025 and into 2026. Understanding the distinction between cyclical corrections within secular bull markets and genuine trend reversals is essential for maintaining perspective.
The long-term structural tailwinds for gold and silver include:
- US federal debt exceeding 120% of GDP, which structurally erodes confidence in fiat currency purchasing power over time.
- Global sovereign debt surpassing 100% of GDP across major developed economies, supporting demand for hard assets as a hedge against currency debasement.
- Anticipated Federal Reserve rate reduction cycles through 2026, which historically correlate with periods of precious metals outperformance as real yields decline.
- Silver's dual demand profile, combining monetary safe-haven characteristics with structural industrial demand growth from the global energy transition and electrification trends.
Institutional price forecasts for 2026 reflect a broad range of outcomes, illustrating the genuine uncertainty that characterises the current macro environment. For instance, J.P. Morgan's silver outlook highlights how varied assumptions about industrial demand and monetary policy can produce dramatically different price targets:
| Institution / Framework | Gold Forecast 2026 | Silver Forecast 2026 |
|---|---|---|
| J.P. Morgan | ~$5,055/oz by Q4 2026 | Conservative range |
| HSBC / Deutsche Bank | Bullish bias | $68-$100/oz |
| UBS / World Bank | Moderate | $41-$65/oz |
| Citigroup | Positive long-term | Up to $100/oz |
| Fibonacci Extension (technical) | Up to ~$7,000 | Up to ~$155/oz |
Note: Institutional forecasts are subject to revision and carry inherent uncertainty. These figures are provided for contextual reference only and should not be construed as investment advice.
Frequently Asked Questions: Gold and Silver Price Forecast Lower Levels
How low could gold prices fall in the near term?
Based on Fibonacci retracement analysis, the primary downside zone spans $4,430 to $4,616. A deeper correction could bring prices toward the $4,200 to $4,300 structural support band anchored by the 200-day exponential moving average.
How low could silver prices fall in the near term?
The Golden Ratio retracement range for silver spans $69.63 to $74.21. The $70 level represents a multi-tested structural floor that has demonstrated reliability on prior occasions in 2026.
What would cause gold and silver to resume their uptrends?
A reversal in dollar strength, a confirmed Federal Reserve pivot toward rate reductions, an equity market correction driving safe-haven rotation, or a resolution of the negative oil-gold correlation dynamic could each serve as catalysts for renewed precious metals strength. Furthermore, Kitco's analysis of upside scope for both metals suggests that Iran and Fed concerns may continue to support prices over the medium term.
What is the gold-to-silver ratio signalling right now?
With gold near $4,725 and silver near $75.69, the gold-to-silver ratio sits at approximately 62:1. Historically, ratios above 80:1 have been associated with silver undervaluation relative to gold. The current reading at 62:1 suggests silver is not at extreme undervaluation, though it may still outperform gold percentage-wise on any recovery given its higher beta characteristics.
Should investors buy the dip in gold and silver?
The longer-term structural case remains intact. However, the appropriate approach involves defining specific risk parameters, identifying key support levels, and establishing exit points before entering positions rather than reacting emotionally to price movements. No single indicator or forecast, including those discussed in this article, should be treated as a certainty.
Key Takeaways: Gold and Silver Price Outlook
- Both gold and silver have generated near-term technical sell signals through the 21-day linear regression consistency model, with the +80% threshold breached to the downside.
- Gold's primary Fibonacci retracement target range sits at $4,430 to $4,616, with deeper structural support near $4,200.
- Silver's primary retracement zone spans $69.63 to $74.21, with the $70 level representing a critical multi-tested structural floor.
- The negative correlation between oil and gold, driven by dollar demand dynamics within the context of the USA/Iran conflict, represents a meaningful near-term macro headwind.
- Prior support zones in both metals have converted to overhead resistance, reinforcing the near-term cautious technical outlook.
- Historical win streaks in technical trading systems do not alter the 50% probability of any single forward trade outcome, a principle that underpins disciplined position sizing and risk management.
- Long-term structural drivers, including sovereign debt levels, currency debasement pressures, and anticipated rate cut cycles, remain firmly in place and continue to support the broader precious metals bull market thesis over a multi-year horizon.
This article is intended for informational and educational purposes only. It does not constitute financial advice. Precious metals markets involve significant risk, and past performance of technical indicators or price models is not indicative of future results. Readers should conduct their own due diligence and consult a qualified financial adviser before making investment decisions.
Want to Stay Ahead of the Next Major Precious Metals Discovery?
While technical analysis helps navigate gold and silver price cycles, the real wealth-building opportunities often emerge from significant new mineral discoveries — and Discovery Alert's proprietary Discovery IQ model delivers real-time ASX alerts the moment those discoveries are announced, turning complex data into actionable insights for investors at every experience level. Explore historic discovery returns on Discovery Alert's dedicated discoveries page and begin a 14-day free trial to position yourself ahead of the broader market.