July 8, 2026
The Mechanics Behind Precious Metals Price Cycles
Precious metals markets have always operated on a rhythm that blends financial psychology, macroeconomic shifts, and deeply structural demand forces. Understanding the gold and silver price outlook requires stepping back from the noise of daily price movements and examining the layered mechanics that govern how bull markets exhaust themselves, consolidate, and ultimately resume their longer-term trajectories. For broader context, the precious metals market analysis for 2025 highlights just how complex these cycles have become.
The current environment is a textbook example of post-rally digestion. After an extraordinary run that took gold to historic highs, the market is now working through a necessary and arguably healthy period of repositioning. The question for investors is not whether this phase will end, but what comes next and when.
When big ASX news breaks, our subscribers know first
Where Gold and Silver Prices Stand in Mid-2025
Reading the Post-Peak Consolidation Pattern
Gold reached a record price level at the end of January 2025, a peak that capped a surge that had been building since August 2024. Since then, the market has undergone a multi-phase pullback, with prices testing progressively lower support zones. A brief recovery emerged in late March and early April before renewed selling pressure resumed.
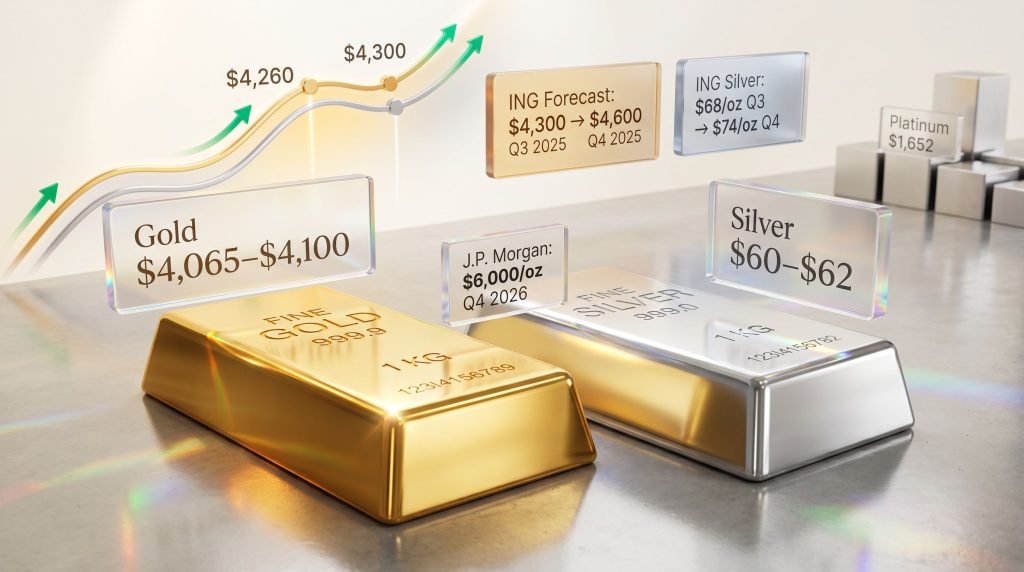
As of early July 2025, gold has been trading in the $4,065 to $4,100 range, having touched as low as $4,065 in recent weeks. A technically significant descending trend line sits near the $4,300 level, and whether prices can break above or fall decisively below this zone is shaping up as the defining technical event for the third quarter.
Silver has tracked a parallel decline, retreating from its 2025 highs and recently testing the $60 to $62 zone. The silver price was sitting near $61.14 in early July sessions, having already tested and briefly broken below the psychologically significant $60 mark.
Key Price Levels at a Glance (July 2025)
| Metal | Current Range | Key Support | Key Resistance | Bearish Risk Level |
|---|---|---|---|---|
| Gold | $4,065–$4,100 | $3,900–$4,000 | $4,260–$4,300 | $3,800 |
| Silver | $60–$62 | $55 | $64 | $50–$55 |
| Platinum | ~$1,652 | $1,500 | $1,800+ | Below $1,500 |
The descending trend line near $4,300 is the single most important technical level for gold heading into Q3 2025. A failure to break above it keeps the door open to a test of $3,800, while a confirmed break above it would shift the momentum picture considerably.
What Is Driving the Selloff in Precious Metals?
Investor Segmentation: Who Is Actually Selling
One of the most analytically important insights from the current correction is that not all sellers are motivated by the same rationale. The gold market is experiencing simultaneous liquidation from at least three distinct investor cohorts, each with different time horizons and exit strategies.
Short-term opportunistic sellers represent perhaps the most significant source of recent selling pressure. The rally from August 2024 through January 2025 attracted a meaningful wave of non-traditional gold investors who entered not out of fundamental conviction but because of momentum. Many of these participants have since unwound their positions, contributing disproportionately to the price decline from peak levels.
Long-duration profit-takers form a second cohort. Some longer-term holders who purchased gold at substantially lower prices have taken profits near the highs, with a portion re-entering around the $4,200 level in a classic institutional buy-the-dip pattern. Others have adopted a more cautious approach, choosing to hold cash and wait to see whether gold tests the psychologically significant $4,000 floor before re-engaging.
Strategic hedgers represent a third group whose behaviour is often overlooked. A subset of long-term physical gold holders purchased put options during the rally phase as portfolio insurance. Having crystallised gains on those puts as prices declined, they retain their underlying physical gold exposure while having effectively monetised the hedge. This group is not net negative on gold; they are simply actively managing their risk profile.
Geographic Divergence in Market Behaviour
The selling pressure is not uniformly distributed across global markets, and understanding the geographic dimension is critical to reading the supply-demand picture accurately.
| Region | Dominant Behaviour | Key Driver |
|---|---|---|
| India | Net selling (near-term) | Profit-taking and local liquidity needs |
| China | Continued physical buying | Government-guided market stabilisation |
| North America and Europe | Mixed: ETF outflows alongside physical accumulation | Macro uncertainty and rate sensitivity |
In China specifically, the government has been executing a multi-year programme to reduce speculative leverage in domestic investment markets. Unlike Western regulatory philosophies, which tend to tolerate a degree of creative destruction through market failures, Chinese policymakers have prioritised investor protection and market stability. This has created a specific context in which government-guided normalisation of leverage trading is occurring alongside continued robust demand for physical gold from retail and institutional buyers.
Despite visible selling pressure in ETF flows and futures markets, underlying physical demand for gold remains structurally intact across major global markets. The liquidation narrative does not capture the full picture.
Macroeconomic and Policy Forces Shaping the Outlook
The U.S. Economy: More Resilient Than Expected
One of the key factors tempering bullish sentiment in 2025 has been the relative resilience of the U.S. economy. Consensus forecasts entering the year anticipated more pronounced economic weakness, which would have historically provided a strong tailwind for precious metals through increased safe-haven demand. Furthermore, gold as a safe haven continues to attract long-term institutional interest even during periods of apparent economic stability.
Instead, the economy has demonstrated surprising durability, reducing the urgency of gold accumulation for defensive purposes. However, the resilience is not uniform. When investment data is disaggregated, a more nuanced picture emerges:
- Business investment outside of AI data centres, cryptocurrency-related energy infrastructure, and associated technology sectors has remained notably subdued.
- Employment growth figures have moderated, providing a mixed signal that is neither weak enough to trigger recession-level fear nor strong enough to sustain aggressive risk-on positioning.
- The concentration of capital into AI and crypto-adjacent infrastructure raises longer-term questions about the sustainability of current growth dynamics and the risk of significant capital misallocation over a multi-year horizon.
Federal Reserve Policy as a Near-Term Catalyst
Upcoming Federal Reserve communications, particularly meeting minutes and key data releases including ISM Services PMI figures, represent near-term binary events for gold and silver. A hawkish tone from the Fed, signalling that rate cuts remain distant, would likely extend downward pressure on non-yielding metals. Conversely, any softening in the Fed's posture, particularly in response to moderating employment or inflation data, could provide the technical catalyst needed to push gold above the $4,260 to $4,300 resistance zone.
The U.S. Dollar in Historical Context
The prevailing narrative around U.S. dollar weakness has been significantly overstated in much financial commentary. When the trade-weighted dollar is assessed against its own history stretching back to the mid-1960s, the currency is currently trading near the middle of its long-run range, not at historically depressed levels.
This matters enormously for the gold and silver price outlook because the degree of dollar weakness is often cited as a primary justification for owning precious metals. The data does not support the conclusion that the dollar is on the verge of a structural collapse.
The dollar is consolidating within a well-established long-run range, not collapsing. Investors who have positioned for an imminent dollar crisis based on recent commentary may be misreading decades of exchange rate history.
Bullish and Bearish Scenarios for Gold in Q3 2025
The Path Higher: What Would Confirm a Bull Resumption
For the gold price to definitively re-enter an uptrend, a specific sequence of technical events would need to unfold:
- A decisive close above the descending trend line resistance near $4,260 to $4,300.
- Price consolidation above the $4,400 level, confirming that the breakout is sustainable.
- A sustained move above the 200-day moving average near $4,500, which would open the pathway toward a longer-term target of $5,000 and potentially beyond.
Institutional forecasters broadly support this directional trajectory over a medium-to-long horizon. J.P. Morgan's gold price projections have maintained an aggressive long-term outlook, projecting gold could average $6,000 per ounce in Q4 2026. ING projects gold averaging $4,300 in Q3 2025 and $4,600 in Q4 2025, reflecting a cautious but constructively bullish stance.
The Downside Scenario: $3,800 and Below
The bearish case is not implausible and should not be dismissed. The conditions that would trigger a more significant selloff include:
- Gold failing to break above the $4,300 resistance and reversing lower.
- A confirmed breach of the $3,900 to $4,000 technical support zone.
- A sustained close below $3,900, which would expose prices to a test of $3,800.
Accelerating factors on the downside would include a hawkish Fed surprise, continued ETF outflows, growing short positioning in futures markets, and any deterioration in physical demand from key Asian markets.
Silver's Dual Identity Creates a Unique Opportunity Profile
Why Silver Behaves Differently from Gold
Silver occupies a structurally distinct position in the commodities universe. Unlike gold, which functions primarily as a monetary and portfolio asset, silver serves simultaneously as a financial hedge and a critical industrial input. This dual identity creates a more complex and volatile price dynamic. In addition, the gold-silver ratio analysis for 2025 offers further insight into how these two metals are currently positioned relative to one another.
The long-term structural case for silver is anchored in its role in electrification infrastructure, including solar photovoltaic panel manufacturing and components used in electric vehicle battery systems and charging networks. These applications underpin persistent silver supply deficits that provide a structural price floor over a multi-year horizon, even when near-term financial flows are bearish.
Silver Price Levels and Scenarios
Bullish pathway:
- A break above $64 would signal renewed upward momentum targeting $72.
- A decisive close above $72 would open the door to an extended move toward the $80 to $90 range.
Bearish pathway:
- Failure to reclaim $64 risks a retest of $55 support.
- A breach of $55 could expose silver to a move toward $50 or lower in the near term.
- Downside to the $40 to $45 range is considered unlikely over the next two to three months under most analytical scenarios.
What Are Major Institutions Forecasting for Silver?
| Institution | Q3 2025 Forecast | Q4/2026 Forecast | Key Rationale |
|---|---|---|---|
| ING | $68/oz | $74/oz | Structural deficit and electrification demand |
| UBS | N/A | $80/oz (year-end 2026) | Supply-demand narrowing, demand headwinds easing |
| CPM Group | $55–$60 range | Recovery post-August | Short-term selling pressure, long-term structural positives |
ING has noted that silver's ongoing supply deficit and its growing role in the global energy transition position it to modestly outperform gold on a percentage basis over the medium term, even if near-term price action remains choppy and frustrating for short-term traders.
The next major ASX story will hit our subscribers first
Geopolitical Risk: Underpriced or Simply Overshadowed?
The Geopolitical Premium Has Not Disappeared
Global political instability remains one of the most persistent and underappreciated tailwinds for gold. The current correction in prices has been driven primarily by financial market mechanics and investor repositioning, not by a fundamental improvement in the geopolitical risk environment.
If anything, the risk landscape has become more complex in mid-2025, with several active flashpoints carrying meaningful implications for central bank gold demand and broader precious metals positioning:
Eastern Europe:
- Ukrainian military operations have extended significantly deeper into Russian territory through the combined use of long-range missiles and drone systems, including drones reportedly smuggled into Russian territory and deployed against military-industrial targets as far as Siberia.
- Russian military responses have focused heavily on civilian infrastructure in Ukraine, a pattern that receives disproportionate media coverage relative to Ukrainian operational successes.
- Intelligence assessments have flagged the possibility of Russian provocations near NATO borders, specifically involving Poland and the Baltic states, as a mechanism for testing alliance cohesion and measuring the Western response given current uncertainties around U.S. foreign policy alignment.
- Reports of Russia closing its borders with Kazakhstan and central Asian republics have raised concerns about potential broad-based military mobilisation, suggesting Russian troop strength may be under significant strain.
Middle East:
- Israeli military operations in Lebanon and Syria continue to expand, with Israeli officials indicating their intention to retain seized territory for the foreseeable future.
- U.S. intelligence has separately warned Turkey that Israeli targeting activity may extend to Turkish assets, adding a significant and underreported layer of regional complexity.
The geopolitical risk premium embedded in gold is being temporarily obscured by financial market mechanics. When the financial selling pressure exhausts itself, the underlying political risk environment could reassert itself rapidly as a price driver.
Platinum and Palladium: Industrial Fundamentals Take Over
PGMs Respond to Different Dynamics
Platinum and palladium occupy a different analytical framework from gold and silver. Their price dynamics are driven primarily by automotive sector demand for catalytic converters and by mine supply concentrated in South Africa and Russia, rather than by financial flows and safe-haven psychology.
Both metals experienced a sharp breakout from a decade-long price consolidation range in early 2025, with platinum reaching record levels before retracing a substantial portion of those gains. Platinum is currently trading near $1,652, approaching a test of the $1,500 support level, which analysts consider a plausible outcome over the coming weeks.
A confirmed break below $1,500 is possible, though longer-term automotive demand is expected to sustain prices above the 2015 to 2025 historical range on a multi-year view. Palladium has already retraced to levels consistent with its 2024 trading range, suggesting that the speculative premium accumulated during the early 2025 rally has been largely unwound.
The Emerging Case for Yield-Bearing Precious Metals
One of the more interesting structural developments gaining traction in the precious metals space is the concept of earning a yield on physical gold and silver holdings. Traditionally, one of the most cited criticisms of gold as an asset class has been its lack of income generation compared to bonds, equities, or real estate.
The expansion of yield-bearing gold mechanisms addresses this structural limitation by allowing investors to retain physical price exposure while earning a return on their holdings. The concept has been part of the professional precious metals landscape for decades but is now reaching a broader retail and institutional investor audience. Analysts tracking gold and silver price projections into 2026 note that this structural shift could influence long-term demand patterns considerably.
Counterparty risk remains a critical consideration. The viability of any yield-bearing gold arrangement depends entirely on the credibility, track record, and financial soundness of the platform or entity facilitating the arrangement. Investors should conduct thorough due diligence before participating in such structures.
Summary: Gold and Silver Price Outlook Key Takeaways
| Factor | Short-Term Signal | Long-Term Signal |
|---|---|---|
| Investor Positioning | Bearish (liquidation ongoing) | Bullish (long-term holders intact) |
| U.S. Economy | Mixed (resilient but softening at the edges) | Uncertain |
| Geopolitical Risk | Elevated across multiple active flashpoints | Persistently supportive of gold |
| Fed Policy | Hawkish risk remains near-term | Easing cycle likely over medium term |
| Technical Levels | Critical: testing key support and resistance | Uptrend structurally intact above $3,800 |
| Gold Forecast Range | $3,800–$4,300 (Q3 2025) | $4,500–$6,000 (2026) |
| Silver Forecast Range | $50–$64 (Q3 2025) | $68–$90 (2026) |
The broader gold and silver price outlook beyond August 2025 leans constructively bullish, supported by structural physical demand, persistent geopolitical risk, and the eventual exhaustion of short-term selling pressure. The near-term risks are real, but they represent a phase within a longer uptrend rather than a fundamental reversal of it.
Frequently Asked Questions: Gold and Silver Prices
Will gold prices recover in the second half of 2025?
The prevailing analytical view across multiple institutional frameworks is that gold prices are likely to resume an upward trajectory after August 2025, once the current wave of short-term selling pressure works itself through the market. The key technical precondition for confirming this is a sustained break above the $4,260 to $4,300 resistance zone. For reference, FX Empire's gold and silver forecast also outlines near-term risks that investors should consider carefully.
What is the biggest near-term risk to gold?
The primary near-term risk is a combination of continued ETF outflows, a hawkish Federal Reserve surprise, and a failure to hold the $3,900 to $4,000 support zone, any of which could trigger a technically driven acceleration lower toward $3,800.
Is silver a better investment than gold in 2025?
Silver carries significantly higher short-term volatility but offers greater percentage upside potential due to its structural supply deficit and growing industrial demand from electrification sectors. Investors with a higher risk tolerance and a medium-term horizon may find silver's risk-reward profile more attractive on a relative return basis.
What price levels should gold investors monitor most closely?
- Resistance levels: $4,260 (descending trend line), $4,400, $4,500 (200-day moving average)
- Support levels: $4,000 (psychological), $3,900 (technical floor), $3,800 (downside risk scenario)
Disclaimer: This article is for informational purposes only and does not constitute financial advice. All price forecasts and analytical projections referenced herein involve significant uncertainty and should not be relied upon as the sole basis for investment decisions. Precious metals markets are subject to high volatility and investors should conduct their own due diligence or consult a qualified financial adviser before making any investment decisions.
Want to Stay Ahead of ASX Mineral Discoveries Linked to Precious Metals Cycles?
While understanding gold and silver price mechanics is essential for informed decision-making, timing entry into ASX-listed precious metals explorers at the moment of a major discovery can be equally transformative — Discovery Alert's proprietary Discovery IQ model delivers real-time alerts the moment significant mineral discoveries are announced on the ASX, turning complex data across 30+ commodities into clear, actionable insights. Explore historic discovery returns on Discovery Alert's dedicated discoveries page to understand how major finds have generated exceptional outcomes, then begin your 14-day free trial at Discovery Alert to position yourself ahead of the broader market.