
August 24, 2026
Understanding the Cyclical Nature of Precious Metals Markets
Precious metals markets have a long memory. Across multiple decades, gold and silver have moved through recognisable phases: extended advances followed by punishing corrections, followed by recoveries that often surprised even experienced market participants in their speed and ferocity. Understanding where the current gold and silver rally sits within this historical architecture is far more valuable than reacting to short-term price action alone.
Secular bull markets in gold and silver are rarely straight lines. They are characterised by powerful multi-year advances interrupted by deep, demoralising corrections that shake out weaker holders and reset sentiment. The correction that preceded the current gold and silver rally was significant by any historical measure.
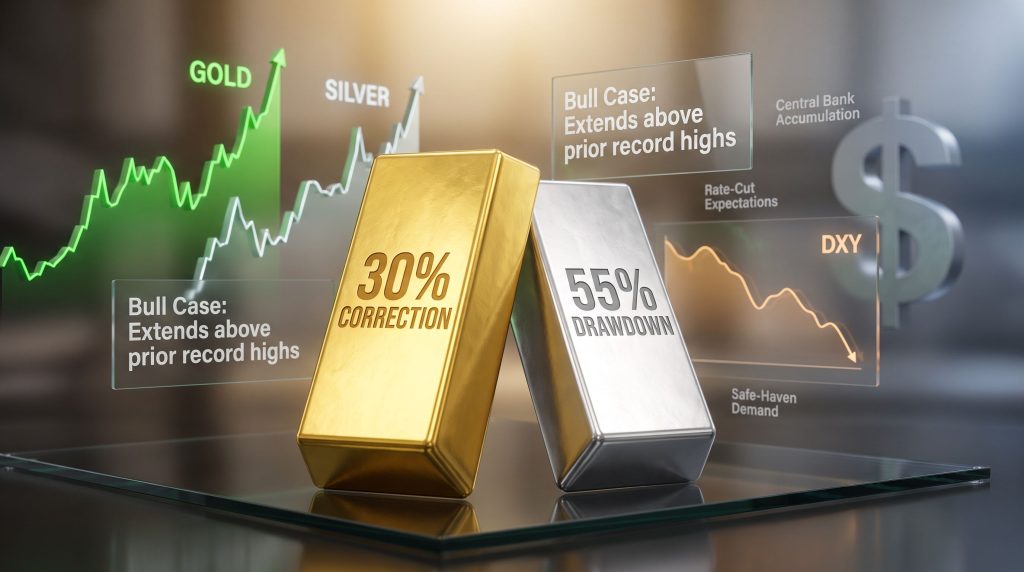
Gold declined approximately 30% from peak to trough over a correction spanning roughly six months. Silver's drawdown was considerably more severe, falling approximately 55% from its peak before stabilising. For investors unfamiliar with silver's behavioural patterns, such a decline can appear catastrophic. However, contextualised within the history of precious metals cycles, a 55% silver correction during a broader bull market is not an anomaly — it is a recurring feature of how silver behaves.
Why Silver Corrects More Deeply Than Gold
Silver's dual role as a monetary metal and an industrial input means its price is influenced by both financial market sentiment and real-world manufacturing demand, including its growing role in solar photovoltaic panels, electronics, and electric vehicle components.
This dual exposure amplifies silver's price swings in both directions. When financial conditions tighten and industrial activity slows, silver faces selling pressure from two fronts simultaneously. When conditions ease, both demand vectors can reinforce each other, creating explosive upside moves. This is why silver's beta relative to gold is structurally higher, meaning silver consistently outperforms gold on a percentage basis during bull phases and underperforms during corrections.
Historical Context: Silver's ~55% drawdown during the mid-cycle correction, while alarming in isolation, is consistent with prior bull market interruptions in precious metals. Markets that endure repeated downward tests without breaking lower typically build the foundation for a more durable subsequent advance.
When big ASX news breaks, our subscribers know first
The Macro Forces Fuelling the Gold and Silver Rally
The recovery from those corrective lows has been driven by a convergence of macro conditions that collectively create a favourable environment for hard asset outperformance. No single factor explains the current gold and silver rally. Rather, it is the overlapping reinforcement of multiple drivers that has given the recovery its momentum.
Dollar Weakness and the Debasement Trade
Gold and silver are priced in U.S. dollars on global markets. When the dollar weakens, these metals become cheaper for buyers holding other currencies, mechanically stimulating demand and supporting prices. Beyond the mechanical relationship, there is a deeper investment thesis at work.
The debasement trade reflects growing concern among institutional investors that years of expansive fiscal policy, rising government debt burdens, and monetary accommodation have structurally eroded the dollar's purchasing power. Hard assets like gold and silver serve as hedges against currency erosion over time. When confidence in fiat currency management deteriorates, allocation toward monetary metals historically increases.
The historical correlation between a weakening DXY (U.S. Dollar Index) and precious metals outperformance is well-documented. Furthermore, periods of sustained dollar decline have consistently coincided with some of the strongest gold and silver bull runs on record. According to live price data, this relationship remains closely tracked by active investors.
Interest Rate Expectations and the Real Yield Effect
Gold is a non-yielding asset. Holding gold has an opportunity cost: the return foregone by not investing in interest-bearing instruments. When real yields (nominal yields adjusted for inflation) are high and rising, that opportunity cost is significant. When real yields fall, particularly into negative territory, the calculus shifts decisively in gold's favour.
The table below illustrates how gold has historically performed across different real yield environments:
| Rate Environment | Real Yield Direction | Gold Performance (Historical Avg.) |
|---|---|---|
| Aggressive tightening | Rising sharply | Underperforms |
| Plateau or pause | Flat | Neutral to positive |
| Easing cycle onset | Falling | Strongly outperforms |
| Negative real rates | Deeply negative | Maximum outperformance |
Expectations that the U.S. Federal Reserve would transition into an easing cycle have been a key catalyst for the current gold and silver rally. As bond markets priced in rate reductions, real yields moved lower, reducing the cost of holding non-yielding metals and attracting capital rotation into the sector.
Geopolitical Risk and the Safe-Haven Premium
Gold safe-haven demand is well-established during periods of elevated geopolitical uncertainty, where institutional and sovereign investors increase their allocations as a capital preservation tool. What matters from an investment standpoint is distinguishing between cyclical safe-haven spikes, which are temporary, and sustained structural demand that persists regardless of short-term resolution of specific conflicts.
The current environment has featured persistent geopolitical complexity, with risk aversion indicators remaining elevated for extended periods. This has contributed to sustained rather than transient demand for gold, supporting a higher price floor than might exist in a more benign geopolitical environment.
Silver benefits from safe-haven demand as well, though its industrial demand component means it does not receive the same pure flight-to-safety allocation as gold. Consequently, this creates an interesting asymmetry: silver can lag gold during acute crisis events, then significantly outperform during the recovery and reflation phase that often follows.
Why Silver Is Outperforming Gold in Percentage Terms
The Gold-Silver Ratio as a Valuation Signal
A thorough gold-silver ratio analysis reveals that when the ratio becomes highly elevated, silver is deeply undervalued relative to gold. Historically, the most explosive phases of silver outperformance have followed periods of ratio extremes. As the ratio compresses during a recovery, silver produces outsized percentage gains relative to gold, even if gold itself is performing strongly.
Industrial Demand as a Silver-Specific Structural Driver
One aspect of silver's investment case that is often underappreciated is the degree to which its industrial demand base provides a structural demand floor that gold simply does not possess. Solar photovoltaic manufacturing alone has become a material source of silver consumption, with each solar panel requiring a measurable quantity of silver paste in its photovoltaic cells.
As global solar installation capacity has expanded rapidly, so too has silver's industrial demand. This is layered on top of its traditional uses in electronics, medical applications, and photography. Crucially, industrial silver demand is relatively inelastic in the short term, meaning industrial buying persists even during periods of elevated prices.
When investment demand surges simultaneously with constrained industrial supply, the resulting price pressure can be substantial. According to analysis from Kitco, ETF inflows into silver funds have historically lagged gold ETF inflows at the early stages of a recovery, meaning there is often a significant wave of retail and institutional investment demand still to arrive in silver when the gold and silver rally is already underway.
The Technical Architecture of the Recovery
What Failed Breakdowns Signal to Technical Analysts
Throughout the summer months preceding the current recovery, both gold and silver experienced repeated attempts by sellers to push prices to new lows. Each of those attempts failed. Prices declined toward prior support levels, sellers applied pressure, and buyers absorbed the selling and reversed prices higher.
In technical analysis, repeated failed breakdowns are interpreted as evidence that selling pressure is becoming exhausted. The market has effectively tested the downside multiple times, found no sustained follow-through, and eventually reversed. This pattern is sometimes described as base-building behaviour, and it is considered a precondition for a sustainable trend resumption rather than a temporary relief rally.
Technical Perspective: When a market tests a price floor multiple times, fails to close decisively below it on each occasion, and then reverses sharply higher, technical analysts interpret this as a signal that the prevailing selling force has been absorbed. The subsequent rally tends to carry more conviction than a simple dead-cat bounce because the supply overhang has been worked through.
Short-Covering and the Amplification of Early Recovery Moves
The initial phase of a recovery from a deep correction is frequently amplified by short-covering. Traders who had positioned for further declines are forced to buy back their positions as prices move against them, adding fuel to the upside move. This mechanical buying can make early recovery moves appear more powerful than the underlying fundamental demand would justify.
Distinguishing between short-covering-driven bounces and genuine demand-driven recoveries requires observing whether the initial move is sustained over subsequent weeks. Both gold and silver progressed from their corrective lows to multi-week highs during the early August recovery phase, a trajectory consistent with genuine demand rather than purely mechanical short-covering.
Who Is Buying Gold and Silver Right Now?
Central Bank Accumulation as a Baseline Demand Driver
One of the most consequential and least discussed drivers of gold's price floor in recent years has been sustained central bank purchasing. Central bank gold demand, particularly from emerging market economies seeking to reduce their exposure to U.S. dollar-denominated reserves, has been a consistent and price-insensitive source of physical buying.
This demand is notable for its price insensitivity. Central banks buying gold as part of a multi-year reserve diversification strategy are not deterred by short-term price movements. They are purchasing gold for structural reasons, meaning their demand provides a reliable baseline that supports prices during corrections and amplifies recoveries.
Mining Equities as a Sentiment Barometer
Gold mining stocks function as a leveraged proxy for gold price expectations. Because mining companies have relatively fixed costs, a rising gold price disproportionately benefits their profit margins. Conversely, during price declines, their profitability contracts sharply. This leverage means mining stocks tend to amplify gold's directional moves and can serve as a leading indicator of where the physical metal may be heading.
The relationship between gold price and mining equities has been closely observed during the current recovery. ASX-listed producers including Northern Star Resources and Evolution Mining have featured prominently in discussions of how the current cycle is translating into equity performance for well-positioned gold producers.
What Could Derail the Rally?
Key Risks Investors Should Monitor
The gold and silver rally is not without vulnerabilities. Several macro conditions, if they materialise, could challenge the current upward trajectory:
- A stronger-than-expected recovery in the U.S. dollar, which would mechanically reduce the appeal of dollar-priced metals
- Federal Reserve policy pivoting toward holding rates higher for longer, or signalling a pause in the easing cycle
- An improvement in geopolitical conditions that reduces the safe-haven premium currently embedded in gold
- Profit-taking by institutional investors following extended gains, particularly in gold mining equities
- A deterioration in industrial demand conditions that reduces silver's demand floor
Investor Caution: The same macro sensitivity that accelerates precious metals rallies can amplify corrections. Silver's ~55% drawdown in the prior cycle is a reminder that high-beta assets can retrace sharply even within broader upward trends. Position sizing discipline and awareness of downside scenarios are essential for investors participating in the current gold and silver rally.
The next major ASX story will hit our subscribers first
Scenario Modelling: Three Pathways Forward
The range of potential outcomes for gold and silver over the near to medium term can be framed across three distinct scenarios, each contingent on a different macro trajectory:
| Scenario | Key Conditions | Gold Trajectory | Silver Trajectory |
|---|---|---|---|
| Bull Case | Dollar weakens further, Fed cuts rates, geopolitical risk persists | Extends above prior record highs | Outperforms gold; ratio compresses significantly |
| Base Case | Gradual Fed easing, stable dollar, moderate risk environment | Consolidates near multi-week highs | Moderate gains, broadly tracks gold |
| Bear Case | Dollar strengthens, Fed pauses, risk appetite improves broadly | Retraces toward prior correction lows | Disproportionate downside given high beta |
Historical analysis of prior gold bull market corrections suggests that the depth of the corrective phase often correlates positively with the strength of the subsequent advance. A ~30% gold correction is not insignificant, and recoveries from corrections of this magnitude have historically produced new all-time highs within multi-year timeframes.
For silver, the pattern of explosive outperformance following deep drawdowns is even more pronounced. The metal's historical tendency to produce percentage gains that dwarf gold's during recovery and bull phases means that investors with sufficient time horizon and risk tolerance have historically been rewarded for holding through deep silver corrections.
Frequently Asked Questions: Gold and Silver Rally
Why are gold and silver rallying right now?
The current gold and silver rally reflects the convergence of multiple macro drivers: Federal Reserve rate-cut expectations that reduce the opportunity cost of holding non-yielding metals, U.S. dollar weakness that mechanically supports dollar-priced commodities, elevated geopolitical uncertainty driving safe-haven allocation, and sustained central bank gold purchasing. Both metals also experienced deep corrections — approximately 30% for gold and 55% for silver — creating technical conditions from which a recovery was structurally probable.
Why is silver outperforming gold on a percentage basis?
Silver carries a structurally higher beta relative to gold. It amplifies gold's directional moves in both directions. It also benefits from growing industrial demand in solar manufacturing, electronics, and electric vehicle components — demand that gold does not share. As investor sentiment toward precious metals improves, silver historically catches up rapidly to gold and then surpasses it in percentage terms during the later stages of bull cycles.
What is the gold-silver ratio and why does it matter?
The gold-silver ratio measures how many ounces of silver are needed to buy one ounce of gold. Elevated ratio readings indicate silver is undervalued relative to gold. Historically, the most powerful silver outperformance phases have followed periods of extreme ratio readings, as the ratio mean-reverts toward historical norms. Monitoring this ratio provides investors with a relative value framework independent of the absolute price of either metal.
Could the gold and silver rally reverse from here?
Yes. A U.S. dollar recovery, a Federal Reserve policy pivot toward tighter conditions, or an improvement in geopolitical stability could each challenge the rally's durability. Silver, given its higher volatility profile, would be particularly exposed to a reversal scenario. Investors should therefore consider the full range of outcomes rather than extrapolating recent momentum indefinitely.
Key Takeaways for Investors
- Gold declined approximately 30% and silver approximately 55% during the mid-cycle correction, both consistent with historical bull market interruptions rather than structural trend reversals
- The gold and silver rally is underpinned by converging macro forces: dollar weakness, falling real yield expectations, geopolitical risk premiums, and sustained central bank demand
- Silver's percentage outperformance relative to gold reflects its higher beta, growing industrial demand base, and the historical pattern of ratio compression during precious metals recoveries
- Repeated failed attempts to push prices lower during the summer months strengthened the technical foundation for the subsequent recovery, suggesting base-building behaviour rather than a temporary bounce
- Three distinct macro scenarios — bull, base, and bear — each carry meaningfully different implications for gold and silver trajectories
- Position sizing discipline and scenario awareness remain essential given the asymmetric volatility profile of precious metals, particularly silver
This article is for informational purposes only and does not constitute financial advice. Precious metals markets are subject to significant volatility and investors should consider their individual risk tolerance and investment objectives before making any investment decisions. Past performance of any asset class, including gold and silver, is not indicative of future results.
Want to Know When the Next Major Precious Metals Discovery Hits the ASX?
Discovery Alert's proprietary Discovery IQ model delivers real-time alerts on significant ASX mineral discoveries — including gold and silver — instantly translating complex data into actionable opportunities for both traders and long-term investors. Explore historic discoveries and their remarkable returns, then start your 14-day free trial at Discovery Alert to position yourself ahead of the broader market.