August 13, 2026
When Five Unconnected Forces Pull in the Same Direction
Commodity markets are noisy by design. Prices shift daily in response to currency movements, speculative positioning, algorithmic trading, and sentiment cycles that have little to do with underlying fundamentals. Genuine, structurally supported rallies are far rarer than they appear, and identifying them in real time requires more than tracking a single headline catalyst. The more analytically meaningful question is not why prices moved today, but how many independent forces are pointing in the same direction simultaneously.
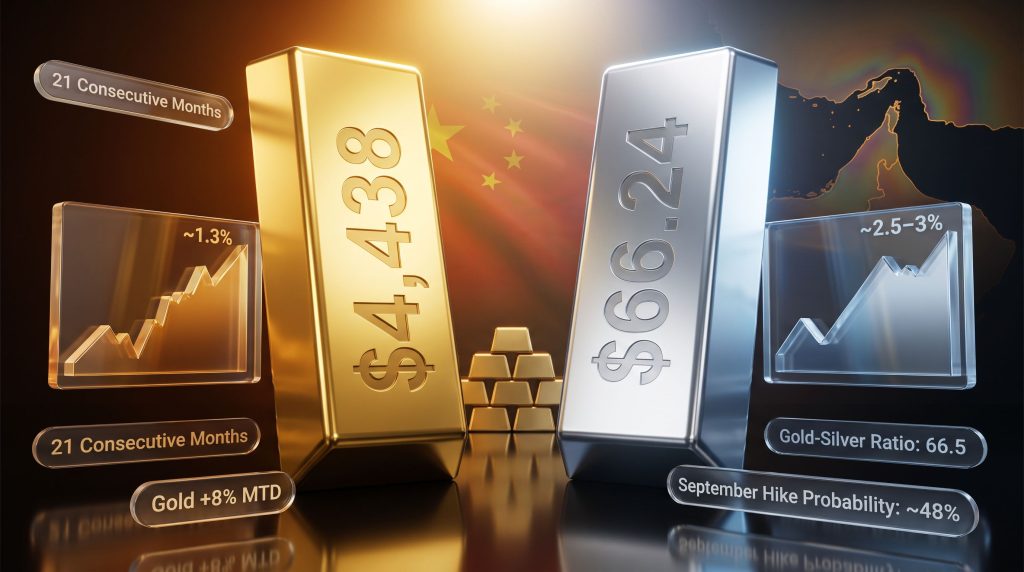
On August 12, 2026, that question produced an unusual answer. Gold climbed more than 1% to a session high above $4,438. Silver advanced nearly 3%, reaching approximately $66.24 and outpacing gold by a factor of nearly two. Both metals held near multi-week highs. What made the session analytically significant was not the magnitude of the move, but its architecture: five structurally independent demand and risk variables all aligned within a single trading session. Understanding each force individually, and what their convergence implies, is the focus of this analysis on the gold and silver rally five forces framework.
When monetary policy signals, sovereign reserve accumulation, technical momentum, industrial supply deficits, and geopolitical energy disruption all point in the same direction within a single session, the resulting price move carries a fundamentally different character than any single-catalyst spike. The gold and silver rally five forces framework dissects exactly that dynamic.
When big ASX news breaks, our subscribers know first
Force 1: The Real Yield Transmission and What the CPI Print Actually Did
Most market participants treat inflation data as a binary catalyst: hot prints hurt gold, cool prints help it. The reality is more nuanced, and August 12 illustrated why. The U.S. Bureau of Labor Statistics released July 2026 CPI data showing headline inflation at +0.1% month-over-month and +3.4% year-over-year. Core CPI registered +0.2% month-over-month and +2.5% year-over-year. All four readings matched consensus forecasts precisely.
The bullish implication came not from the numbers themselves, but from what they eliminated. An in-line print removed the most dangerous scenario for gold: a hot surprise that would have forced the Federal Reserve's hand on a September rate hike. With that risk off the table, the CME FedWatch tool showed September hike probability holding near 48%, well below the threshold that typically compresses gold's monetary premium.
The Step-by-Step Real Yield Mechanism
Understanding why this matters requires following the transmission chain. Furthermore, the relationship between gold and bond dynamics plays a crucial role in how rate expectations translate into precious metals pricing:
-
Inflation moderates without triggering a growth scare or labour market deterioration.
-
The Federal Reserve's urgency to tighten policy diminishes, reducing the probability of near-term rate increases.
-
Nominal yields face reduced upward pressure, meaning real yields (nominal yields minus inflation expectations) are less likely to rise sharply.
-
The opportunity cost of holding non-yielding assets such as physical gold and silver falls relative to interest-bearing alternatives.
-
Capital rotates toward precious metals as their relative value proposition improves.
For context, had July CPI surprised to the upside at +0.4% or above, September hike probability would likely have surged toward 70-75%, compressing gold's monetary premium and reversing the session's gains. Gold carried an asymmetric risk profile into the release, and the clean print resolved that asymmetry in the most constructive possible direction. Understanding gold and bond dynamics helps contextualise why this transmission mechanism is so pivotal.
Force 2: The People's Bank of China's Record Buying Streak
No single institutional buyer in the global gold market currently operates at the scale and consistency of China's central bank. In July 2026, the People's Bank of China added approximately 20 tonnes of gold to its reserves, extending what is now the longest uninterrupted sovereign buying streak on record: 21 consecutive months. Total Chinese gold holdings have surpassed 76 million ounces, and July's purchase was the largest single-month addition since October 2023, according to reporting by Caixin Global.
What makes this buying programme structurally significant is its price insensitivity. The PBOC initiated its streak in November 2024 and continued purchasing through gold's approximately 29% price drawdown from its January peak. This behaviour is categorically different from how retail investors or momentum-driven institutional funds operate. Central bank gold buying of this nature reflects multi-year, policy-level reserve diversification strategies rather than short-term sentiment responses.
| Metric | Data Point |
|---|---|
| Consecutive months of PBOC purchases | 21 months (record) |
| July 2026 addition | ~20 tonnes |
| Total Chinese gold reserves | 76+ million ounces |
| Gold as % of China's total reserves | Less than 10% |
| Largest prior single-month purchase | October 2023 |
The reserve composition gap is particularly instructive. Gold represents less than 10% of China's total reserve portfolio, compared to a global central bank average of approximately 15-20%. This structural undershoot implies Beijing has a significant and long-duration runway to continue accumulating before reaching benchmark-level allocations. Sovereign demand of this character functions as a structural price floor, absorbing speculative selling pressure that would otherwise produce sharper corrections.
A useful historical parallel is the post-2008 period, when coordinated central bank accumulation across emerging market economies provided a demand foundation that underpinned gold's extended rally from approximately $900 to nearly $1,900 between 2009 and 2011. The current PBOC programme exhibits similar characteristics: patient, policy-driven, and indifferent to short-term price volatility.
Force 3: Technical Overbought Signals and Why Context Changes Their Meaning
Gold has gained approximately 8% in August 2026 alone, and the prior week registered its strongest weekly advance since January. According to data from Bespoke Investment Group, gold recently crossed back above its 50-day moving average and entered technically overbought territory for the first time since March 10, 2026.
In classical technical analysis, an overbought reading (typically defined as an RSI above 70, or price extended significantly beyond recent moving averages) signals that buying momentum has run ahead of sustainable levels, raising the probability of a mean-reversion pullback. This interpretation is not wrong, but it is incomplete when applied without accounting for the structural demand environment.
When Overbought Means Something Different
Technical indicators measure momentum relative to recent price history. They do not account for a sovereign entity committed to reserve-building regardless of price levels, or for investors systematically repositioning as rate-hike fears recede. January 2026 provided a live case study: gold entered overbought territory and then surged from approximately $4,300 to an all-time high near $5,589 rather than pulling back. Analysts tracking what drives gold prices have consistently noted this divergence between technical signals and structural fundamentals.
| Market Context | Overbought Signal Outcome | Historical Example |
|---|---|---|
| Structural bull market with active sovereign demand | Continuation rally | January 2026 gold breakout |
| Speculative bubble without fundamental support | Mean reversion and correction | Various commodity cycle peaks |
| Rate-hike cycle peak with hawkish Fed | Sustained reversal | 2022 gold decline |
The practical implication differs by investor type. Short-term traders are justified in tightening stop-loss management and reducing leverage when overbought signals appear. Long-term structural investors, however, operating in the context of record sovereign accumulation and falling rate-hike odds, face a signal environment where historical precedent points toward continuation rather than reversal.
Force 4: Silver's Dual-Engine Demand Architecture and a Six-Year Supply Deficit
Silver's approximately 2.5-3% gain on August 12, reaching around $66.24, nearly doubled gold's 1.3% advance. This outperformance compressed the gold-silver ratio toward 66.5, and understanding why silver moved faster requires understanding an aspect of its market structure that distinguishes it fundamentally from gold. A closer look at gold-silver ratio analysis reveals how this compression signals deeper structural shifts within the precious metals complex.
Silver operates on two independent demand frequencies simultaneously:
-
Monetary demand: Silver responds to the same real yield and Federal Reserve policy signals as gold. When rate-hike probability falls, silver's monetary premium expands in parallel with gold's.
-
Industrial demand: Solar photovoltaic manufacturing is one of the fastest-growing industrial consumers of silver globally, and AI data centre infrastructure represents an accelerating new demand category. A soft-landing inflation outcome signals continued industrial expansion, activating this engine at the same moment the monetary engine fires.
On August 12, both engines activated simultaneously. The soft CPI print lifted silver as a monetary asset while simultaneously reinforcing the soft-landing narrative that supports industrial production. This dual activation is the specific mechanism that produces silver's characteristic tendency to outperform gold during certain market phases.
The Supply Deficit Structural Backdrop
This dual demand dynamic is playing out against a supply backdrop that amplifies every positive price signal. The Silver Institute projects a sixth consecutive annual supply deficit for 2026, with demand estimated at approximately 1.10 billion ounces against constrained mine supply. No major new production capacity is expected to come online at scale before 2028, meaning structural tightness will persist regardless of short-term demand fluctuations. The persistence of silver supply deficits has become one of the most consequential structural factors underpinning the current rally.
A lesser-known dynamic in silver mining is that approximately 70-80% of global silver production is extracted as a byproduct of copper, lead, and zinc mining rather than from dedicated silver mines. This means silver supply cannot be meaningfully increased by simply raising silver prices. Production decisions are driven by the economics of base metals, creating a supply inelasticity that is structurally different from gold and not widely appreciated by generalist investors.
This byproduct dependency means supply shortfalls tend to be persistent and slow to resolve, reinforcing the structural tightness that the Silver Institute's deficit projections reflect.
The gold-silver ratio, currently at 66.5, functions as a real-time relative value indicator. When the ratio compresses (silver outperforming gold), it historically signals a risk-on tilt within the precious metals complex and often precedes broader participation from retail and institutional investors who rotate from gold into silver seeking higher beta exposure to the same underlying monetary trends. Investopedia's historical guide to the gold-silver ratio provides useful context for interpreting what current compression levels have meant in prior cycles.
Force 5: The Hormuz Premium and a Shifting Oil-Gold Transmission Mechanism
The fifth force driving the gold and silver rally five forces dynamic on August 12 involves the most complex transmission mechanism of the group. US-Iran hostilities commenced on February 28, 2026, and the Strait of Hormuz has remained effectively closed since that date. Brent crude was trading near $89.50 per barrel, approximately 24% above pre-conflict levels. Pakistan's defence minister indicated publicly that Washington and Tehran were approaching a potential diplomatic arrangement, introducing a de-escalation variable into an otherwise elevated geopolitical environment. The oil price geopolitical impact on precious metals has consequently become one of the more closely watched variables in the current cycle.
How the Oil-Gold Relationship Has Fundamentally Changed
Earlier in the conflict, between February and April 2026, the relationship between oil prices and gold was inverse. Every oil spike raised inflation expectations, which raised Federal Reserve rate-hike odds, which compressed gold's monetary premium. Crude strength was a headwind, not a tailwind, for precious metals.
That transmission mechanism has materially weakened. Gold held near its 10-week high even as Brent remained elevated, suggesting that physical wealth-preservation demand has partially decoupled from the oil-inflation-Fed policy channel. The geopolitical bid in precious metals is no longer behaving like a temporary spike premium. It is functioning as a structural support level. Furthermore, the oil price geopolitical impact on broader macro conditions continues to inform how investors position across both energy and safe-haven assets.
| Scenario | Brent Crude Impact | Gold Impact |
|---|---|---|
| Full Hormuz reopening and US-Iran deal | Sharp decline toward $70-75 | Short-term pullback; structural floor remains |
| Partial reopening with ongoing tensions | Moderate decline to $80-85 | Minimal gold impact; floor holds |
| Continued closure with escalation | Brent above $95 | Gold premium expands; new safe-haven inflows |
| Status quo maintained | Brent holds $88-92 | Gold holds near multi-week highs |
Source: Al Jazeera, August 12, 2026; NAI500, August 12, 2026.
The next major ASX story will hit our subscribers first
What Multi-Force Convergence Means for Investors
The analytical significance of August 12 lies not in any individual catalyst, but in the statistical rarity of five structurally independent forces aligning within a single session. These five drivers have no causal relationship with each other. CPI data did not cause China to buy gold. The Strait of Hormuz closure did not cause silver's supply deficit. Technical momentum did not cause the Federal Reserve's rate path to shift. Their simultaneous convergence is not a coincidence of narrative, but a genuine multi-force alignment that historically produces sustained directional moves rather than one-session spikes.
Historical precedents support this interpretation. In 2010-2011, sovereign buying, quantitative easing, and geopolitical instability converged to push gold from approximately $1,100 to nearly $1,900. In 2019-2020, rate cuts, COVID-driven uncertainty, and dollar weakness combined to push gold above $2,000 for the first time. In both cases, the convergence of independent forces marked the beginning of sustained trends rather than their conclusion.
Key Variables to Monitor in Coming Sessions
-
September Fed hike probability: Any sustained move above 60% represents the primary structural headwind for both metals.
-
PBOC August reserve data: Released in early September, this will confirm whether China's buying streak extends to 22 consecutive months or shows any moderation.
-
Strait of Hormuz diplomatic developments: A genuine reopening agreement could temporarily compress the geopolitical floor, though structural monetary support would remain.
-
Silver Institute mid-year supply data: Any widening of the projected 2026 deficit would amplify silver's structural case further.
-
Gold-silver ratio direction: Compression below 65 would signal accelerating silver outperformance and increasing risk-on momentum within the precious metals complex.
August 12, 2026: Full Market Snapshot
| Metric | Value |
|---|---|
| Gold session high | Above $4,438 |
| Gold August MTD gain | Approximately 8% |
| Silver price | Approximately $66.24 |
| Silver daily gain | Approximately 2.5-3% |
| Gold daily gain | Approximately 1.3% |
| Gold-silver ratio | Approximately 66.5 |
| July CPI headline MoM | +0.1% |
| July CPI headline YoY | +3.4% |
| July CPI core MoM | +0.2% |
| July CPI core YoY | +2.5% |
| September Fed hike probability | Approximately 48% |
| PBOC consecutive buying months | 21 (record streak) |
| PBOC July 2026 purchase | Approximately 20 tonnes |
| China total gold reserves | 76+ million ounces |
| Gold as share of China's reserves | Less than 10% |
| Silver projected 2026 demand | Approximately 1.10 billion ounces |
| Silver consecutive annual deficits | 6th consecutive year projected |
| Brent crude price | Approximately $89.50 per barrel |
| Brent above pre-conflict level | Approximately 24% |
Sources: U.S. Bureau of Labor Statistics, August 12, 2026; Caixin Global, August 9, 2026; Bespoke Investment Group via TradingView; Silver Institute World Silver Survey 2026; Al Jazeera, August 12, 2026; NAI500, August 12, 2026.
Frequently Asked Questions
Why is silver rising faster than gold right now?
Silver carries two independent demand engines: monetary demand, which responds to the same real yield and Federal Reserve signals as gold, and industrial demand, driven by solar manufacturing and AI infrastructure build-out. When the July CPI print reduced rate-hike odds and reinforced a soft-landing signal, both engines activated simultaneously. Gold responds to only the monetary engine, which is why silver's gain nearly doubled gold's on August 12.
Does a technically overbought gold signal mean prices will fall?
Not necessarily in a structural bull market context. Technical overbought readings measure momentum against recent price history, not against structural demand conditions. When sovereign buyers are accumulating regardless of price and real yield dynamics favour non-yielding assets, overbought signals have historically preceded continuation rallies rather than reversals, as demonstrated by gold's January 2026 surge from approximately $4,300 to a record near $5,589.
How does China's central bank buying create a price floor for gold?
Central bank purchases are policy-driven, price-insensitive, and operate on multi-year or multi-decade horizons. The PBOC continued buying through a nearly 29% price drawdown, demonstrating that accumulation decisions are independent of market sentiment. This creates a consistent absorption mechanism for speculative selling pressure. With gold still below 10% of China's total reserve portfolio versus a global central bank average of 15-20%, the structural buying runway remains substantial.
What happens to gold if the Strait of Hormuz reopens?
A genuine reopening agreement would likely produce a short-term pullback as the geopolitical premium partially unwinds. However, the structural support from real yield dynamics and active sovereign accumulation would remain intact, limiting the magnitude of any downside move. The oil-gold inverse transmission mechanism that characterised the early conflict period has materially weakened, suggesting gold's floor is now less dependent on the Hormuz situation than it was six months ago.
Why does silver have a structural supply deficit and what does it mean for prices?
Approximately 70-80% of global silver is produced as a byproduct of copper, lead, and zinc mining rather than from dedicated silver operations. This means silver supply cannot be meaningfully increased simply by raising silver prices, as production decisions are driven by base metal economics. Combined with surging industrial demand from solar and technology sectors, this supply inelasticity has produced six consecutive projected annual deficits. In structurally tight markets, even modest positive demand signals produce amplified price responses.
This analysis is intended for educational and informational purposes only. It does not constitute financial or investment advice. Precious metals investing involves risk, including the potential loss of principal. Past performance is not indicative of future results. Readers should consult a qualified financial adviser before making any investment decisions.
Want to Catch the Next Major ASX Mineral Discovery Before the Market Moves?
Discovery Alert's proprietary Discovery IQ model delivers real-time alerts the moment significant ASX mineral discoveries are announced, turning complex data across 30+ commodities into clear, actionable insights for both traders and long-term investors — start your 14-day free trial today and explore how historic discoveries have generated exceptional returns.