
July 11, 2026
The Structural Case for a Precious Metals Inflection Point
Investor psychology around commodities follows a predictable rhythm. Sentiment deteriorates through corrections, patience erodes, and conviction fades precisely at the moment markets are quietly building the foundation for the next significant advance. This dynamic is not unique to any single cycle. It has repeated across every major precious metals bull market in modern financial history, and the gold and silver multimonth rally outlook unfolding in mid-2026 carries unmistakable similarities to prior inflection points that preceded some of the most powerful rallies on record.
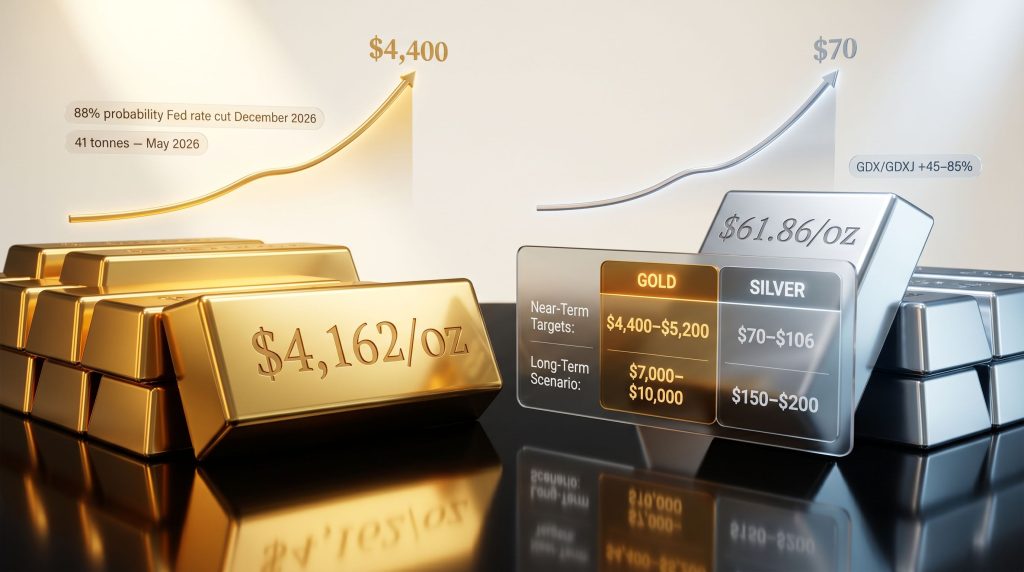
With gold trading near $4,162 per ounce and silver near $61.86 per ounce as of July 2026, three independent analytical frameworks, encompassing technical structure, sentiment readings, and monetary policy positioning, are converging on a consistent conclusion. A sustained multimonth advance in precious metals is forming, regardless of whether the definitive price low has already been established.
When big ASX news breaks, our subscribers know first
How the Current Correction Maps Against Three Decades of Gold Market History
Understanding where gold stands today requires stepping back to examine the full arc of its historical breakout cycles. In its modern trading history, gold has experienced only three major structural breakouts, each followed by a finite but meaningful corrective phase before resuming its primary trend higher.
Across all significant post-breakout corrections, a consistent pattern emerges: declines have ranged between 22% and 30% and have lasted approximately five to seven months. The current 2026 correction fits squarely within this historical envelope, distinguishing it structurally from the types of corrections that have historically marked secular peaks rather than midcycle consolidations.
Two historical analogs provide the most instructive comparison:
| Correction Period | Depth | Duration | Recovery Type |
|---|---|---|---|
| Early 1970s Post-Breakout | ~25–28% | ~6 months | Gradual multi-year advance |
| 2006 Mid-Cycle Correction | ~22% | ~5 months | Measured, progressive recovery |
| Current 2026 Correction | ~22–30% | Ongoing | Two-scenario path |
The 2006 analog is considered the more probable recovery template. Rather than a sharp vertical reversal characteristic of the 1973 pattern, the 2006 episode produced a measured, steady rebound that ultimately fed into the next leg of a multi-year bull market. The 1973 V-shaped recovery template remains a lower-probability outcome given current liquidity conditions and market structure.
Crucially, the current correction shares none of the characteristics that have historically preceded secular peaks in gold. Prior cycle peaks were preceded by multi-year capital rotation periods from equities into gold, often spanning four to ten years. The current cycle has seen only approximately two years of meaningful rotation, a structural consideration with significant implications for how much upside remains. Furthermore, the gold-stock market relationship at this juncture strongly supports the case that this cycle has considerably more room to run.
Two Distinct Price Path Scenarios for Gold Through Late 2026
Scenario A: The Low Is Already Established
The weekly gold chart has printed three consecutive bullish hammer candles, a classically constructive reversal signal that historically indicates exhaustion of selling pressure. Under this scenario, price works progressively higher toward the $4,400 per ounce resistance zone, which represents the primary technical ceiling regardless of the path taken to reach it.
For silver, the equivalent near-term resistance target under this scenario sits at approximately $70 per ounce.
Scenario B: A False Floor, Final Flush, and More Powerful Launch
The current tentative rebound fails and reverses, driving gold toward a lower low in the $3,700 to $3,800 per ounce range. The 50% Fibonacci retracement of the prior advance sits near $3,720, a level that has historically acted as a reliable support magnet during corrective phases.
A potential trigger for this scenario could be an unexpected Federal Reserve policy signal, such as a rate hike indication that forces a final capitulation. Counterintuitively, such a policy surprise at this stage of the cycle could establish the definitive cycle low, setting up a more powerful subsequent advance from the $3,720 area toward $4,400 and beyond.
Both scenarios converge on the same medium-term destination. The divergence is one of timing and entry point, not directional outcome. Investors focused on the two to five month horizon are positioned to benefit under either path.
What Sentiment Indicators Are Revealing at This Cycle Turn
Why Sentiment Leads Price at Major Inflection Points
At significant cycle turns in gold markets, sentiment data has historically led price action by one to three months. This leading characteristic means that current extreme sentiment readings may be signalling a bottom even before the final price low is confirmed. Multiple independent sentiment frameworks are currently aligned at historically rare levels, consistent with prior significant multi-month lows in gold.
Broad sentiment composite readings have reached levels that have preceded mining equity rebounds of 45% to 85% in prior cycles, as measured by indices tracking senior and junior gold miners. For additional context on how this dynamic has played out across precious metals historically, this analysis of the gold and silver rally signals provides valuable supporting evidence.
The GLD Optics 50-Day Moving Average Signal
One particularly notable sentiment framework involves a smoothed sentiment indicator for the GLD gold ETF, using a 50-day moving average to filter noise. When this indicator reaches its current extreme reading, historical outcomes have been consistently bullish across multiple time periods:
| Signal Occurrence | Market Context | Outcome |
|---|---|---|
| ~1 month before 2008 low | Post-crash environment | Sustained rebound despite broader market stress |
| ~2 months before 2016 low | Mid-cycle correction | Significant rally followed |
| At the 2016 low | Confirmed bottom | Strong precious metals recovery |
| Late 2016 | Post-election sell-off | GDXJ rebounded approximately 50% |
| At the 2018 low | Key cycle inflection | Gold subsequently advanced approximately 80–85% |
| ~2 months before 2022 low | Pre-confirmation signal | Advance warning of recovery |
| At the 2022 low | Confirmed cycle bottom | Meaningful multi-month rally followed |
An important caveat applies here: this sentiment signal has historically arrived one to two months before the definitive price low in several instances. Investors should treat current readings as a powerful directional signal while remaining alert to the possibility that the final low may still be forming.
The Federal Reserve's Role and the Monetary Policy Catalyst
Markets are currently pricing an 88% probability of a Federal Reserve rate cut in December 2026, driven by subdued economic data and increasingly dovish central bank communication. Rate reductions lower the opportunity cost of holding non-yielding bullion, a dynamic that has historically provided a powerful tailwind for both gold and silver. In addition, central bank gold demand continues to underpin the structural bull case for the metal regardless of short-term policy fluctuations.
Only a 13.3% probability is currently assigned to a January 2027 cut, making the December window the primary anticipated policy pivot point for precious metals traders positioning for the next leg higher.
Structural demand from emerging market central banks provides an additional and often underappreciated support mechanism. Central bank institutions purchased 41 tonnes of gold in May 2026 alone, maintaining the institutional demand base that has underpinned prices throughout this cycle and limiting downside risk during corrective phases.
Key risk factors investors should monitor include:
- Dollar strength: A resilient US dollar can cap near-term upside momentum for gold priced in dollars
- Sticky inflation: Re-acceleration of inflation could delay rate cuts and reduce a primary bullish catalyst
- Stronger economic data: Positive economic surprises could push rate cut expectations further out
- Elevated volatility: Gold volatility is up 46% year-to-date while silver volatility has surged 106% year-to-date, signalling powerful but unstable market conditions prone to sharp reversals in both directions
The Macro Architecture for $6,000 to $10,000 Gold and $100 to $200 Silver
Capital Rotation as the Engine of Precious Metals Bull Markets
The most powerful phases of gold and silver bull markets are not driven by precious metals fundamentals in isolation. They are powered by large-scale capital rotation out of equities and into hard assets, typically coinciding with severe equity bear markets where the S&P 500 experiences sustained declines of 30% to 50% or more.
Historical precedent makes this relationship clear. During the 1974 to 1980 cycle, gold outperformed the S&P 500 by approximately eight times over four years before the major secular peak. This was preceded by an extraordinary period of capital rotation from equities into gold spanning the early part of that decade. A similar but less extreme rotation occurred during the 2001 to 2003 equity bear market, when gold rose consistently even as broader equities fell.
The current cycle has seen only approximately two years of meaningful gold-to-equity outperformance, a fraction of the rotation periods that have historically preceded secular peaks. This structural observation supports the argument that the current bull market has significant runway remaining. Considering gold as a gold safe-haven investment further reinforces why capital rotation into the metal tends to accelerate when equity markets enter prolonged downturns.
The Secular Equity Transition and What It Means for Precious Metals
The S&P 500 is approaching what technical analysts characterise as the end of its current secular bull market cycle. The transition to a new secular equity bear market, whenever it arrives, is expected to replicate the structural dynamics of 2001 to 2003 rather than 2008, when equities and gold fell simultaneously before recovering together.
The expected pattern involves equities declining into a prolonged secular bear phase while gold and silver rise as capital actively seeks refuge. This distinction matters enormously for positioning, because the 2008 template produced only a temporary disruption to gold's bull market, whereas the 2001 to 2003 template produced a sustained multi-year advance in precious metals concurrent with equity weakness.
Long-term price targets under this macro scenario:
| Asset | Near-Term Target (2026) | Medium-Term Target (2027) | Long-Term Scenario (2028+) |
|---|---|---|---|
| Gold | $4,400–$5,200/oz | $6,000/oz | $7,000–$10,000/oz |
| Silver | $70–$106/oz | $100–$120/oz | $150–$200/oz |
These long-term targets are not base-case forecasts for near-term positioning. They represent scenario-dependent outcomes contingent on the onset of a new equity secular bear market and the associated large-scale capital rotation into precious metals. Investors should apply appropriate risk management frameworks when evaluating extended price projections.
The next major ASX story will hit our subscribers first
Mining Equities: GDX and GDXJ Positioned for a Significant Rebound
Historical Correction and Rebound Framework for Mining Indices
Gold and silver mining equities have historically experienced corrections of 40% to 50% during mid-cycle consolidations, followed by rebounds of 45% to 85%. Two precedents are particularly instructive for current positioning:
| Index | Correction Period | Decline | Subsequent Rebound |
|---|---|---|---|
| GDXJ | 2022 | ~50% | Substantial recovery to cycle highs |
| GDX | Late 2016 | ~35–40% (to ~$18–19 range) | ~45% rebound |
Current miner positioning mirrors these prior setups. Either the rebound has already commenced, or a brief additional decline will establish the final low before a powerful recovery phase begins. The directional setup is considered favourable under both timing outcomes.
Why Stock Selection Matters More Than Index Exposure in This Environment
Broad miner ETFs provide diversified exposure but include lower-quality operators that dilute overall portfolio returns. A curated approach focused on high-quality producers and developers has historically delivered superior risk-adjusted outcomes compared to passive index exposure.
Key selection criteria for identifying outperformers include:
- Quality assets with demonstrated resource growth potential and strong geological fundamentals
- Management teams with proven capital allocation discipline and track records of value delivery
- Balance sheet strength sufficient to withstand commodity price volatility
- Companies capable of delivering 3x to 5x returns at current metal prices without requiring extreme gold or silver price assumptions
- Leverage to higher metal prices as an amplifier of returns, not a prerequisite for business viability
This approach reflects a core principle of mining equity investment: the highest-quality companies generate strong returns at current margins, and those returns become exponentially larger when metal prices rise materially. The risk-reward asymmetry favours quality selection over broad index exposure at this stage of the cycle.
Silver's Independent Investment Case
Dual Demand Dynamics and the Multiplier Effect
Silver operates simultaneously as a monetary hedge, tracking gold's macro narrative, and as an industrial commodity driven by demand from solar panel manufacturing, electric vehicle battery systems, and grid infrastructure build-out. This dual demand structure historically creates a multiplier effect relative to gold during precious metals bull phases, amplifying both gains and corrections. However, the broader gold-silver ratio analysis suggests that silver remains historically undervalued relative to gold, reinforcing the case for amplified upside in the next sustained advance.
Supply-side constraints further reinforce the fundamental case. High mining costs and a scarcity of high-quality, development-ready silver projects are creating structural silver supply deficits, while industrial demand from the energy transition continues to tighten the supply-demand balance. For additional perspective on current market dynamics, BlackRock's analysis of gold and silver price volatility highlights how institutional investors are navigating these conditions.
Silver's current technical setup presents both opportunity and caution:
- Current price: approximately $61.86 per ounce (July 2026)
- Near-term resistance: $70 per ounce
- Medium-term analyst target range: $100 to $106 per ounce
- Long-term scenario target: $150 to $200 per ounce under full macro rotation conditions
- Near-term risk: Silver is considered technically overbought in the short term, elevating correction risk before the next significant leg higher
Silver's volatility surge of 106% year-to-date versus gold's 46% year-to-date increase illustrates the metal's characteristic behaviour as a leveraged expression of the gold trade, amplifying moves in both directions and demanding disciplined position sizing from investors.
Frequently Asked Questions: Gold and Silver Multimonth Rally Outlook
Has gold already bottomed, or is a lower low still possible?
Three consecutive weekly bullish hammer candles on the gold chart suggest a potential bottom may be in place. However, a secondary low in the $3,700 to $3,800 range remains a credible scenario, particularly if a Federal Reserve policy surprise triggers a final capitulation move.
What is the most significant resistance level for gold in the near term?
$4,400 per ounce is the primary technical resistance zone identified across multiple analytical frameworks. A sustained break above this level would signal the commencement of the next phase of the bull market advance.
Why might silver outperform gold in the next rally phase?
Silver's dual industrial and monetary demand profile, combined with structural supply constraints and historically low relative valuations versus gold, creates the conditions for amplified gains during precious metals bull phases.
What macro conditions would most accelerate the advance?
A confirmed Federal Reserve rate cut cycle, a weakening US dollar, and the onset of a new equity secular bear market driving capital rotation into hard assets represent the most powerful combination of accelerating catalysts.
What are the primary risks to the bullish outlook?
Dollar strength, delayed rate cuts due to economic resilience or persistent inflation, and near-term overbought technical conditions in silver represent the most significant risk factors to monitor.
Structuring a View on Precious Metals Through 2028
The gold and silver multimonth rally outlook for 2026 and beyond is not contingent on any single catalyst delivering in isolation. It is supported by the convergence of technical structure, historically extreme sentiment readings, monetary policy pivoting dynamics, and long-cycle capital rotation forces that are only in the early stages of their full expression.
- Near-term (0 to 3 months): Either the definitive low is already established or a final flush toward $3,700 to $3,800 creates the launching pad. Both paths lead to the same destination.
- Medium-term (3 to 12 months): A gold and silver multimonth rally targeting $4,400 to $5,200 for gold and $70 to $106 for silver represents the base case, supported by rate cuts, central bank demand, and sentiment reversals.
- Long-term (1 to 3 years): The onset of a new equity secular bear market drives the most consequential phase of capital rotation, with extended targets of $6,000 to $10,000 for gold and $150 to $200 for silver under full rotation conditions.
The primary variable in the precious metals outlook is timing, not direction. Investors who understand this distinction are better positioned to maintain conviction through near-term volatility and capture the full scope of what technical, sentiment, and macro analysis collectively suggest is a developing major advance consistent with the gold and silver multimonth rally outlook presented here.
This article is intended for informational and educational purposes only and does not constitute financial advice. All price targets, scenarios, and forecasts involve uncertainty and should not be relied upon as guarantees of future performance. Investors should conduct independent research and consult qualified financial advisers before making investment decisions. Past market patterns do not guarantee future outcomes.
Want to Catch the Next Major Precious Metals Discovery Before the Market Does?
Discovery Alert's proprietary Discovery IQ model delivers real-time alerts on significant ASX mineral discoveries, instantly transforming complex geological data into actionable insights for both short-term traders and long-term investors — explore Discovery Alert's discoveries page to understand how historic finds have generated extraordinary returns, and begin your 14-day free trial today to position yourself ahead of the next major move in precious metals equities.