August 21, 2026
The Pressure System Beneath the Rally: When the Dollar Becomes the Story
Most investors instinctively scan economic headlines when gold and silver move sharply. They look for inflation prints, Fed commentary, geopolitical events. What happened during the week of August 21, 2026 challenged that reflex entirely. Both metals climbed through strong growth data, advanced while equities fell, and gained ground as the dollar softened simultaneously. None of that fits the conventional template. To understand why the gold and silver rally on a weak dollar unfolded the way it did, you have to look not at the economy, but at the plumbing underneath it.
When big ASX news breaks, our subscribers know first
The Mechanical Relationship Between Dollar Weakness and Metal Prices
Gold and silver are globally priced and traded in U.S. dollars. This creates a direct mechanical relationship that operates independently of sentiment. When the dollar loses purchasing power, the same quantity of metal requires more dollars to purchase. For international buyers transacting in euros, yen, or yuan, a weaker dollar effectively lowers the entry price in their local currency, stimulating demand from outside the United States and pushing dollar-denominated spot prices upward.
Furthermore, this is not a narrative. It is arithmetic. The repricing is structural, and it operates regardless of whether economic conditions are improving or deteriorating. Understanding gold safe-haven dynamics helps clarify why this mechanical relationship persists even through periods of strong economic data.
Key Price Movements: Week of August 21, 2026
| Metric | Level | Movement |
|---|---|---|
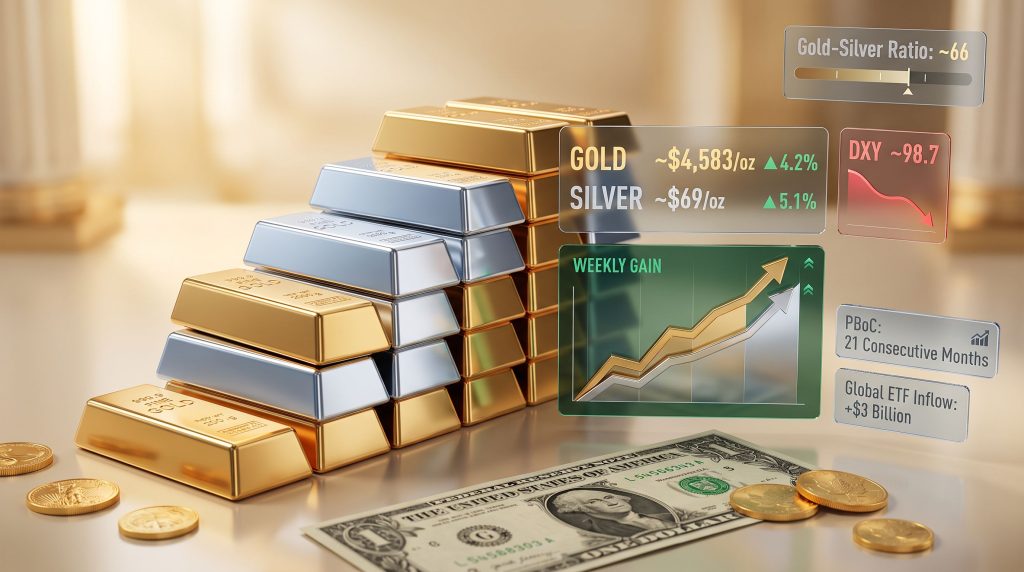
| Gold spot price | ~$4,583 per ounce | +1.4% daily / +4.2% weekly |
| Silver spot price | ~$69 per ounce | +1.3% daily / +5.1% weekly |
| Gold-silver ratio | ~66 | Declining (silver outperforming) |
| U.S. Dollar Index | ~98.7 | Drifting lower |
| 30-year Treasury yield | ~5.25% | Near 19-year highs |
| 10-year Treasury yield | ~4.70% | Elevated after brief decline |
Both metals were tracking a third consecutive weekly gain in spot terms. What made the move diagnostically unusual was the data it climbed through. S&P Global's flash survey, released the same morning, placed the services activity index at 56.8, its strongest reading since December 2024, while the composite output index reached 56.0, its highest since April 2022. Growth data of that strength would ordinarily suppress precious metals by reinforcing rate-hold expectations and supporting the dollar. Instead, both metals advanced.
"The gold and silver rally on a weak dollar is not purely a sentiment story. It is a mechanical repricing of assets denominated in a depreciating unit of account, and the August 2026 episode demonstrated that this mechanism can override even bullish economic data when currency credibility is the primary variable under pressure."
Why the Treasury's Yield-Control Attempt Backfired
The clearest single catalyst for the week's dollar weakness originated in Washington. On Wednesday of that week, the U.S. Treasury announced a substantial expansion of its bond liquidity-support buyback program. Operations targeting 10- to 30-year Treasury securities were scheduled to increase from $2 billion to at least $4 billion per operation, effective September 9, 2026, according to the U.S. Department of the Treasury's published buyback schedule.
The initial market reaction was textbook. Bond yields declined sharply and the dollar retreated. For a period of roughly 24 hours, the intervention appeared to be working. However, as Bloomberg reported, gold's ascent during periods of dollar weakness has become increasingly difficult to contain through conventional fiscal mechanisms.
It did not hold. By Thursday's close, the 30-year Treasury yield had climbed back to approximately 5.25%, after briefly touching 5.31% earlier in the week, a level not seen in approximately 19 years. The 10-year yield returned to around 4.70%, fully erasing the post-announcement decline. Treasury Secretary Bessent signalled the possibility of further buyback increases. Yields remained near their highs regardless.
The Pressure Redirection Effect
The failure of yield-suppression mechanisms carries a specific implication for precious metals markets. Think of the bond market, the dollar, and gold as a closed pressure system. When fiscal tools cannot anchor long-term yields, the energy released does not dissipate. It redirects.
In this case, it redirected into the dollar. And from the dollar, it moved into hard assets. This is the core transmission mechanism behind the gold and silver rally on a weak dollar when conventional monetary levers stop functioning as intended.
The FIMA Facility, Japan, and the Unintended Consequence of Dollar Defense
Simultaneously with the Treasury buyback episode, a second mechanism was operating at the currency level. Since late July 2026, the United States and Japan had been running a coordinated defence of the yen, according to reporting from OMFIF (August 2026). Treasury Secretary Bessent also encouraged the Federal Reserve to raise the limits on its FIMA (Foreign and International Monetary Authorities) Repo Facility.
The FIMA Repo Facility allows foreign central banks and monetary authorities to borrow U.S. dollars by pledging their Treasury holdings as collateral, rather than liquidating those bonds on the open market. The strategic logic is straightforward:
- Japan accesses dollars without selling Treasuries
- U.S. yields are protected from a forced-selling shock
- The yen is supported without Japan needing to directly intervene in currency markets
Nikkei Asia reported on August 18, 2026, that Japan had established a dollar-funding mechanism through this facility. On the surface, this appears to be a stabilising arrangement. In practice, MUFG warned that the combination of expanded buybacks and FIMA facility enlargement may produce the opposite of its intended effect. When foreign holders observe that U.S. assets require active support architecture to remain attractive, the rational response over time is to reduce exposure to those assets and to the currency in which they are denominated.
"The machinery designed to protect the bond market may paradoxically be teaching foreign institutional holders to want less of it. This is the type of slow-moving confidence erosion that does not appear in any single data release, but gradually shifts the demand architecture for dollar-denominated assets."
When Stocks and the Dollar Fall Together: A Diagnostic Signal
Market convention holds that equity sell-offs produce dollar strength. When risk assets decline, frightened capital rotates into the world's reserve currency, driving the dollar higher. This relationship is one of the most reliable correlations in modern financial markets during periods of normal stress.
It broke down during the week of August 21, 2026.
The S&P 500 and Nasdaq were set to snap a three-week winning streak. The Dow Jones Industrial Average was tracking toward its steepest weekly decline since mid-March, even accounting for a partial bounce on Friday. The dollar index simultaneously drifted toward 98.7, declining rather than firming.
Both gold and silver climbed through the combined weakness.
This combination is rare and meaningful. It indicates that investors were not simply rotating between risk-on and risk-off assets within the dollar system. Instead, a portion of capital appeared to be stepping back from the dollar itself as a unit of account. Physical metals are structurally suited to this environment because they exist entirely outside the dollar-denominated financial system while remaining globally liquid.
The Real Yield Mechanism: Why Bond Yields Drive Metal Prices
Gold and silver generate no income. This characteristic, often cited as a disadvantage, becomes an analytical tool when you understand the opportunity cost framework.
The returns available on Treasury securities represent the primary competition for capital that might otherwise flow into precious metals. When real yields, which account for inflation, compress or decline, the relative attraction of holding non-yielding metals increases because the cost of foregoing bond income shrinks.
The transmission chain works as follows:
- Nominal Treasury yields decline or fail to rise despite persistent inflation
- Real yields compress as the inflation-adjusted return on bonds narrows
- The opportunity cost of holding gold and silver falls accordingly
- Institutional and retail investors reallocate toward metals
- Increased demand supports higher spot prices
The August 2026 episode added a wrinkle to this framework. Even as long-term nominal yields remained elevated near multi-decade highs, the failure of yield-control efforts signalled to markets that fiscal authorities were losing the ability to manage the long end of the curve. That loss of control is itself a form of real yield uncertainty that precious metals markets historically price as a positive catalyst.
The next major ASX story will hit our subscribers first
Who Was Actually Buying Gold During This Rally?
Understanding the demand architecture behind the August 2026 precious metals rally requires separating the different buyer categories operating simultaneously.
Global ETF Flow Data: July 2026
According to World Gold Council data for July 2026:
| Region | ETF Flow | Notable Detail |
|---|---|---|
| Global total | +$3 billion | Reversed two consecutive months of outflows |
| Europe | +$2 billion | Led by UK and Switzerland |
| North America | +$71 million | Only region still in net outflow year-to-date |
| Global holdings | 4,068 tonnes | Below the 4,176-tonne record set February 27, 2026 |
The regional breakdown reveals something important. European institutional investors led the re-engagement, contributing the overwhelming majority of global ETF inflows. North American investors, despite the rally, had barely begun to rebuild positions. This asymmetry suggests that Western institutional demand was still in its early recovery phase as of late August 2026, meaning a significant pool of potential buying power had not yet been deployed.
Central Bank Accumulation: The Demand Floor
Beneath the ETF flow data sits a more durable demand structure. The central bank gold demand from the People's Bank of China extended its gold purchasing programme to 21 consecutive months through July 2026, according to World Gold Council data. Official-sector buyers globally continued accumulating through the spring price correction, establishing a demand floor that does not fluctuate with Western investor sentiment.
This creates a layered demand structure with important characteristics for long-term investors:
- Central bank buying provides a structural price floor independent of ETF or retail flows
- Western institutional re-engagement represents incremental demand on top of this floor
- Retail investor participation, typically the last to arrive in precious metals bull phases, had not yet materialised at scale as of August 2026
"The demand architecture for gold has undergone a structural shift. Official-sector buyers, particularly from Asia, are no longer marginal participants. They are the baseline. Western ETF inflows arriving late into an already-elevated demand environment represent potential amplification, not the primary driver."
In addition, central bank gold reserves data reinforces that this accumulation trend is not isolated to China but reflects a broad diversification away from dollar-denominated holdings across multiple sovereign institutions.
The Gold-Silver Ratio as a Market Intelligence Tool
The gold-silver ratio, which measures how many ounces of silver are required to buy one ounce of gold, held near 66 during the August 2026 rally. Silver's weekly gain of 5.1% outpaced gold's 4.2%, reflecting a pattern that consistently appears during dollar-weakness driven precious metals rallies. Consequently, gold-silver ratio insights offer investors a valuable lens for identifying momentum shifts within the broader metals complex.
Silver's tendency to outperform gold in these environments stems from three characteristics:
- Smaller market size: Silver's total market capitalisation is a fraction of gold's, meaning equivalent capital inflows produce larger percentage price moves
- Higher beta: Silver amplifies directional moves in both directions, making it more volatile and potentially more rewarding during sustained rallies
- Dual demand profile: Unlike gold, silver carries substantial industrial demand from solar panels, electronics, and medical applications, meaning its price can receive simultaneous support from both monetary and economic factors
A declining gold-silver ratio, as observed during this period, has historically corresponded with accelerating momentum phases within broader precious metals bull markets.
Five Structural Forces Behind the August 2026 Rally
Rather than a single catalyst, the gold and silver rally on a weak dollar during late August 2026 reflected the convergence of five distinct macro forces:
- Currency credibility erosion: The dollar weakened even as equities declined, breaking the traditional safe-haven correlation
- Failed yield-curve management: Treasury buyback expansion did not sustainably suppress long-term yields, redirecting market pressure into the currency
- Foreign dollar mechanics: FIMA facility expansion and U.S.-Japan currency coordination introduced new uncertainties about foreign appetite for dollar-denominated assets
- Institutional demand reconstruction: Global gold ETFs returned to net inflows in July 2026, led by European capital still in the early phases of re-engagement
- Uninterrupted official-sector accumulation: Central bank buying continued through the spring correction, establishing a demand floor independent of Western investor behaviour
None of these forces is dependent on the next CPI print or the timing of the next Federal Reserve meeting. Each operates on a multi-month to multi-year timeframe, which distinguishes the current precious metals environment from short-cycle trading rallies driven by a single data point. For a broader perspective, the gold and silver market outlook underscores how these structural drivers are likely to remain relevant well beyond a single week's price action.
Key Data Summary
| Data Point | Value | Source |
|---|---|---|
| Gold spot price (Aug 21, 2026) | ~$4,583/oz | Market data |
| Silver spot price (Aug 21, 2026) | ~$69/oz | Market data |
| Gold weekly gain | ~4.2% | Market data |
| Silver weekly gain | ~5.1% | Market data |
| Gold-silver ratio | ~66 | Market data |
| U.S. Dollar Index | ~98.7 | Market data |
| 30-year Treasury yield | ~5.25% | U.S. Treasury |
| 10-year Treasury yield | ~4.70% | U.S. Treasury |
| Global gold ETF inflow (July 2026) | +$3 billion | World Gold Council |
| Global gold ETF holdings | 4,068 tonnes | World Gold Council |
| ETF record holdings | 4,176 tonnes (Feb 27, 2026) | World Gold Council |
| European ETF inflow (July 2026) | +$2 billion | World Gold Council |
| PBoC consecutive buying months | 21 months | World Gold Council |
| S&P Global Services PMI (Aug 2026) | 56.8 | S&P Global |
| S&P Global Composite PMI (Aug 2026) | 56.0 | S&P Global |
| Treasury buyback expansion | $2B to $4B per operation | U.S. Treasury |
Frequently Asked Questions
Why does a weak dollar cause gold and silver to rise?
Gold and silver are priced globally in U.S. dollars. When the dollar loses purchasing power, international buyers in other currencies find the metals cheaper in local currency terms. This lowers the effective cost of entry for non-U.S. purchasers, stimulates global demand, and pushes dollar-denominated spot prices higher as a mechanical consequence. As APMEX explains, the inverse relationship between the U.S. dollar and precious metals prices is one of the most consistent dynamics in commodities investing.
Can gold rally even when economic data is strong?
Yes. The August 2026 episode demonstrated this clearly. Both metals advanced through services PMI data registering at multi-year highs. When the primary market concern is currency credibility rather than economic weakness, gold and silver can decouple from standard macro correlations. The metal is not pricing the economy. It is pricing the currency in which the economy is measured.
What is the FIMA Repo Facility and why does it matter for gold?
The FIMA Repo Facility, operated by the Federal Reserve, allows foreign central banks to borrow U.S. dollars by pledging their Treasury holdings as collateral rather than selling those bonds outright. It is designed to prevent forced Treasury liquidation from destabilising yields. When this facility is expanded in response to foreign pressure, it can signal to markets that dollar-denominated assets require active support, which can erode confidence in the dollar over time and redirect capital into hard assets.
What does the gold-silver ratio near 66 indicate?
A gold-silver ratio near 66 with silver outperforming suggests broadening momentum within the precious metals complex. Historically, phases where silver gains ground against gold on a sustained basis have corresponded with accelerating bull market conditions. Investors and traders use ratio movements as a leading signal of shifting demand dynamics within the metals sector.
Why are North American ETF investors lagging European buyers?
As of July 2026, North America remained the only region in net ETF outflow for the year, contributing just $71 million compared to Europe's $2 billion. This regional divergence reflects differing institutional postures and possibly a different timeline of concern regarding dollar stability. It also implies that a substantial pool of potential Western demand had not yet been deployed into the gold market, representing a possible future demand catalyst. The Canadian Mining Report has similarly noted that North American capital has been slower to re-engage with precious metals compared to its European counterparts during this cycle.
Disclaimer: This article is for informational and educational purposes only and does not constitute financial or investment advice. All data referenced is sourced from publicly available information including the World Gold Council, S&P Global, the U.S. Department of the Treasury, and the Federal Reserve. Past performance is not indicative of future results. Readers should consult a qualified financial professional before making any investment decisions.
Want to Capitalise on the Next Major Precious Metals Discovery Before the Market Does?
Discovery Alert's proprietary Discovery IQ model delivers real-time alerts on significant ASX mineral discoveries, instantly translating complex data into actionable insights for both short-term traders and long-term investors — explore historic discoveries and their exceptional returns to understand the opportunity, then begin your 14-day free trial at Discovery Alert to position yourself ahead of the broader market.