August 23, 2026

The Hidden Architecture of Rate Suppression and What It Means for Hard Assets
Most investors understand that gold and silver tend to rise when interest rates fall. What fewer understand is the precise mechanism driving that relationship, and more importantly, why rate suppression does not require an official central bank announcement to move precious metals markets. The current gold and silver rally on Fed and Treasury rate suppression dynamics reveals a far more sophisticated two-channel system than mainstream financial commentary typically acknowledges.
At the heart of precious metals pricing is the concept of real interest rates, which are nominal rates adjusted for inflation. When real yields are positive and rising, investors are rewarded for holding cash or bonds, making non-yielding assets like gold and silver comparatively unattractive. When real yields are compressed, suppressed, or declining, that opportunity cost evaporates, and capital rotates into hard assets with a track record of preserving purchasing power.
When big ASX news breaks, our subscribers know first
The Two-Channel Suppression Framework Driving Precious Metals
Channel One: Federal Reserve Balance Sheet Mechanics
The Federal Reserve's role in rate management is widely discussed. What is less widely appreciated is that quantitative easing can occur without any official announcement framing it as such. Over a recent six-month period, the Fed's balance sheet expanded by approximately $300 billion, equating to roughly $40 to $50 billion per month in net asset accumulation.
By any technical definition, this constitutes quantitative easing. The institutional logic is straightforward: the U.S. Treasury's debt issuance volume at current deficit levels requires a buyer of last resort. The Fed, regardless of the political preferences of its leadership, faces structural pressure to absorb Treasury supply and prevent long-end yields from rising to levels that would destabilise debt serviceability.
The critical insight here is that the Fed does not need to announce a policy pivot for precious metals markets to respond. When balance sheet expansion is observable in the data, markets can price in the implications before the official narrative catches up.
Channel Two: Treasury Yield Curve Management
The second channel operates through the U.S. Treasury's own market interventions, including bond buyback programs, management of issuance maturity composition, and direct intervention at the long end of the yield curve. These actions are designed to suppress long-dated yields independently of the Fed's short-end management. Furthermore, the gold and bonds dynamics at play here underscore just how interconnected these mechanisms have become.
The combined effect of both channels produces yield compression across the entire curve:
| Intervention Type | Yield Curve Target | Precious Metals Effect |
|---|---|---|
| Fed balance sheet expansion | Short to medium end | Lower real short-term rates, improved gold appeal |
| Treasury bond buybacks | Long end (10Y, 30Y) | Suppressed long yields, reduced fixed-income competition |
| Fed rate policy signalling | Overnight rate expectations | Forward rate expectations compressed |
| Combined coordination | Entire curve | Real yields depressed across all maturities |
When both institutions are working in the same direction, the signal to precious metals markets is unambiguous. Neither the Fed nor the Treasury can afford higher rates, and their combined actions confirm that rate suppression is a structural policy commitment rather than a temporary market outcome.
Why the Rally Did Not Happen Sooner: The Conviction Threshold Concept
Understanding why gold and silver staged a powerful move within a concentrated timeframe requires understanding what was missing in the months prior. The structural case for precious metals, including fiscal deficits running at approximately 6% of GDP for four consecutive years, a national debt approaching $40 trillion, and ongoing currency debasement, had been in place for years before markets repriced accordingly.
The missing ingredient was directional conviction. Precious metals markets had been suppressed not by the absence of fundamentals, but by the absence of a clear, legible signal about where rates were heading. That uncertainty creates indecision among institutional and speculative capital, both of which require a degree of confidence before committing to a directional trade.
The signal arrived through a convergence of macro data points:
- Below-consensus CPI readings that reduced the pressure on the Fed to maintain an aggressive stance
- Weaker payrolls data that pushed Treasury yields lower organically
- Observable Fed balance sheet expansion that confirmed de facto easing was already underway
- Treasury market interventions that demonstrated active management of the long end
Once this confluence of signals crossed the conviction threshold, institutional re-engagement was rapid, which explains the velocity of the price moves observed.
The Geopolitical Trigger as a Repricing Catalyst
Geopolitical events function differently from structural fundamentals in precious metals markets. Structural fundamentals can persist for years without producing asset price movement if the broader market has not yet chosen to price them in. A trigger event, by contrast, creates a focal point that forces rapid repricing of information that specialists may have been tracking for an extended period.
Conflict scenarios elevate inflation expectations, draw attention to existing fiscal imbalances, and create urgency around hard asset allocation. Importantly, the trigger does not create the fundamental case; it simply causes markets to suddenly discover what was always there. This distinction matters for investors trying to understand whether a rally represents genuine new information or the belated pricing of pre-existing structural realities.
Fundamentals always prevail in the long run. The challenge is that they can remain unpriced for years, and being early to a structural thesis is functionally equivalent to being wrong until the trigger event arrives.
Fiscal Reality: The Numbers Behind the Structural Bull Case
To understand why rate suppression is not optional but structural, it is worth examining the scale of the fiscal imbalances involved.
| Fiscal Metric | Current Level | Historical Comparison |
|---|---|---|
| U.S. fiscal deficit as % of GDP | Approximately 6% (sustained 4+ years) | ~10% during Global Financial Crisis |
| U.S. fiscal deficit peak | 15% of GDP during COVID-19 crisis | Highest peacetime deficit in modern history |
| U.S. national debt | Approaching $40 trillion | Represents a psychologically significant market milestone |
| Fed balance sheet growth (6 months) | ~$300 billion | ~$40-50 billion per month equivalent |
These figures do not necessarily signal imminent crisis. The U.S. has navigated elevated debt-to-GDP ratios before, and the absolute number matters less than the trajectory and the policy constraints it creates. What matters for precious metals investors is that a sustained deficit at 6% of GDP structurally removes the policy option of maintaining genuinely high real rates for an extended period.
Currency debasement at this pace is not a risk scenario; it is a mathematical outcome of sustained deficit spending over multiple years. As noted by analysts tracking Fed autonomy, mounting political pressure on the central bank only reinforces the structural case for gold.
This dynamic is not unique to the United States. Across multiple developed market economies, sustained balance sheet expansion and fiscal deficits are creating parallel conditions that support metals demand in local currency terms globally, providing a diversified demand base for gold and silver that extends well beyond U.S.-centric macro concerns.
Recent Price Performance: Breaking Down the 30-Day Surge
The magnitude of the recent moves across gold and silver is not merely a sentiment shift. Moves of this scale over a compressed timeframe signal meaningful repositioning among institutional investors.
| Metal | 30-Day Price Move | Percentage Gain | Market Significance |
|---|---|---|---|
| Silver | +$10.30 per ounce | +18% | Testing multi-year resistance zones |
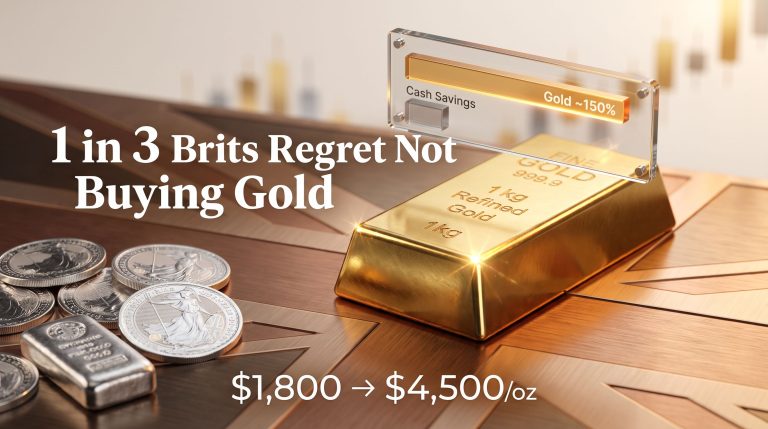
| Gold | +$470 per ounce | Significant percentage gain | Approaching key valuation thresholds in the $4,500-$4,600 range |
Understanding the Gold-to-Silver Ratio as a Timing Tool
Silver characteristically lags gold in the early stages of a precious metals bull cycle, then accelerates once risk appetite increases and the rally broadens. The gold-silver ratio analysis, which measures how many ounces of silver are required to purchase one ounce of gold, serves as a relative valuation indicator that experienced precious metals investors monitor closely.
When the ratio is elevated, silver is historically cheap relative to gold, and a mean-reversion move tends to produce outperformance for silver as the cycle matures. The conditions required for silver to sustain a trajectory toward historically elevated price levels include:
- Continued real yield compression across the curve
- Sustained dollar weakness supporting global demand
- Industrial demand remaining resilient or growing
- Speculative positioning rotating from gold into silver as relative value becomes apparent
Mining Equities: The Valuation Reset and What It Means
Why the $4,200 Gold Level Was the Inflection Point for Miners
Mining equity valuations are highly sensitive to the spot price of the underlying metal, but the relationship is not linear. Earlier in 2025, undervalued mining stocks were assessed as fairly valued (not undervalued) when gold was priced at approximately $4,200 per ounce. This distinction is important: fairly valued means that the risk-reward at that price was not particularly compelling, and any dip below that level would place valuations under pressure.
When gold pulled back below $4,200, mining stocks faced valuation risk on a discounted cash flow basis. The subsequent recovery to the $4,500 to $4,600 range restored the investment case by providing a buffer above the average realised price at which miners were selling their gold. Critically, the average realised gold price for miners in Q2 was approximately $4,600 per ounce, meaning that sustaining spot prices at or above this level is essential for maintaining profitability momentum rather than seeing it erode.
The Volatility Reality: A Risk Calibration Framework for Mining Investors
One of the most underappreciated characteristics of the precious metals mining sector is its volatility profile. The sector carries an average annual volatility of approximately 35%, which is roughly three times the volatility of global equity markets. This has significant implications for portfolio construction. In addition, the relationship between gold and mining equities is not always linear, making position sizing and diversification especially critical.
| Investor Profile | Recommended Approach | Suitable Vehicle Types |
|---|---|---|
| Specialist / Active Trader | Individual stock selection with active risk management | Individual miners, royalty and streaming companies |
| Semi-Active / Informed | Sector exposure with built-in diversification | Precious metals ETFs, sector-focused funds |
| Non-Specialist / Long-Term | Broad diversification, managed volatility | Index funds, specialist fund managers |
For investors without deep sector expertise, individual stock selection in mining carries risk that is comparable to speculative trading rather than investment. The sector's volatility means that even a correct macro thesis can result in significant short-term losses if stock selection is poor or timing is unfavourable.
The next major ASX story will hit our subscribers first
Positioning for a New Precious Metals Accumulation Cycle
How Chinese Institutional Buying Set the Stage
A feature of the consolidation period that preceded the current gold and silver rally on Fed and Treasury rate suppression was the pattern of Chinese institutional and retail buying during price weakness. While Western investors were taking profits following the strong performance of 2025, Chinese buyers were systematically accumulating gold on price dips. This demand floor prevented a more severe correction and built a technical base from which the current rally launched.
Understanding this dynamic is important for investors assessing whether the current rally is built on solid demand fundamentals or is primarily driven by momentum trading. Furthermore, central bank gold demand has played a reinforcing role, with structural buying from a geographically and institutionally diverse buyer base suggesting that the demand foundation is more durable than a purely momentum-driven move.
The Spectrum of Precious Metals Exposure: Trade-offs and Considerations
Investors seeking exposure to the current precious metals environment have multiple entry points, each with distinct trade-offs:
- Physical metals: gold and silver bullion or coins offer direct exposure with no counterparty risk but carry storage and liquidity considerations
- Exchange-traded products: ETFs and similar vehicles provide liquidity and ease of access but introduce tracking error and management fees
- Mining equities: offer leveraged exposure to metal prices but carry company-specific, operational, and jurisdictional risks on top of commodity price risk
- Royalty and streaming companies: provide exposure to metal prices with lower operational risk than direct mining, often with superior margin stability
- Specialist managed funds: offer professional stock selection and risk management for investors without sector-specific expertise
Frequently Asked Questions: Gold and Silver Rally Explained
What does rate suppression actually mean for precious metals prices?
Rate suppression refers to deliberate actions by central banks or governments to keep interest rates lower than they would otherwise be in a free market. For precious metals, this matters because lower rates reduce the opportunity cost of holding gold and silver, which pay no interest or dividend. When real yields are suppressed, non-yielding assets become comparatively more attractive, driving capital rotation into metals.
Why did gold and silver lag for several months before this rally?
The absence of directional clarity about interest rates created a holding pattern for institutional and speculative capital. Without a clear signal that either the Fed or Treasury was committed to keeping rates suppressed, the risk-reward for entering precious metals positions was insufficient to trigger large-scale re-engagement. Once that clarity emerged through observable data, the entry of institutional capital accelerated quickly.
Is the U.S. $40 trillion debt level sustainable?
The absolute debt level matters less than the trajectory and the policy constraints it creates. The U.S. has navigated high debt-to-GDP ratios previously. However, sustained deficits at 6% of GDP structurally limit the ability of policymakers to tolerate genuinely high real interest rates for extended periods. The primary risk for investors is not sovereign default but sustained currency debasement, which historically supports precious metals valuations over long horizons.
Should new investors buy individual gold and silver mining stocks?
Given the sector's average annual volatility of approximately 35%, individual stock selection in mining requires specialist knowledge that most new investors do not possess. The appropriate approach for non-specialist investors is diversified exposure through ETFs, index funds, or specialist managed vehicles, where professional risk management is applied to the inherently volatile nature of the sector.
Key Takeaways: Structural and Cyclical Signals to Monitor
The current environment for gold and silver reflects a rare alignment of structural fundamentals and cyclical catalysts. The core arguments supporting continued precious metals strength include:
- Real yields suppressed by coordinated Fed balance sheet expansion and Treasury curve management
- U.S. fiscal deficits at 6% of GDP for four consecutive years structurally limiting the policy option of sustained high rates
- Dollar weakness amplifying global demand for metals priced in USD
- Trigger events crystallising long-standing structural themes that markets had previously chosen to ignore
- Mining equity valuations reset to more defensible levels as gold holds above the $4,500 level
- Chinese institutional accumulation during weakness providing a durable demand floor
Indicators Worth Monitoring Going Forward
- Fed balance sheet trajectory: expansion versus genuine contraction
- Treasury yield curve shape: particularly movement at the long end
- CPI and payrolls data: as leading indicators of Fed policy direction shifts
- Gold-to-silver ratio: as a relative value and cycle timing tool
- Mining sector average realised gold prices: particularly whether Q3 and Q4 data sustains the $4,600 per ounce average
- Dollar index trend: as a multiplier on global metals demand dynamics
This article is intended for informational and educational purposes only and does not constitute financial advice. Precious metals markets carry significant volatility and risk. Past performance is not indicative of future results. Investors should seek independent financial advice before making investment decisions.
Want to Identify the Next Major Mineral Discovery Before the Broader Market Does?
Discovery Alert's proprietary Discovery IQ model delivers real-time alerts on significant ASX mineral discoveries, transforming complex mineral data into actionable insights for both short-term traders and long-term investors — explore the historic returns major discoveries have generated and begin your 14-day free trial today to position yourself ahead of the market.