August 23, 2026
Why PGM Price Cycles Are the Real Engine Behind Mining Profitability
The economics of platinum group metal mining are frequently misunderstood by casual observers who equate operational output with financial performance. In reality, the most powerful lever in a PGM producer's earnings profile is almost never the volume of metal it pulls from the ground. It is the price at which that metal is sold, amplified through a cost structure where a significant proportion of expenses remain fixed regardless of how much ore is processed. This dynamic, known as operating leverage, transforms modest commodity price movements into dramatic swings in profitability.
Furthermore, this creates one of mining's most compelling investment characteristics: the ability to generate outsized returns during price upswings without proportional increases in capital deployment. Understanding commodity prices and mining profits is therefore essential context before examining any single producer's result.
Northam record earnings on PGM price surge stands as one of the clearest recent demonstrations of this principle in action. A 57.4% increase in the rand-denominated 4E basket price combined with a comparatively modest 8% rise in metal sales volumes produced a near-sevenfold increase in headline earnings per share. This is not a story about a mining company that suddenly became operationally superior. It is a story about how commodity price cycles, filtered through a vertically integrated cost structure, can reshape a company's financial profile entirely within a single reporting period.
When big ASX news breaks, our subscribers know first
FY2026 Financial Results: Understanding the Asymmetric Earnings Response
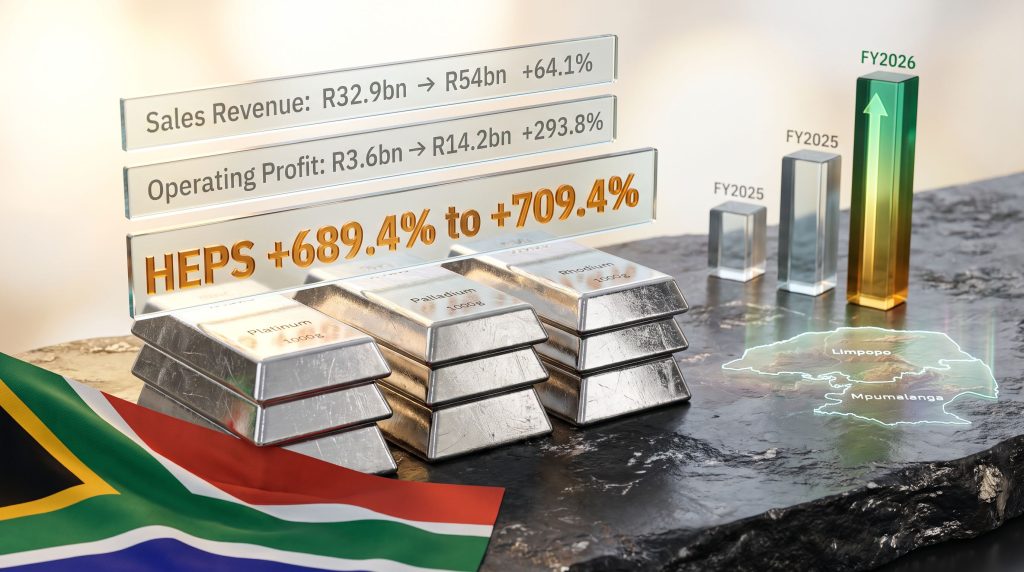
The gap between Northam's revenue growth and its earnings growth in FY2026 is the most instructive data point in the entire result set. Revenue climbed 64.1% from R32.9 billion to R54 billion, a number that would appear remarkable in almost any industrial context. Yet headline earnings per share surged by a far larger magnitude, landing in the range of 3,006.1 cents to 3,082.3 cents, representing growth of between 689% and 709% year on year.
| Financial Metric | FY2025 | FY2026 | Change |
|---|---|---|---|
| Sales Revenue | R32.9bn | R54bn | +64.1% |
| Operating Profit | R3.6bn | R14.2bn | +293.8% |
| Headline EPS | Baseline | 3,006.1c – 3,082.3c | +689% to +709% |
| Metal Sales Volume | ~1.007Moz 4E | 1.087Moz 4E | +8% |
| Rand 4E Basket Price | Baseline | — | +57.4% |
| Operating Cash (pre-capex) | — | R18.5bn | — |
| Capital Expenditure | — | R5.9bn | — |
| Gross Cash (June 2026) | — | R13.7bn | — |
| Net Cash Position | — | R2.7bn | — |
| Undrawn Banking Facilities | — | R16bn | — |
This asymmetry between revenue and earnings growth is the hallmark of a high-fixed-cost business operating in a rising price environment. Once fixed costs are covered, each additional rand of revenue flows through to profit at an accelerating rate. For investors, understanding this structural characteristic is far more valuable than monitoring quarterly production reports in isolation.
Portfolio management commentary from M&G Investments noted that while operational performance was constructive, with production exceeding guidance and unit cost increases tracking below guidance, the volume contribution to the earnings uplift remained comparatively modest. The pricing environment was unambiguously the dominant driver.
Deconstructing the 4E Basket Price and the Rand Currency Multiplier
The 4E basket refers to the four principal metals recovered from South African PGM operations: platinum, palladium, rhodium, and gold. Each metal carries a different price and is present in ore at varying grades, with rhodium historically providing the most explosive price volatility given its extremely thin market and concentrated end-use in automotive catalytic converters. For further context on platinum and palladium dynamics, these metals remain central to both near-term earnings and longer-term sector investment theses.
For South African producers, USD-denominated PGM prices are converted into rand when calculating revenue and earnings. This means rand weakness relative to the US dollar acts as a mechanical amplifier of commodity price gains. When both USD PGM prices and rand depreciation move simultaneously in a producer's favour, the compounding effect on rand-denominated revenue can be substantial. Conversely, if the rand were to strengthen while USD PGM prices remained flat or declined, JSE-listed producers would experience the reverse compression.
This currency dynamic creates a structural asymmetry that pure commodity price charts do not capture. An investor tracking platinum prices in USD may see a moderate rally and conclude the earnings uplift for South African producers should be proportional. In practice, rand weakness layered on top of that USD price recovery can translate into a materially larger rand basket price increase, which then flows through the fixed-cost operating structure to produce an earnings outcome that appears disconnected from the underlying metal market move.
The Historical PGM Price Cycle Context
The scale of the FY2026 result is partly a function of how compressed the prior-year earnings base was. The 2019 to 2021 period produced a notable supercycle in palladium and rhodium, driven by tightening global emissions standards and constrained primary supply from South Africa and Russia. Rhodium peaked above $29,000 per troy ounce in early 2021 before entering a severe multi-year correction that compressed margins across the sector through FY2023 and FY2024. The FY2026 recovery in the rand basket price is therefore partly a mean-reversion phenomenon.
PGM supply constraints throughout this period exacerbated pricing volatility on both the upside and downside, reinforcing how structurally sensitive earnings are to supply-demand imbalances at the market level.
This distinction matters for investors: earnings growth of nearly 700% sounds transformative, but it must be assessed against the equally dramatic earnings compression of the prior downcycle. The net effect over a full cycle may be more moderate than any single year's headline number suggests.
Mine-by-Mine Performance: Where the FY2026 Production Record Came From
Northam's own refined production reached a record 938,754 oz 4E in FY2026, a 4.4% increase from the prior year. Each of the three operating assets contributed differently to this outcome, as reported by Mining MX.
| Operation | Location | FY2026 Production (4E oz) | YoY Change |
|---|---|---|---|
| Zondereinde | Thabazimbi, Limpopo | 333,050 oz | +0.7% |
| Booysendal | Limpopo-Mpumalanga Border | 531,668 oz | +3.8% |
| Eland | Brits, North West | 91,205 oz | +25.9% |
| Group Total (Own Production) | — | 938,754 oz 4E | +4.4% |
Zondereinde: Deep-Level Stability and the 3 Shaft Catalyst
Zondereinde is Northam's oldest and most technically complex asset, operating as a conventional deep-level mine in Limpopo. Deep-level conventional mining involves drilling and blasting at significant depths, which creates higher unit costs than mechanised shallow operations but also accesses high-grade reef horizons that are not amenable to mechanised methods. The mine's 0.7% production increase in FY2026 reflects steady operational execution rather than growth, consistent with its role as a reliable production anchor.
The newly commissioned 3 Shaft at Zondereinde is an important medium-term volume catalyst. Shaft commissioning in deep-level mining is a multi-year process, with infrastructure needing to prove reliability before full ramp-up can occur. The progressive volume contribution from 3 Shaft is expected to underpin incremental production growth at Zondereinde over the coming years. Beyond this, the Western Extension and deeper mining horizons represent longer-term optionality, while the potential development of a 4 Shaft represents a more capital-intensive step-change option.
Booysendal: Mechanised Scale and the Backbone of the Portfolio
Booysendal is Northam's largest producing asset by volume, accounting for 531,668 oz 4E or approximately 56.6% of group own production in FY2026. The operation's mechanised mining methodology, which uses trackless equipment in flatter, shallower orebody geometries, produces structurally lower unit costs than deep-level conventional mining. Its 3.8% production increase reflects steady operational maturity rather than aggressive expansion.
One lesser-known aspect of Booysendal's geology is its position straddling the Limpopo-Mpumalanga provincial boundary, which places different reef horizons within different regulatory and logistical frameworks. The operation accesses the UG2 and Merensky reefs of the Bushveld Igneous Complex, the world's most significant repository of PGMs, estimated to hold roughly 80% of global known platinum reserves according to the United States Geological Survey.
Eland: High Growth, High Cost, and the Path to Margin Contribution
Eland's story is among the most operationally interesting in Northam's portfolio. Originally an asset under Glencore's ownership, the mine was in a mothballed state when Northam acquired it in February 2017. The restart decision came in June 2019 with the announcement of the Kukama shaft recommencement, and operations resumed during Northam's FY2020 financial year. The timeline from acquisition to meaningful production has been lengthy, reflecting the capital intensity and operational complexity of bringing a previously dormant mine back to viability.
In FY2026, Eland delivered 25.9% production growth to 91,205 oz 4E, while operating at approximately 60% of steady-state capacity. Critically, it recorded its maiden operating profit, a milestone that marks the transition from pure capital consumption to value generation.
At sub-steady-state utilisation levels, fixed costs are distributed across a smaller output base, compressing per-unit margins. As Eland scales toward full capacity through FY27 and FY28, fixed-cost dilution is expected to drive meaningful margin improvement, making the operation progressively more significant to group profitability.
The cost structure reality must be acknowledged: Eland's unit cash costs currently remain materially higher than Northam's other operations. This is a characteristic of ramp-up phase economics rather than structural operational inefficiency, and the trajectory should improve as throughput increases, mining efficiencies improve, and capital intensity declines relative to output.
How Close Is Northam to Its 1 Million Ounce Own-Production Target?
The ambition to reach 1 million ounces of own annual PGM production was first articulated as a strategic objective in 2015. More than a decade later, FY2026 own production of 938,754 oz 4E places Northam approximately 61,000 oz short of the threshold.
Reaching 1Moz does not require a single transformative event. The conditions necessary to bridge this gap are:
- Continued Eland ramp-up through FY27 and FY28 as Kukama shaft production scales toward steady state
- Sustained performance at Booysendal, where stable mechanised output provides a reliable production floor
- Progressive volume contribution from the newly commissioned Zondereinde 3 Shaft as infrastructure matures
Production materially above 1Moz would require more significant capital commitment, including the potential development of Zondereinde 4 Shaft and investments in additional processing capacity. Northam has indicated that incremental brownfield enhancements combined with third-party processing growth are expected to improve both mining tonnages and grades over the coming years.
Vision 2031: Assessing the Ambition Against the Evidence
Northam's Vision 2031 framework targets PGM sales exceeding 1.5Moz and chrome concentrate sales exceeding 2Mt within five years. Starting from FY2026 metal sales of 1.087Moz, achieving the 1.5Moz target requires approximately 40% growth in sales volumes over the period, alongside a significant scaling of chrome processing operations.
The Six Growth Levers
- Eland ramp-up to steady-state production through FY27 and FY28, transitioning from 60% to full-capacity utilisation
- Zondereinde 3 Shaft progressive volume contribution as newly commissioned infrastructure demonstrates reliability and throughput improves
- Zondereinde Western Extension lateral mining development adjacent to existing operations, accessing previously unmined reef horizons
- Deeper mining horizons at Zondereinde extending the operational life and output profile of the deep-level asset
- Zondereinde 4 Shaft a longer-dated development option representing potential step-change production growth, subject to capital allocation decisions
- Booysendal optimisation and chrome and processing throughput increases targeting both margin improvement and contribution to the 2Mt chrome concentrate target
Bull Case vs. Bear Case for Vision 2031
The credibility of Vision 2031 rests on simultaneous execution across multiple assets rather than a single high-conviction project delivering the entire outcome. This diversified growth pathway reduces single-project execution risk but increases the operational management complexity.
Bull case considerations:
- Six identified growth levers provide optionality if any single project underperforms
- FY2026 free cash flow generation of approximately R12.6 billion provides capital headroom without requiring debt funding for near-term projects
- Eland's maiden operating profit in FY2026 provides early evidence that the ramp-up trajectory is progressing as planned
- The Bushveld Complex's geological characteristics support long mine lives and relatively predictable resource delineation
Bear case considerations:
- Deep-level mining at Zondereinde carries inherent geological and geotechnical risk, including seismicity and shaft stability challenges at depth
- Chrome and processing expansion requires sustained capital allocation at a point in the cycle when pricing visibility is uncertain
- PGM price assumptions embedded in Vision 2031's financial models may not hold through a full five-year period given the historical volatility of the basket
- Rand strengthening relative to the USD could compress rand basket prices even if USD commodity prices remain stable
Portfolio analysis from M&G Investments characterises the Vision 2031 target as ambitious but potentially achievable, with the critical qualifier being that no single project bears the entire burden of delivery.
The next major ASX story will hit our subscribers first
Northam's Balance Sheet: From Defensive Management to Strategic Optionality
The FY2026 earnings surge has produced a balance sheet transformation that arguably represents as significant a strategic shift as the operating results themselves. Operations generated R18.5 billion in pre-capex operating cash flow against R5.9 billion in capital expenditure, implying approximately R12.6 billion in free cash flow before financing activities.
The resulting financial position at the end of June 2026:
- Gross cash: R13.7 billion
- Net cash position: R2.7 billion (following repayment of prior debt obligations)
- Undrawn banking facilities: R16 billion
- Total available liquidity: approximately R29.7 billion combining gross cash and undrawn facilities
This financial profile creates strategic optionality that was simply not available during the downcycle years. Capital allocation decisions now being considered could include accelerated development of Zondereinde 4 Shaft, opportunistic acquisitions of third-party PGM processing streams, increased shareholder returns, or additional chrome processing investment to progress toward the Vision 2031 chrome target.
A balance sheet built during a price upswing also serves a counter-cyclical function. The PGM sector has a well-documented history of price volatility, and producers that accumulate liquidity during periods of pricing strength are substantially better positioned to maintain capital programmes, avoid forced equity issuance, and potentially acquire distressed assets during the next downturn.
What Northam's Results Signal for the Broader South African PGM Sector
The FY2026 results across South African PGM producers broadly reflect the benefit of a firmer pricing environment following a sustained period of margin compression from FY2022 through FY2024. The critical forward-looking question for investors is whether the current pricing strength reflects a durable structural shift in PGM demand or a cyclical recovery that will eventually mean-revert again.
Structural demand arguments centre on platinum in PEM technology and the broader emerging hydrogen economy, where platinum-group catalysts are essential components in both fuel cells and electrolysers. However, hydrogen economy demand for platinum remains at an early commercial stage, and the scale and timing of any meaningful incremental demand are subject to significant uncertainty. The more immediate demand driver for palladium and rhodium remains automotive catalytic converter production, which is sensitive to global vehicle sales volumes and the pace of electric vehicle adoption.
In addition, green energy in mining operations is reshaping cost structures across the sector, with implications for long-run unit economics that could meaningfully influence margins independent of commodity price movements.
The rand currency factor adds another layer of complexity specific to South African producers. The structural tendency of the South African rand to depreciate over long periods against the US dollar creates a baseline tailwind for JSE-listed PGM companies that operates independently of commodity price movements. This is a structural characteristic of emerging market resource companies that investors in developed-market mining equities may underestimate when comparing cost structures across geographies.
What Northam's Northam record earnings on PGM price surge result ultimately demonstrates is that the most consequential analytical variable for a South African PGM producer is not tonnes milled, not shaft depth, and not even ore grade in isolation. It is the intersection of commodity price timing, currency dynamics, and operating leverage that determines when and how dramatically earnings respond to external conditions. Understanding that intersection is the foundation of any credible investment thesis in the sector, and Reuters' coverage of Northam's half-year results provides useful additional context for investors tracking the company's trajectory.
Frequently Asked Questions
What drove Northam Platinum's record earnings in FY2026?
The dominant driver was the 57.4% increase in the rand-denominated 4E basket price. While metal sales volumes grew by 8% to 1.087Moz 4E, the pricing improvement was responsible for the majority of the revenue uplift to R54 billion and the near-sevenfold increase in headline earnings per share.
What was Northam's headline earnings per share range for FY2026?
Northam's trading statement indicated HEPS in the range of 3,006.1 cents to 3,082.3 cents, representing growth of approximately 689% to 709% year on year, reflecting both the sharp pricing improvement and a compressed prior-year base.
How close is Northam to producing 1 million ounces of PGMs from its own mines?
FY2026 own production reached a record 938,754 oz 4E, placing the company approximately 61,000 oz short of the 1Moz milestone. Continued Eland ramp-up, sustained Booysendal performance, and progressive contributions from Zondereinde's 3 Shaft are the primary pathways to reaching this threshold.
What is Northam's Vision 2031 strategy?
Vision 2031 targets PGM sales exceeding 1.5Moz and chrome concentrate sales exceeding 2Mt by 2031, representing approximately 40% volume growth from FY2026 levels, delivered through six identified growth levers across Northam's three operating assets.
How does Eland fit into Northam's long-term growth plans?
Acquired from Glencore in February 2017 and restarted in FY2020, Eland is currently operating at approximately 60% of steady-state capacity. Its FY2026 maiden operating profit marks a significant milestone, and the operation is expected to become a progressively larger contributor to group margins as it approaches full throughput through FY27 and FY28.
Disclaimer: This article contains forward-looking statements and financial projections drawn from publicly available trading statements and analyst commentary. Past performance and historical price cycles are not reliable indicators of future outcomes. Commodity prices, currency movements, and operational execution are subject to material uncertainty. This content does not constitute financial advice. Investors should conduct their own due diligence and consult a licensed financial adviser before making investment decisions.
Want to Capitalise on the Next Major Commodity Price Surge?
Discovery Alert's proprietary Discovery IQ model delivers real-time alerts on significant ASX mineral discoveries, instantly transforming complex commodity data into actionable investment insights — just as PGM price cycles can reshape producer earnings overnight. Explore how historic mineral discoveries have generated substantial returns on Discovery Alert's dedicated discoveries page, and begin your 14-day free trial today to position yourself ahead of the broader market.