July 17, 2026
The Dual-Engine Problem: Why Silver and Gold Are Telling Different Stories at 70:1
Commodity markets rarely telegraph their inner workings so clearly. But when two metals that typically move in tandem suddenly diverge, the gap between them becomes one of the most information-rich signals available to investors. The gold-silver ratio at 70 to 1, reached on July 15, 2026, is exactly that kind of signal. It does not simply describe a price relationship. It encodes two separate economic narratives, running simultaneously, pulling silver and gold in different directions even when the broader macro backdrop appears similar for both.
Understanding what that ratio means, why it got there, and what it historically implies requires moving beyond the headline number and into the mechanics of how each metal actually functions in a modern economy. Furthermore, silver's dual nature as both a monetary and industrial asset is central to understanding why this divergence occurs in the first place.
When big ASX news breaks, our subscribers know first
How the Gold-Silver Ratio Works and What 70:1 Actually Represents
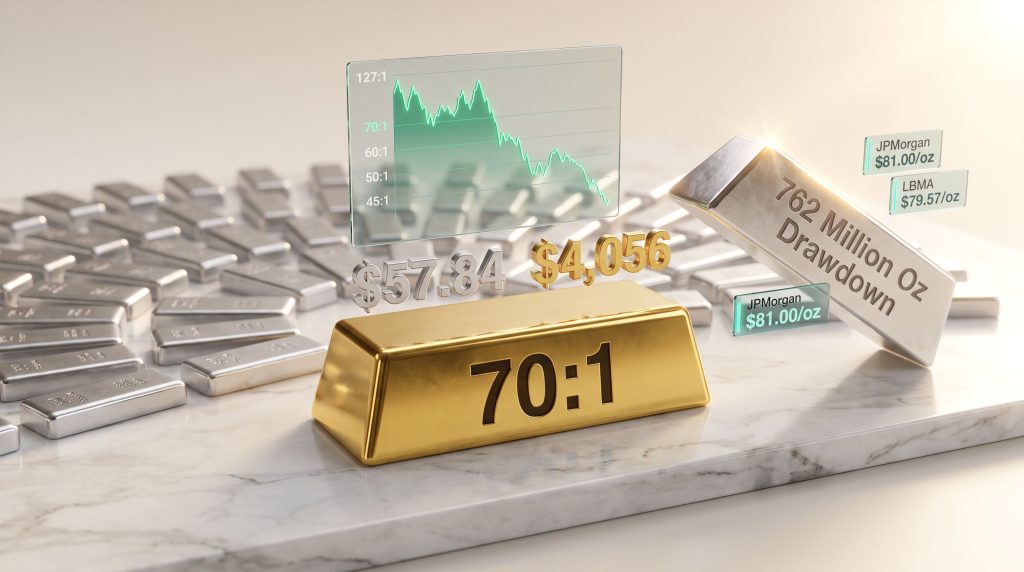
The calculation itself is straightforward. Divide the spot price of gold by the spot price of silver, and you get the ratio. With gold at $4,056 per ounce and silver at $57.84 per ounce on July 15, 2026, the result is 70:1. In plain terms, a single ounce of gold could purchase more than 70 ounces of silver at prevailing market prices.
What the ratio does not tell you is whether either metal is expensive or cheap in absolute terms. It exclusively measures the relative pricing relationship between the two. A rising ratio means silver is losing ground against gold. A falling ratio means silver is closing the gap.
Placing the current reading in historical context matters enormously. For a deeper look, a gold-silver ratio analysis covering prior cycles provides essential grounding for interpreting today's readings.
| Period / Event | Approximate Ratio | Context |
|---|---|---|
| Historical tightest range | ~30:1 | Peak silver demand cycles |
| Modern long-run average (2000–2026) | ~60:1 to 70:1 | Structural baseline |
| Pre-COVID baseline (2018–2019) | ~80:1 to 90:1 | Rate-tightening environment |
| COVID-19 panic peak (March 2020) | ~127:1 | Extreme industrial demand collapse |
| Current reading (July 15, 2026) | 70:1 | Upper boundary of 2-year range |
| Institutional target implied ratio | ~50:1 | JPMorgan $81/oz target vs. current gold |
A ratio of 70:1 is not an extreme outlier. However, it sits at the upper boundary of the two-year trading range, and it marks a threshold that many relative-value investors treat as meaningful. Historically, the zones break down roughly as follows:
- Below 50:1 – Silver considered expensive relative to gold; many investors trim exposure
- 50:1 to 70:1 – Neutral-to-moderately elevated zone; silver within a broadly normal range
- Above 70:1 – A threshold where silver begins to look undervalued relative to gold in many analyst frameworks
- Above 80:1 – Stronger contrarian signal historically for silver accumulation
- 127:1 (March 2020) – Extreme outlier; silver outperformed gold by more than 70 percentage points within five months of this peak
"A gold-silver ratio of 70:1 sits at the upper edge of the modern two-year range and at a historical threshold where many investors begin to consider silver undervalued relative to gold, though it remains well below the extreme readings seen during peak market stress events."
Understanding why the gold-silver ratio matters goes beyond simply reading a number — it informs how investors allocate across both metals depending on prevailing macro conditions. You can also track historical ratio data across multiple decades to contextualise current readings against long-run averages.
Why Gold and Silver Diverged on July 15, 2026
Gold finished the session essentially unchanged on July 15. Silver fell 1.4% to close at $57.84. The divergence is not a statistical anomaly. It is the direct result of a structural difference in how each metal derives its value, and understanding that difference is the most important thing any precious metals investor can learn.
Gold's Single Demand Engine
Gold operates on one primary demand driver: monetary demand. Central banks accumulate it as reserve assets. Institutional investors hold it as a long-term purchasing-power hedge. Individuals allocate to it as a store of value across economic cycles. Critically, none of these motivations require GDP growth, manufacturing activity, or consumer spending to remain functional.
Gold's bid persists in growth and in contraction alike, which is why it is structurally insulated from rate-driven industrial demand shocks. In addition, central bank gold demand has remained a persistent structural force supporting gold prices through varied economic conditions.
On July 15, gold received a modest additional tailwind. June CPI and PPI data both printed below analyst consensus, reducing real-yield pressure on the monetary metal and reinforcing the structural case for gold allocation among long-term holders.
Silver's Two Demand Engines and Why One Is Stalled
Silver is fundamentally different. According to the Silver Institute's World Silver Survey 2026, approximately 58% of all silver demand is industrial in origin. That industrial component includes:
- Solar photovoltaic panel manufacturing (the single largest industrial end-use)
- Semiconductor fabrication and electronics
- Electric vehicle components and battery contacts
- Medical devices and antimicrobial applications
This industrial engine ties silver's price trajectory directly to global growth expectations, capital expenditure cycles, and the cost of borrowing. When interest rates remain elevated, industrial buyers delay forward purchasing commitments. Solar installation pipelines slow. EV production forecasts are revised downward. Each of these outcomes reduces expected silver consumption, and that reduction feeds back into weaker near-term pricing.
On July 15, silver received the same monetary tailwind as gold from the softer inflation data. However, it simultaneously faced a meaningful industrial headwind. The Federal Open Market Committee was scheduled to meet July 28-29 with a hold probability approaching 90% for that specific meeting, but the September 2026 decision remained genuinely live. CME FedWatch pricing reflected meaningful odds of a September rate increase, meaning industrial demand expectations stayed suppressed. The monetary tailwind and the industrial headwind effectively cancelled each other, and silver closed down 1.4% while gold moved sideways.
"The same dual-engine structure that amplifies silver's gains in recovering economies is precisely what creates its underperformance during periods of rate uncertainty. The ratio at 70:1 is the arithmetic expression of that asymmetry."
The Macroeconomic Forces Compressing Silver's Price in Mid-2026
Three distinct headwinds were operating simultaneously against silver as of mid-July 2026, and each is worth examining on its own terms.
1. Federal Reserve Rate Path Ambiguity
The July 28-29 FOMC meeting carried a near-90% hold probability, but the September decision remained genuinely uncertain. As long as a further rate increase remained a credible scenario, industrial demand projections for silver-consuming sectors stayed depressed. Capital expenditure in manufacturing slows under elevated borrowing costs. Solar installation timelines stretch. EV adoption curves compress. Every one of these outcomes removes forward silver consumption from the demand picture.
2. Elevated Real Yield Pressure on Industrial Planning
The 10-year Treasury yield was trading near 4.60% in mid-July 2026. At these levels, capital-intensive industries that rely heavily on silver face a direct headwind through higher borrowing costs. Industrial purchasers reduce forward inventory commitments when the cost of capital is high, which generates softer near-term demand signals even when underlying secular demand trends remain intact.
3. The Asymmetric Impact of Below-Consensus Inflation Data
This is perhaps the most counterintuitive dynamic in silver's current setup. Soft June CPI and PPI prints provided a monetary tailwind to both metals by easing real-yield pressure. However, the same data that lifted gold simultaneously raised questions about the strength of industrial activity. Weaker-than-expected inflation can signal softening demand in the broader economy, creating an ambiguous environment for silver's industrial demand outlook even while supporting its monetary characteristics.
What Institutional Forecasters Are Saying About Silver at $57.84
A critical piece of context often missed in day-to-day price coverage is the distance between current market pricing and where major institutional forecasters have positioned their full-year targets.
| Institution / Survey | 2026 Silver Price Target | Implied Ratio at $4,056 Gold | Gap From Current Price |
|---|---|---|---|
| JPMorgan base case | $81.00/oz | ~50:1 | +40.1% |
| LBMA 2026 analyst consensus | $79.57/oz | ~51:1 | +37.6% |
| Current market price (July 15, 2026) | $57.84/oz | 70:1 | – |
What is notable is that institutional forecasters have not abandoned their price targets in response to silver's two-month correction. The adjustment has been to the expected timeline, not to the endpoint. Both JPMorgan's $81 base case and the LBMA's $79.57 consensus imply a ratio closer to 50:1 by year-end 2026 if gold holds near current levels, representing a significant compression from the current 70:1 reading.
The Physical Supply Reality That Short-Term Rate Pricing Cannot Override
Daily price movements and FOMC meeting probabilities operate on a completely different timescale from physical supply fundamentals. The two should not be conflated.
The Silver Institute's World Silver Survey 2026 confirmed a sixth consecutive annual supply deficit in the physical silver market. The ongoing silver supply deficits measured 46.3 million ounces for 2026, with cumulative above-ground drawdowns since 2021 reaching approximately 762 million ounces — equivalent to roughly nine months of total global mine production.
| Supply and Demand Metric | Figure |
|---|---|
| 2026 annual supply deficit | 46.3 million ounces |
| Cumulative drawdowns since 2021 | 762 million ounces |
| Equivalent in global mine supply terms | ~9 months of annual output |
| Silver's industrial share of total demand | ~58% |
| Consecutive years of supply deficit | 6 years |
Six years of structural deficits do not reverse because one FOMC meeting produces a hawkish surprise. The physical tightening of above-ground inventory represents a fundamental supply constraint that exists independently of where rate expectations are on any given trading day. This is the backdrop against which the gold-silver ratio at 70 to 1 is being priced, and it is a backdrop that many short-term traders systematically underweight.
The next major ASX story will hit our subscribers first
What History Says About Ratio Compression After Elevated Readings
The most instructive precedent for ratio behaviour following an elevated reading is the March 2020 episode. The COVID-19 panic drove the gold-silver ratio to 127:1, its widest reading in the modern era. The mechanism behind that extreme was identical to what is happening today: silver's industrial demand collapsed while gold's monetary demand remained structurally intact.
What followed provides the clearest available data point on how ratio compression unfolds. For further context, Investopedia's historical guide to the gold-silver ratio offers a useful long-run perspective on how these compression cycles have played out across different economic regimes.
- The ratio peaked at approximately 127:1 in March 2020
- Silver subsequently outperformed gold by more than 70 percentage points within five months of the peak
- The ratio compressed back toward the 60:1-65:1 range as growth and rate uncertainty resolved
- Silver's dual-engine structure, which had acted as a drag during the downturn, became an amplifier on the recovery
The mechanism reverses cleanly. Once the conditions that suppress silver's industrial demand outlook improve, the same structural characteristic that created the underperformance generates amplified upside. Silver has historically responded at approximately 1.5 times gold's magnitude on the upside when conditions normalise following periods of elevated rate uncertainty.
Illustrative Scenario: What Ratio Compression Implies for Silver Pricing
Note: The following table uses static gold price assumptions for illustrative purposes only. Gold price movement in either direction would alter outcomes. These figures are not price predictions.
| Ratio Scenario | Silver Price Required | Approximate Upside From $57.84 |
|---|---|---|
| Compression to 60:1 | ~$67.60/oz | +16.9% |
| Compression to 55:1 | ~$73.75/oz | +27.5% |
| Compression to 50:1 | ~$81.12/oz | +40.2% |
| Compression to 45:1 | ~$90.13/oz | +55.8% |
The Two Economic Signals Embedded in a Single Number
The gold-silver ratio at 70 to 1 is not a single message. It is two separate market assessments compressed into one arithmetic relationship. Both are simultaneously valid, and they apply to different time horizons.
What gold's price level is communicating:
- Inflation is moderating at the margin (June CPI and PPI missed to the downside)
- Real yields are easing relative to their recent peak
- Central bank and institutional structural demand for gold remains intact and is not rate-sensitive
- Large allocators continue to question the long-term credibility of fiat monetary systems
What silver's relative underperformance is communicating:
- Near-term growth uncertainty is elevated enough to suppress industrial demand projections
- Rate policy remains sufficiently restrictive to delay capital expenditure across solar, EV, and semiconductor manufacturing sectors
- The market is pricing a meaningful probability that economic conditions will not improve quickly enough to absorb the physical supply deficit
"A ratio of 70:1 effectively prices silver as though industrial demand weakness is a near-certain outcome. Investors who disagree with that specific assessment, or who believe rate uncertainty will resolve on a shorter timeline than the market implies, are looking at a monetary entry point on silver that does not require a particular growth outcome to be valid."
Key Data Points and Catalyst Dates to Monitor
| Event / Data Point | Date | Significance for the Ratio |
|---|---|---|
| FOMC Rate Decision | July 28-29, 2026 | A hold with neutral language would likely begin compressing the ratio; hawkish language maintains industrial headwinds |
| June PCE Data Release | July 30, 2026 | The Fed's preferred inflation gauge; a soft print would ease real-yield pressure on both metals simultaneously |
| September FOMC Meeting | September 2026 | Continued hike probability keeps industrial demand suppressed; a confirmed pause removes the primary headwind |
| 10-Year Treasury Yield | Ongoing | Currently ~4.60%; a sustained move below 4.25%-4.50% would ease pressure across silver-consuming industries |
Three specific indicators have historically preceded ratio compression from elevated levels:
- A confirmed Federal Reserve pause or pivot that removes residual rate hike risk from market pricing
- A sustained decline in the 10-year Treasury yield below the 4.25% threshold, signalling easing real-yield pressure across the broader economy
- PCE inflation printing below 2.5%, reducing the probability of further tightening action and providing a simultaneous monetary tailwind to both metals
Frequently Asked Questions About the Gold-Silver Ratio at 70:1
Why did silver fall while gold was flat in July 2026?
Silver's pricing responds to both monetary demand and industrial demand simultaneously. On July 15, both metals received a modest monetary lift from softer-than-expected inflation data. However, silver simultaneously faced suppressed industrial demand expectations driven by lingering uncertainty around the September FOMC meeting and elevated real yields. Gold carries no industrial demand component and therefore was unaffected by the second force. The net result was a 1.4% decline in silver against essentially no movement in gold.
Does a 70:1 ratio mean investors should buy silver?
The ratio alone does not constitute investment advice and should never be used as the sole basis for any allocation decision. However, readings above 70:1 have historically represented entry points where silver subsequently outperformed gold once rate uncertainty resolved. Investors using relative-value frameworks often view this level as a moderate signal favouring silver's monetary characteristics. Individual risk tolerance, portfolio context, and broader financial circumstances should always be considered before acting on any market signal.
How much silver has been consumed from above-ground inventories since 2021?
According to the Silver Institute's World Silver Survey 2026, cumulative above-ground silver drawdowns since 2021 have reached approximately 762 million ounces, equivalent to roughly nine months of total global annual mine production. The market has recorded a supply deficit in each of six consecutive years through 2026, with the most recent annual deficit measured at 46.3 million ounces.
What would cause the ratio to fall from 70:1?
The primary catalysts for ratio compression would include: a confirmed Federal Reserve pause removing residual hike risk; a meaningful decline in the 10-year Treasury yield below the 4.25%-4.50% range; PCE inflation data reducing further tightening probability; or a strengthening in global manufacturing output that reinforces the forward outlook for silver's industrial demand across solar, EV, and semiconductor applications.
The Structural Case That Outlasts Any Single Rate Cycle
Short-term rate pricing and daily FOMC positioning narratives will cycle through repeatedly over the months ahead. What does not cycle at the same pace is the physical supply backdrop that underpins silver's structural investment thesis.
Six consecutive years of supply deficits, a cumulative drawdown of 762 million ounces, secular growth in photovoltaic manufacturing, and institutional price targets sitting 37-40% above current market pricing collectively constitute a structural case that operates on a fundamentally different timescale than the rate expectations that drove silver to $57.84 on July 15, 2026.
The gold-silver ratio at 70 to 1 captures a specific moment of tension between two valid but differently-timed signals. The short-term industrial demand headwind is real and measurable. The long-term structural supply deficit is equally real, and it is not resolved by a single FOMC decision in either direction. Investors who understand the difference between these two timescales are better positioned to evaluate what the current ratio reading actually means for their own allocation decisions.
Disclaimer: This article is intended for informational and educational purposes only and does not constitute financial or investment advice. Precious metals investing involves risk, including the possible loss of principal. Past performance is not indicative of future results. Always consult a qualified financial adviser before making investment decisions. Price figures and ratio readings referenced throughout reflect market data as of July 15, 2026.
Want to Identify ASX Mineral Discoveries Before the Broader Market Does?
Discovery Alert's proprietary Discovery IQ model delivers real-time alerts on significant ASX mineral discoveries, turning complex commodity data into actionable insights for investors at every level — explore historic discoveries and the returns they generated, then begin your 14-day free trial at Discovery Alert to position yourself ahead of the market.