
June 25, 2026
Silver's Beta Problem: Why the Gold-Silver Ratio Is the Most Misread Chart in Precious Metals
Every significant monetary tightening cycle in modern history has produced the same pattern: gold weakens, silver falls harder, and commentators announce that the precious metals bull market is over. They are almost always wrong about the conclusion, and almost always right about the short-term mechanics. Understanding the gold-silver ratio and silver price drop dynamic is not just an academic exercise. It is the difference between reading a price decline as a structural breakdown versus a cyclical regime shift.
The gold-silver ratio sitting at approximately 67:1 as of June 24, 2026 is not a random data point. It is a live reading of a specific tension playing out across two competing forces. Decoding it requires understanding what the ratio actually measures, and more importantly, what it does not.
When big ASX news breaks, our subscribers know first
What the Gold-Silver Ratio Actually Measures
The Ratio as a Regime Diagnostic, Not a Valuation Signal
The most common application of the ratio among retail investors is straightforward: divide the gold spot price by the silver spot price, and the resulting number tells you whether silver is cheap or expensive relative to gold. Detailed gold-silver ratio analysis shows that at a long-run average of approximately 54:1 since 1970, a reading above that level suggests silver is relatively discounted, while a reading below it suggests silver has gained ground.
That interpretation is valid, but it is only half the picture. At an advanced analytical level, the ratio functions as a regime indicator that reveals which of silver's two pricing engines is currently dominating. This distinction carries real portfolio implications.
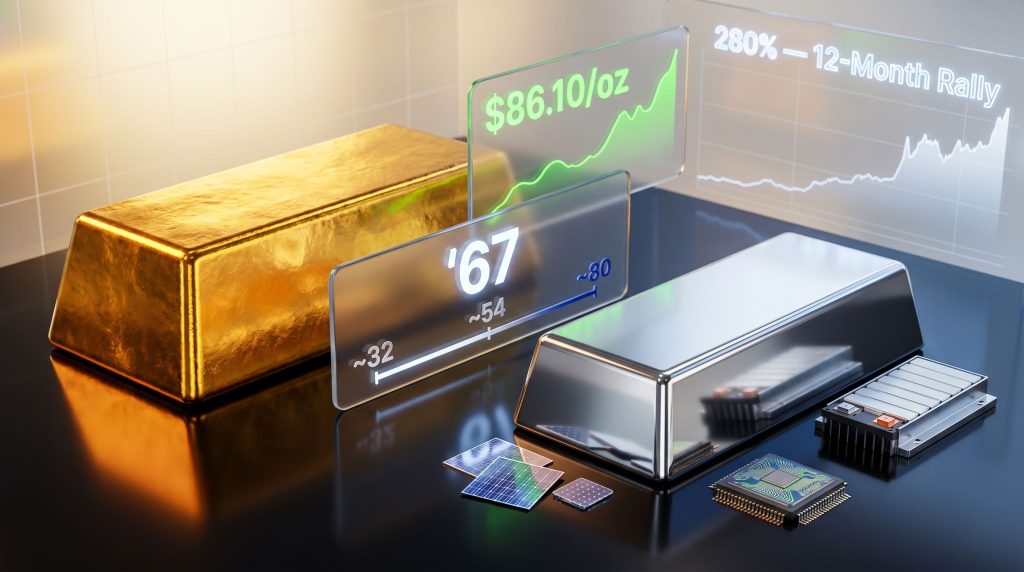
When the ratio widens sharply, it signals that monetary headwinds are overpowering commodity tailwinds. When it compresses rapidly, it signals that industrial demand repricing is outrunning monetary drag. The magnitude and speed of those movements can be striking: following the US-China 90-day tariff truce announced in May 2026, which reduced US tariffs on Chinese goods from 145% to 30% and Chinese retaliatory tariffs from 125% to 10%, silver surged approximately 7.1% to $86.10/oz, compressing the ratio from roughly 62 to 54.94 within days (TradingEconomics, June 2026).
Key Analytical Point: The gold-silver ratio is most powerful not as a prediction tool, but as a real-time diagnostic that identifies which macroeconomic force is in control of silver pricing at any given moment.
Historical Ratio Ranges and Their Implied Market Regimes
| Ratio Level | Historical Context | Implied Market Regime |
|---|---|---|
| ~32 (2011 low) | Post-GFC stimulus + industrial demand surge | Monetary and industrial engines firing together |
| ~54 (1970–present average) | Long-run equilibrium | Balanced monetary and industrial forces |
| ~67 (June 24, 2026) | Fed rate-hike fears post-geopolitical relief | Monetary headwinds suppressing industrial gains |
| ~80 (April 2026 peak) | Iran conflict; risk-off environment | Maximum monetary dominance; silver severely discounted |
| ~88 (early 2024) | Pre-bull market base | Silver deeply undervalued relative to gold |
The compression from ~80 to ~54.94 following the tariff truce, and the subsequent expansion back to ~67 following the FOMC's hawkish revision, maps precisely onto the regime-shift interpretation. The ratio is not drifting randomly; it is responding to identifiable macroeconomic inputs with measurable logic. For a deeper perspective, silver versus gold performance across historical cycles reinforces this pattern clearly.
Silver's Dual-Engine Architecture: Why Rate Hikes Hit Harder
Two Demand Categories, One Price
Unlike gold, which operates almost exclusively as a monetary and reserve asset, silver's dual nature means it occupies two structurally distinct demand categories simultaneously. This dual-engine architecture is the source of both its dramatic upside potential and its asymmetric downside during monetary tightening cycles.
Engine One: The Monetary Engine
- Responds to real yields, inflation expectations, US dollar strength, and central bank forward guidance
- Moves in the same direction as gold, but with amplified sensitivity
- Subject to opportunity cost pressure when Treasury yields rise
Engine Two: The Industrial Engine
- Responds to solar panel manufacturing volumes, EV battery system demand, AI data centre infrastructure buildout, and semiconductor fabrication
- Follows manufacturing and capex cycles rather than central bank policy signals
- Structurally growing due to the ongoing energy transition and technology sector expansion
When both engines fire simultaneously, as occurred during the 2009 to 2011 bull market, silver dramatically outperforms gold and the ratio compresses to historically low levels. When they diverge, specifically when monetary headwinds stall the monetary engine while industrial demand remains robust, silver experiences asymmetric downside relative to gold.
The Opportunity Cost Mechanism Explained
How Rate-Hike Expectations Suppress Silver Specifically: A 10-year Treasury yield at 4.50% represents direct, income-generating competition for capital that might otherwise flow into non-yielding precious metals (US Treasury/FRED, June 2026). Silver, which generates no yield, becomes mathematically less attractive the higher real rates climb. Gold faces identical arithmetic pressure, but benefits from a structural demand offset that silver cannot access.
That offset is central bank reserve accumulation. The World Gold Council's 2026 Central Bank Gold Reserves Survey found that a record 45% of central banks plan to increase their gold holdings during the year. These institutional buyers operate on multi-decade investment horizons, meaning quarterly rate cycle fluctuations do not alter their accumulation thesis. Silver carries no equivalent institutional reserve mandate. Its investor base is more price-sensitive, shorter-horizon oriented, and directly exposed to margin pressure.
The practical outcome is measurable: the same set of monetary headwinds on June 24, 2026 produced a ~1.7% decline in gold versus a ~5.4% decline in silver, a 3.2 percentage point divergence explained almost entirely by this structural asymmetry (GoldSilver.com spot prices; TradingEconomics, June 23, 2026).
The Federal Reserve's Policy Shift as the Dominant Market Variable
The FOMC Projection That Repriced the Metals Complex
The June 17, 2026 Federal Reserve meeting, the first conducted under Chair Kevin Warsh, delivered a materially hawkish shift in the Summary of Economic Projections. Nine of 18 FOMC officials now project at least one rate increase before the end of 2026 (Federal Reserve, Summary of Economic Projections, June 17, 2026). Warsh did not submit his own projection. Deutsche Bank and Bank of America Global Research subsequently revised their year-end rate forecasts to incorporate at least one hike. CME FedWatch pricing shifted to reflect approximately two-thirds probability of at least one rate increase before December 2026 (CME FedWatch, June 2026).
This repricing collided directly with a geopolitical de-escalation narrative that, on paper, should have been bullish for silver. The US-Iran 60-day peace roadmap (TradingEconomics, June 2026), followed by a US-granted oil export licence for Iran, set oil prices on a declining path. Lower oil prices reduce inflationary pressure, which in turn reduces the urgency for the Fed to tighten, compressing real yields and improving the relative attractiveness of non-yielding assets. The transmission mechanism is logically sound. The timing, however, is the critical complication.
The Backward-Looking Data Problem
May PCE inflation data, scheduled for release on Thursday June 25 at 8:30am EDT, carries a consensus forecast of 4.1% year-over-year, which would represent the highest reading since April 2023 (FactSet consensus, June 2026). Core PCE, stripping out food and energy, is expected at 3.3% to 3.4%.
The critical insight most market participants are missing: the May PCE dataset was collected when oil prices were still elevated from the Iran conflict. Any deflationary benefit flowing from the peace deal will not appear in official inflation data until the June PCE release in late July 2026. Thursday's print is structurally backward-looking, but markets are likely to trade it as a forward-guidance signal regardless.
PCE Scenario Analysis: Three Paths for the Gold-Silver Ratio
| PCE Outcome | Market Interpretation | Likely Ratio Direction | Silver Implication |
|---|---|---|---|
| At or above 4.1% YoY | Rate hike confirmed as necessary | Ratio holds at 67 or extends higher | Continued underperformance vs. gold |
| Below 3.4% Core PCE | Disinflation resuming; hike odds reprice lower | Ratio likely compresses toward 60–62 | Silver recovers faster than gold |
| In-line (3.3–4.1% range) | Ambiguous; market awaits June data | Ratio consolidates; no directional break | Sideways action, elevated volatility |
Furthermore, current gold-silver ratio insights suggest that each of these scenarios carries meaningfully different implications for how quickly the monetary engine of silver's pricing reasserts itself.
Does a Widening Ratio Signal a Structural Break for Silver?
Cyclical Monetary Pressure vs. Structural Supply Reality
The ratio widening from 64 to 67 in a single week reflects short-term monetary regime dominance. It does not reflect a reversal of silver's multi-year supply and demand thesis. Persistent silver supply deficits, running for six consecutive annual periods from 2021 through 2026, have drawn down approximately 762 million troy ounces from above-ground silver stockpiles. These deficits are driven by structural industrial demand growth, not speculative positioning, which means they are not sensitive to quarterly changes in the Federal Reserve's dot plot.
The demand categories driving those deficits share a critical characteristic: they expand independent of interest rate cycles.
- Solar photovoltaic manufacturing continues scaling globally, with silver paste remaining a non-substitutable input in panel production
- Electric vehicle battery systems incorporate silver in multiple electrical contact applications
- AI data centre infrastructure and semiconductor fabrication require silver in precision components where no cost-effective substitute currently exists
- 5G and advanced electronics manufacturing maintain baseline silver demand floors that do not compress during monetary tightening
A 12-Month Perspective on Silver's Trajectory
Context Check: Silver has delivered approximately a 280% rally over the trailing 12 months, sharply outpacing gold's ~90% gain over the same period (GoldSilver.com, June 2026). A 5.4% single-session decline against this backdrop represents a consolidation within a structural bull trend, not evidence of a trend reversal.
The US-China tariff truce episode from May 2026 illustrated with unusual clarity how rapidly silver reprices when industrial demand catalysts align. The 7.1% price surge and corresponding ratio compression from 62 to 54.94 unfolded within days. Monetary headwinds can temporarily suppress that dynamic, but the underlying repricing capacity remains structurally intact. According to historical data tracked by Macrotrends, these compression cycles have reliably followed periods of extended ratio elevation.
The Asymmetric Recovery Case for Long-Term Silver Holders
Why Silver Reprices Faster Than Gold When Conditions Shift
One of the least discussed but most consequential properties of silver's dual-engine structure is the asymmetric recovery dynamic that emerges when Fed-dominant market regimes reverse. When monetary headwinds ease, both of silver's pricing engines simultaneously receive a tailwind, creating a compounding repricing effect that gold, operating primarily on a single monetary engine, cannot replicate at the same speed.
The most illustrative historical precedent is the 2009 to 2011 cycle. As post-GFC tightening fears faded and risk appetite recovered, the gold-silver ratio compressed from approximately 80 to a low of 32, a 60% compression driven primarily by silver's outperformance as industrial demand and monetary tailwinds aligned. Investors who exited silver positions during the ratio-widening phase at 80 missed the entirety of that compression.
Physical vs. Paper Silver: A Distinction That Matters in Rate-Driven Selloffs
Paper silver instruments, including futures contracts, leveraged ETFs, and derivatives-based products, carry exposures that physical silver does not. When rate expectations shift aggressively:
- Futures positions face mark-to-market losses that can trigger margin calls and forced liquidation
- Leveraged products amplify drawdowns beyond the underlying spot price decline
- ETF outflows can create additional selling pressure disconnected from physical market fundamentals
Physical silver holdings carry none of these exposures. There is no counterparty, no margin requirement, and no dilution from derivatives positioning. A rate-driven paper price decline does not alter the physical supply deficit, the industrial demand trajectory, or the monetary debasement thesis. What changes in a monetary tightening regime is the paper price. The physical market reality remains structurally unchanged. As GoldSilver.com notes, this distinction becomes especially consequential during extended ratio-widening periods.
Ratio Thresholds Worth Monitoring
| Ratio Level | Signal for Long-Term Investors | Historical Precedent |
|---|---|---|
| Above 80 | Extreme silver undervaluation; historically strong accumulation zone | April 2026 conflict peak; 2020 COVID spike |
| 67–80 | Monetary headwinds dominant; structural thesis intact but suppressed | Current zone (June 2026) |
| 54–67 | Transitional zone; industrial and monetary forces rebalancing | Post-tariff truce (May 2026) |
| Below 54 | Industrial demand repricing dominant; silver outperforming | 2011 bull market low of ~32 |
The next major ASX story will hit our subscribers first
Frequently Asked Questions: Gold-Silver Ratio and Silver Price Movements
What is the gold-silver ratio and how is it calculated?
The ratio is calculated by dividing the current gold spot price by the current silver spot price. Using June 2026 prices as an example: gold at approximately $4,730/oz divided by silver at $86.10/oz produces a ratio of roughly 54.94. A higher ratio indicates silver is relatively cheaper compared to gold on a historical basis; a lower ratio indicates silver has gained ground relative to gold.
Why does silver fall more than gold on the same negative catalyst?
Silver's industrial demand exposure makes it more sensitive to economic growth expectations and monetary policy outlook than gold. Gold additionally benefits from central bank reserve buying that provides a structural price floor absent in silver markets. The result is systematically higher beta: silver amplifies both upside and downside moves relative to gold, typically by a factor of two to three during monetary regime shifts.
Is a gold-silver ratio of 67 historically high or low?
At a long-run average of approximately 54:1 since 1970, a ratio of 67 sits meaningfully above the historical mean. It reached approximately 80 at the April 2026 geopolitical peak and compressed to roughly 54.94 following the US-China tariff truce. A reading of 67 therefore represents a mid-cycle reversion driven by renewed monetary headwinds, elevated relative to equilibrium but well within the range of prior monetary-dominance regimes.
What would cause the gold-silver ratio to compress from current levels?
Several catalysts could trigger compression from the current 67 level:
- A softer-than-expected PCE inflation print reducing rate-hike probability
- Continued geopolitical de-escalation flowing through to lower energy prices and reduced measured inflation
- Acceleration in industrial silver demand from solar, EV, or AI infrastructure sectors
- A shift in Fed forward guidance signalling a pause or an end to the projected tightening cycle
- Renewed weakness in the US dollar reducing the opportunity cost comparison with non-yielding assets
Does a falling silver price mean the long-term bull case is broken?
No. The gold-silver ratio and silver price drop dynamic driven by monetary policy repricing does not alter the physical supply deficit, the industrial demand growth trajectory, or the debasement thesis underpinning long-term precious metals ownership. Six consecutive annual supply deficits represent a physical market reality that interest rate expectations cannot resolve. The paper price changes; the structural fundamentals do not.
Key Takeaways
- The gold-silver ratio at 67:1 is functioning as a regime diagnostic, signalling that Fed rate-hike expectations are the dominant near-term pricing force for silver
- Silver's dual-engine pricing structure creates asymmetric downside during monetary tightening cycles and asymmetric upside when those cycles reverse
- Gold's structural floor from central bank reserve accumulation, with a record 45% of central banks planning to add gold in 2026, provides protection that silver's investor base does not replicate
- Six consecutive supply deficits and approximately 762 million troy ounces drawn from above-ground stockpiles represent a structural reality that quarterly dot plot revisions cannot reverse
- The PCE inflation print is the most significant near-term catalyst for determining how long monetary dominance of silver pricing persists
- Historically, when Fed-driven ratio widening reverses, silver reprices faster and more dramatically than gold, making the current environment a period of constrained patience rather than a structural exit signal
This article is for informational and educational purposes only and does not constitute financial or investment advice. Precious metals investing involves risk and past performance is not indicative of future results. Always consult a qualified financial adviser before making investment decisions. Sources: Federal Reserve Summary of Economic Projections (June 17, 2026); CME FedWatch Tool (June 2026); World Gold Council Central Bank Gold Reserves Survey 2026; US Treasury/FRED 10-Year Constant Maturity Yield; Bureau of Economic Analysis Personal Income and Outlays; FactSet/Morningstar PCE consensus forecasts; TradingEconomics commodity and geopolitical data; GoldSilver.com spot prices.
Want to Catch the Next Major ASX Mineral Discovery Before the Market Does?
Discovery Alert's proprietary Discovery IQ model delivers real-time alerts on significant ASX mineral discoveries, instantly translating complex data across more than 30 commodities into clear, actionable insights — giving subscribers a decisive edge whether they're trading short-term momentum or positioning for long-term structural trends. Explore historic discoveries and their remarkable returns, then begin a 14-day free trial to experience how Discovery Alert keeps investors ahead of the market.