June 11, 2026
When Markets Sell Into Fear: Understanding the Current Precious Metals Correction
Precious metals corrections that unfold during periods of geopolitical stress are among the most disorienting events for investors to navigate. The instinct suggests that war, energy disruption, and political uncertainty should send gold and silver prices higher. Yet the gold and silver selloff how low will prices go question becomes increasingly urgent as history repeatedly demonstrates that leveraged markets can temporarily override those intuitions, creating sharp selloffs precisely when the fundamental case appears strongest.
That paradox is playing out right now. The ongoing conflict involving Iran, the prolonged closure of the Strait of Hormuz, and a cascade of geopolitical uncertainty have not produced the flight-to-safety rally many anticipated. Instead, gold and silver are experiencing meaningful price declines driven by forced selling, margin pressure, and speculative position unwinding.
When big ASX news breaks, our subscribers know first
Why the Gold and Silver Selloff Is Happening Now
The Counterintuitive Mechanics of a Risk-Off Episode
The Strait of Hormuz closure represents one of the most significant energy supply disruptions in recent memory. Roughly 20% of the world's seaborne oil passes through this waterway, and its disruption has implications for energy prices, inflation, and global supply chains. Yet rather than triggering a sustained gold rally, the crisis has contributed to a de-risking wave across asset classes.
The mechanism is straightforward once you understand how leveraged portfolios behave under stress. When energy prices spike due to supply disruptions, traders holding leveraged positions across multiple asset classes, including gold and silver futures, face margin calls. To meet those calls, they sell whatever is liquid. Gold and silver futures are highly liquid, making them an easy source of quick capital.
This dynamic is compounded by the behaviour of speculative traders who entered precious metals markets during the earlier bull run. Many of those positions were built on leverage, and when momentum reverses, algorithmic systems accelerate the unwinding. The selling begets more selling, amplifying the decline well beyond what fundamental demand signals would justify.
Structural Bear Market or Cyclical Flush-Out?
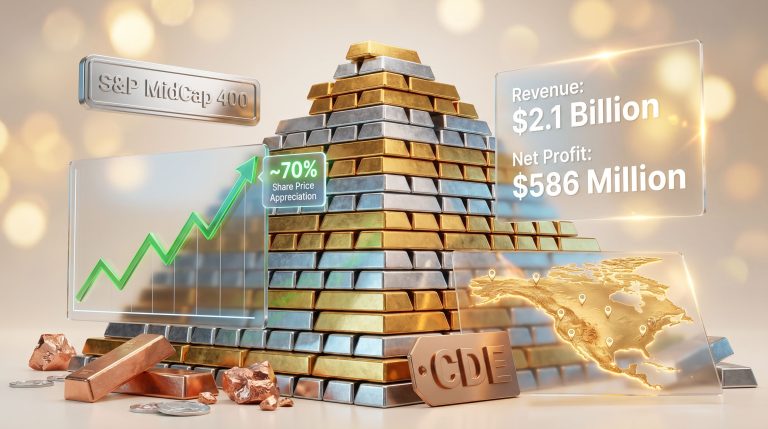
The distinction between a speculative purge and a genuine breakdown in the bull thesis is critical. Analysts at major institutions, including BlackRock, have continued to describe the broader outlook for precious metals as constructive despite the near-term turbulence. The fundamental drivers that supported gold's multi-year ascent, including central bank accumulation, currency debasement concerns, and negative real yield environments, have not materially changed.
Historical precedents from 2020 and 2022 offer important context. Both periods featured sharp, forced-selling episodes in gold and silver that resolved within weeks rather than months, with prices subsequently recovering to new highs. The pattern is consistent: leveraged position unwinding creates an overshoot to the downside, followed by a recovery once speculative inventory is cleared and fundamental buyers re-enter.
The current selloff appears to be driven primarily by leveraged position unwinding rather than a collapse in underlying demand, a distinction that materially changes how investors should evaluate the current price environment.
How Low Can Gold Prices Realistically Fall?
The Three-Scenario Framework for Gold's Downside
Framing gold's downside risk requires acknowledging a range of outcomes depending on the macro environment that unfolds. The following scenario structure reflects current market analysis, though investors should note that all price forecasts carry significant uncertainty.
| Scenario | Price Zone | Primary Trigger |
|---|---|---|
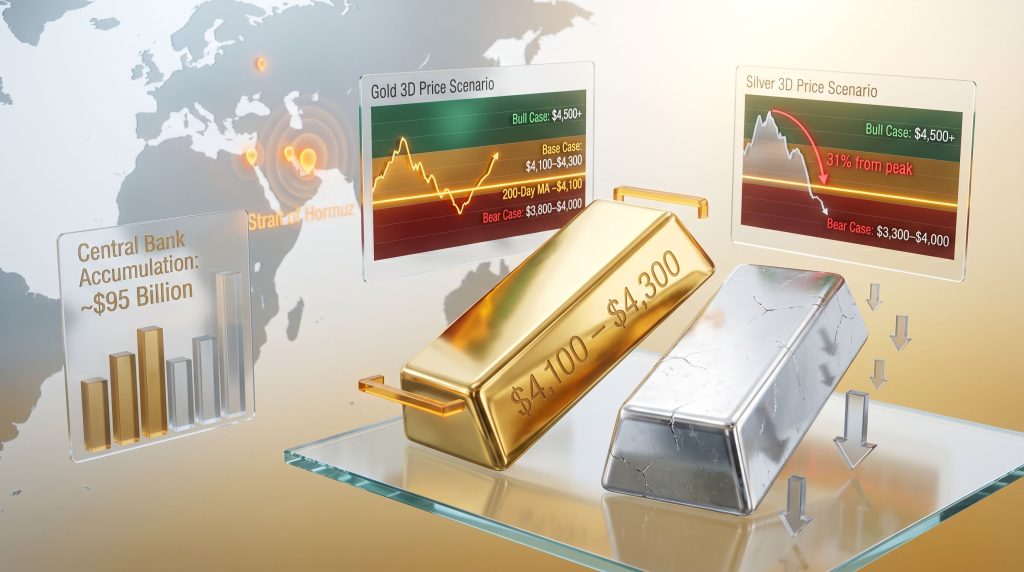
| Base Case | $4,100 – $4,300 | Continued speculative deleveraging, stable macro backdrop |
| Bear Case | $3,800 – $4,000 | Break below 200-day MA; macro deterioration |
| Extreme Bear | Below $3,800 | Systemic shock; aggressive USD strengthening |
Why $4,100 Is the Line That Matters Most
Technical analysts consistently identify gold's 200-day moving average, currently near $4,100, as the most significant institutional reference point in the current correction. This level functions as more than just a number on a chart. It serves as a trigger point for algorithmic trading systems and institutional risk management protocols.
A sustained close below the 200-day moving average would shift the technical posture from a bull market correction to a potential trend reversal signal. That shift matters because it alters the positioning calculus for large institutional players and momentum-driven systematic funds. Throughout previous gold bull cycles, the 200-day MA has demonstrated meaningful accuracy as both a support level during corrections and a resistance barrier after trend reversals.
What Would Push Gold Below $4,000?
Breaking gold convincingly below the $4,000 threshold would likely require a convergence of multiple adverse macro conditions occurring simultaneously:
- Aggressive Federal Reserve tightening signals that push real yields sharply higher
- A significant strengthening of the US dollar, reducing gold's appeal to non-dollar buyers
- A rapid resolution of geopolitical tensions that eliminates risk premium from current prices
- A simultaneous reduction in central bank buying activity at current price levels
Most current market analysis frames this combination as a lower-probability outcome. Furthermore, central bank gold demand has remained structurally elevated throughout 2025 and into 2026, with sovereign buyers collectively spending an estimated $95 billion accumulating gold reserves in recent years according to Monetary Metals analysis. Sovereign buyers operating with multi-decade time horizons do not abandon accumulation programmes because of a speculative selloff in futures markets.
Silver's Vulnerability: Greater Downside Than Gold
Why Silver Amplifies Price Moves in Both Directions
Silver's dual role as both a monetary metal and an industrial commodity creates a uniquely complex risk profile. During risk-off episodes driven by leveraged selling, silver typically underperforms gold significantly. The current correction has confirmed that pattern, with silver having already experienced declines exceeding 31% from peak levels in the latest leg lower.
The explanation lies in silver's market structure. It trades with considerably lower liquidity than gold, meaning that equivalent selling pressure produces larger price moves. Additionally, silver carries a higher proportion of speculative positioning relative to physical demand, making it more sensitive to forced unwinding events.
Silver vs. Gold: Current Risk Profile Comparison
| Metric | Gold | Silver |
|---|---|---|
| Primary Price Driver | Macro and geopolitical risk premium | Speculative positioning dominance |
| Downside Risk Assessment | Moderate | Higher |
| Key Technical Support | $4,100 – $4,300 | Variable, harder to define precisely |
| Institutional Demand Floor | Strong (central bank buying) | Weaker, more retail and speculative driven |
| Primary Recovery Catalyst | Geopolitical resolution or Fed pivot | Industrial demand recovery plus macro stabilisation |
Silver's industrial demand component, which spans solar panels, electric vehicle components, electronics, and medical applications, provides a theoretical price floor. However, during acute speculative selloffs, that industrial demand support is overwhelmed by paper market dynamics. The physical demand signal takes weeks or months to register in price action, by which time the speculative flush has already run its course.
The Macro Events Shaping Near-Term Price Direction
The Hormuz Paradox and Its Price Implications
A prolonged closure of the Strait of Hormuz should theoretically be among the most bullish macro events imaginable for gold. Energy price shocks historically correlate with inflation expectations, currency uncertainty, and gold safe-haven dynamics. Yet the mechanism described earlier, margin calls forcing liquidation across asset classes, has temporarily inverted that relationship.
The key variable from here is trajectory. A resolution of Middle East tensions that reduces energy prices could paradoxically be bullish for gold if it removes the margin call pressure while leaving geopolitical uncertainty premiums partially in place. Conversely, a further escalation that triggers deeper energy market disruption could extend the forced selling cycle before the safe-haven bid reasserts itself.
The Fort Knox Audit Question
Renewed scrutiny around the verification of US gold reserves has re-entered market discourse. The Fort Knox audit question, which asks whether official US gold holdings have been independently verified in recent decades, carries potential market implications that are difficult to quantify but important to understand.
If an audit were to confirm the full integrity of official reserves, it could reduce some structural uncertainty from the gold market. A disconfirmatory outcome, or even prolonged delay in providing transparent verification, could become a meaningful bullish catalyst for gold by raising questions about the true supply picture in official holdings.
Federal Reserve Policy and the Real Yield Equation
Gold and real yields share one of the most well-documented inverse relationships in financial markets. When real yields (nominal rates minus inflation expectations) rise, the opportunity cost of holding non-yielding gold increases, pressuring prices. When real yields fall, gold becomes relatively more attractive.
As Mike Maharrey has noted in analysis published through Gold-Eagle, a scenario in which spiking inflation sends real yields lower, regardless of what the Fed does with nominal rates, could become a powerful and rapid reversal catalyst for gold. This means that an environment of rising inflation combined with a Fed that is slower to raise rates than inflation demands could be extremely bullish for gold, even without an explicit policy pivot.
A spiking inflation scenario could send real yields lower regardless of the Federal Reserve's nominal rate decisions, creating a structurally bullish environment for gold that does not require a formal Fed pivot to materialise.
Key Signals That Would Confirm a Price Floor
Investors attempting to identify a bottom in the gold and silver selloff how low will prices go debate should monitor a combination of technical and fundamental indicators rather than relying on any single data point.
Technical signals to watch:
- Gold's ability to hold above $4,100 on a closing basis, confirming the 200-day MA as support
- Declining sell volume as a potential exhaustion signal within the downtrend
- RSI and momentum oscillator readings approaching oversold levels consistent with previous corrective bottoms
- Failure of repeated tests of key support to produce new closing lows
Fundamental signals that could confirm a bottom:
- Acceleration of central bank purchase activity near current price levels
- Stabilisation or reversal of ETF outflow trends, indicating institutional accumulation
- Physical premium spreads widening above paper futures prices, signalling real demand exceeding paper supply
- Reduction in open interest in futures markets as speculative inventory is cleared
A combination of stabilising ETF flows, continued sovereign buying at current levels, and a closing hold above $4,100 would collectively suggest the correction is approaching exhaustion and a recovery phase is becoming more likely.
The next major ASX story will hit our subscribers first
Price Scenario Outlook: June Through September 2026
Gold Price Scenarios
| Timeframe | Bull Case | Base Case | Bear Case |
|---|---|---|---|
| 1 Month | Recovery toward $4,500+ | Consolidation $4,100–$4,400 | Test of $4,000 support |
| 3 Months | New highs above $4,600 | Gradual recovery to $4,400–$4,500 | Extended range $3,800–$4,100 |
| Key Catalyst | Geopolitical escalation, Fed pivot | Deleveraging completes, demand stabilises | Major USD rally or macro shock |
Silver Price Scenarios
| Timeframe | Bull Case | Base Case | Bear Case |
|---|---|---|---|
| 1 Month | Sharp recovery, outperforms gold | Stabilisation with ongoing volatility | Further 10–15% downside |
| 3 Months | Industrial demand drives outperformance | Gradual recovery, lagging gold | Underperforms gold, new correction lows |
| Key Catalyst | Industrial demand surge, green energy acceleration | Speculative positioning normalises | Continued forced selling, liquidity crunch |
Disclaimer: All price scenarios are speculative in nature and reflect analytical frameworks rather than guaranteed outcomes. Precious metals markets are subject to significant volatility, and investors should conduct independent research before making financial decisions.
What Long-Term Investors Should Understand About Corrections Within Bull Markets
The Historical Correction Pattern
One of the most important frameworks for evaluating the current selloff is the historical behaviour of gold during sustained bull markets. Corrections of 10–20% are not anomalies within gold bull cycles; they are recurring features. Each of the major gold bull markets of the past half-century included multiple corrections of this magnitude before ultimately resolving to new highs.
The relevant question is not whether a correction is painful, but whether it is occurring within a structurally intact uptrend or signalling a fundamental trend reversal. The indicators for distinguishing between these two scenarios include central bank behaviour, real yield trajectory, and the pace of dollar-denominated debt expansion globally. On all three measures, the structural case for gold remains intact despite the current price decline.
Central Bank Accumulation as the Structural Price Anchor
Central banks accumulated gold at historically elevated rates over recent years, with collective purchases representing an estimated $95 billion in recent years according to analysis from Monetary Metals. This is not speculative behaviour. Sovereign institutions are making deliberate, multi-decade strategic decisions to hold a greater proportion of reserves outside the US dollar system.
The geopolitical diversification motive behind this accumulation does not disappear because gold's spot price falls 15% from its peak. Nations adding gold reserves are doing so because of long-term concerns about currency debasement, dollar reserve dominance, and the stability of the international monetary system.
The Inflation Hedge Thesis: Still Structurally Valid
One of the more nuanced points that most retail investors miss is the distinction between gold as a short-term inflation trade and gold as a long-term store of value against cumulative currency debasement. In the short term, rising interest rates to combat inflation can pressure gold. Over multi-year cycles, however, gold consistently reflects the cumulative erosion of purchasing power in fiat currencies.
The inflation hedge thesis remains structurally valid because the conditions that generated inflationary pressure in recent years, specifically fiscal deficits, supply chain restructuring, and energy transition costs, have not been resolved. They have been temporarily managed, and that distinction matters enormously for investors with time horizons measured in years rather than weeks.
Frequently Asked Questions: Gold and Silver Selloff 2026
How low will gold prices go in 2026?
The most widely referenced downside support zone for gold sits between $4,100 and $4,300, anchored by the 200-day moving average near $4,100. A sustained break below $4,000 would require a significant new macro catalyst and is currently considered a lower-probability outcome by most market analysts. According to Investopedia's analysis of the selloff drivers, forced liquidation rather than weakening fundamentals remains the primary explanation for current price weakness.
Why is silver falling more than gold right now?
Silver carries a higher speculative component and trades with lower liquidity than gold during risk-off episodes. This makes it more sensitive to margin-driven forced selling, resulting in sharper percentage declines relative to gold during corrections. Furthermore, the gold-silver ratio has widened considerably during the current correction, reflecting silver's historically elevated vulnerability to speculative unwinding.
Is now a good time to buy gold or silver?
Current analysis from major institutions suggests the selloff reflects speculative deleveraging rather than a fundamental breakdown. For long-term investors, corrections of this nature have historically represented accumulation opportunities, though near-term volatility is expected to remain elevated until the speculative inventory is fully cleared. Staged accumulation rather than single-point entry is the risk management approach most commonly advocated during high-volatility corrections. This is not financial advice; all investment decisions should be made in consultation with a qualified financial professional.
What is the Fort Knox audit and why does it matter for gold?
The Fort Knox audit refers to ongoing calls for an independent, transparent verification of US government gold reserves. Uncertainty about the authenticity or completeness of sovereign gold holdings can influence speculative positioning in futures markets and add complexity to price discovery, representing a source of structural uncertainty that occasionally resurfaces in market discourse.
What would trigger a gold price recovery from current levels?
The primary recovery catalysts for the gold and silver selloff how low will prices go question include the following:
- A geopolitical resolution or escalation in the Middle East that restores conventional safe-haven demand
- A Federal Reserve signalling shift that reduces real yields meaningfully
- An acceleration of central bank gold purchasing at current price levels
- A stabilisation in the US dollar that removes currency-related headwinds for non-dollar buyers
In addition, Morningstar's market commentary highlights that a clearing of speculative futures positions could itself be a sufficient catalyst for a sharp recovery, independent of macro developments. For additional perspectives and ongoing analysis of the current market environment, Gold-Eagle.com maintains a broad range of independent analyst commentary and price forecasts covering precious metals market dynamics.
Want To Know Which ASX Mineral Discoveries Could Benefit From Shifting Precious Metals Dynamics?
Discovery Alert's proprietary Discovery IQ model delivers real-time alerts on significant ASX mineral discoveries, instantly translating complex commodity data into actionable investment insights — explore historic discoveries and their exceptional returns to understand the opportunity, then begin your 14-day free trial to position yourself ahead of the broader market.