July 30, 2026
Understanding the Recurring Rhythm of Precious Metals Pricing
Every market has a heartbeat, and for gold and silver, that rhythm is more predictable than most investors realise. Long before macroeconomic headlines dominate financial news cycles, the structural architecture of demand quietly shapes price behaviour across the calendar year. For precious metals, this creates a recurring seasonal pattern that has played out with remarkable consistency across 25 years of price data, offering investors a potentially powerful framework for timing entry and exit decisions.
The concept of gold and silver seasonality in summer is not rooted in speculation or short-term noise. It reflects genuine shifts in jewellery purchasing cycles, institutional trading participation, industrial procurement behaviour, and monetary demand patterns that repeat with enough regularity to be analytically meaningful. Understanding these dynamics does not guarantee returns, but it can meaningfully reduce the probability of buying at cyclical peaks and selling into seasonal troughs.
When big ASX news breaks, our subscribers know first
Why Summer Creates a Structural Soft Patch for Precious Metals
The Demand Architecture Behind the Pattern
Precious metals demand is not evenly distributed across the calendar year. The second half of the year is structurally more demand-intensive, driven by a convergence of forces that are largely absent during summer months.
Key demand drivers that concentrate in the August-to-February window include:
- Festival and wedding season jewellery purchasing across South and Southeast Asia, where gold consumption per capita remains among the highest globally
- Year-end coin and bar demand from Western retail investors, which intensifies around the fourth quarter
- Holiday season jewellery demand across North American and European markets
- Year-end portfolio repositioning by institutional participants seeking to establish or increase precious metals exposure before the new fiscal year
When these catalysts are absent, as they consistently are during June in particular, both gold and silver lose a primary demand anchor. The result is a price environment where sellers face reduced buying pressure, and prices tend to drift lower unless a significant macro catalyst intervenes.
The Summer Doldrums Effect and Lower Trading Volumes
Reduced institutional participation during the Northern Hemisphere summer months affects far more than precious metals. Equity, commodity, and currency markets all experience measurable declines in trading volume during this period. For gold and silver, the consequence is a thinner market where price moves in either direction can be amplified relative to their underlying fundamental significance.
This creates a dual dynamic for investors. On one hand, seasonal price weakness can look more dramatic than the underlying fundamentals warrant, triggering emotional selling. On the other hand, the same thinness can accelerate recoveries once buying interest returns in late summer and early autumn. Furthermore, understanding seasonal gold price patterns across broader historical datasets reinforces just how consistent this thinning effect tends to be.
Seasonal weakness in precious metals is not a signal of fundamental deterioration. It is a structurally predictable pattern driven by demand timing, and understanding it transforms price dips from sources of anxiety into potential accumulation opportunities.
What 25 Years of Gold Price Data Reveals About May Through August
Monthly Win Rate Analysis for Gold
Analysing 25 years of monthly closing price data for gold produces a consistent directional pattern across the summer months, despite minor variations depending on dataset selection and whether futures or spot prices are used as the reference point.
| Month | Positive Close Rate | Seasonal Characterisation |
|---|---|---|
| May | ~55% | Mixed with a slight positive lean |
| June | ~40% | Weakest month of the calendar year |
| July | ~60% | Recovery month following June lows |
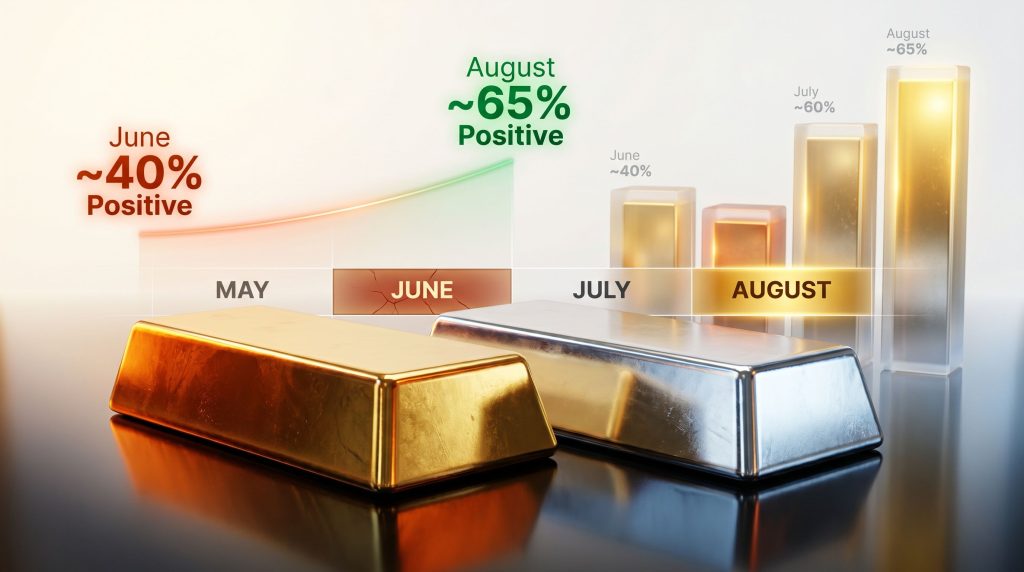
| August | ~65% | Transitional strength into fall season |
June stands out as the single weakest month in the gold price calendar. Over the 25-year study period, gold closes in positive territory only approximately 40% of the time during June, meaning prices end lower roughly three out of every five Junes on a historical basis.
The July rebound pattern is equally notable. Recovery from June lows is a consistent feature of the seasonal calendar, with positive close rates rising to approximately 60% in July. August then strengthens further to around 65%, signalling that the transition into the autumn bull season is already underway by the final weeks of summer.
The Historical Bull Season Window
The data points consistently to a multi-month period of seasonal strength that runs from approximately August through February. This window captures the full arc of demand intensification described above: jewellery purchasing cycles, festival-season buying, year-end investment demand, and post-summer re-engagement from institutional traders. The consistency of this pattern across varying macroeconomic backdrops makes it one of the more durable seasonal tendencies in commodity markets.
It is worth noting that exact win rate percentages can vary slightly depending on whether futures or spot prices are used, and whether monthly averages or closing prices are analysed. However, the directional pattern remains consistent across all reasonable dataset configurations.
How Silver's Summer Seasonality Compares to Gold
Monthly Win Rate Analysis for Silver
Silver's seasonal pattern closely mirrors gold's over the same 25-year period, with June again registering as the weakest month and July marking the beginning of a consistent recovery.
| Month | Positive Close Rate | Seasonal Characterisation |
|---|---|---|
| May | ~50% | Balanced with no clear directional edge |
| June | ~40% | Weakest month, mirrors gold's seasonal low |
| July | ~60% | Recovery month with strong rebound tendency |
| August | ~62.5% | Follow-through strength heading into autumn |
The shared June seasonal low for both metals is analytically significant. Investors holding positions in both gold and silver face simultaneous headwinds during this month, which can create the misleading impression that something fundamentally wrong is occurring in precious metals markets when the pattern is in fact entirely normal from a seasonal perspective.
Gold vs. Silver: Key Behavioural Differences in Summer
While the directional seasonal pattern is similar for both metals, there are important differences in how they behave on a month-to-month basis during summer.
Gold tends to exhibit comparatively lower volatility during summer months, reflecting its predominantly monetary character. Silver, by contrast, carries a dual identity as both a monetary asset and a critical industrial input used extensively in electronics manufacturing, solar panel production, and a range of industrial applications. This industrial demand layer introduces additional price sensitivity that can cause silver to diverge meaningfully from gold during periods of manufacturing cycle shifts or industrial demand shocks.
While both metals share a June seasonal low, silver's industrial demand component introduces a layer of complexity that can cause meaningful price divergence from gold during periods of manufacturing cycle shifts, making month-by-month analysis essential for silver investors rather than treating the two metals as interchangeable.
The gold-silver ratio tends to be informative during summer months precisely because of this divergence potential. When silver underperforms gold during June weakness, it may reflect industrial demand softness rather than purely monetary sentiment, requiring a different analytical lens.
What COMEX Physical Delivery Patterns Reveal About Institutional Behaviour
Understanding COMEX Contract Structure
The Chicago Mercantile Exchange's COMEX division is the primary futures market for gold and silver pricing in the United States. Physical deliveries on COMEX are a downstream product of open interest and contract expiry cycles. To take physical delivery of metal, a participant must hold an open futures contract in an active delivery month. This means physical delivery volumes are structurally tied to the contract cycle calendar, not to spot price movements on any given day.
The distinction between speculative futures positioning and physical delivery activity is critically important for understanding what delivery data actually tells investors. Speculative traders rarely take delivery; they close positions before expiry. Physical delivery activity, by contrast, reflects genuine demand from industrial buyers, refiners, central banks, and large institutional participants who actually want the metal.
Gold's Major COMEX Delivery Months and Summer Patterns
Gold's major active contract months on COMEX are February, April, June, August, October, and December. These months see significantly higher open interest and delivery notice activity compared to off months.
| Month | Contract Status | Delivery Activity | Price Context |
|---|---|---|---|
| May | Minor off-month | Low | Mixed pricing (~55% positive) |
| June | Major contract month | High, among strongest in summer | Historically weak (~40% positive) |
| July | Off-month | Reduced | Prices recovering (~60% positive) |
| August | Major contract month | High, strong volumes | Prices strengthening (~65% positive) |
The counterintuitive logic embedded in this data is worth examining closely. June is simultaneously the weakest price month for gold and one of its heaviest physical delivery months, with notable years including 2024 recording delivery volumes in the range of 20,000 to 30,000 contracts. Large institutional and industrial buyers are, in aggregate, taking the most physical metal precisely when prices are at their seasonal lows. This is not coincidence. It reflects a disciplined counter-cyclical purchasing strategy that retail investors rarely replicate.
July's lower delivery volumes, despite recovering prices, reinforce this interpretation. Once prices begin rising, the urgency to accumulate physical inventory at discounted levels diminishes, and delivery activity naturally falls.
August presents a more nuanced case. Despite rising prices, delivery volumes remain elevated because institutional participants are positioning ahead of the historically strong autumn demand season. They are, in effect, willing to pay slightly higher prices in August to ensure inventory is secured before the seasonal bull phase fully develops.
Silver's Major COMEX Delivery Months and Summer Patterns
Silver's major active delivery months differ structurally from gold's. The primary active months for silver on COMEX are January, March, May, July, September, and December. This offset in peak delivery months between the two metals is not a reflection of different fundamental demand dynamics. It is simply a product of how the original contract structures were designed when these futures markets were established.
| Month | Contract Status | Delivery Activity | Price Context |
|---|---|---|---|
| May | Major contract month | High, elevated versus off months | Often weaker pricing (~50% positive) |
| June | Off-month | Modest | Weakest price month (~40% positive) |
| July | Major contract month | High, strong activity | Recovery underway (~60% positive) |
| August | Off-month | Lower | Prices strengthening (~62.5% positive) |
For silver, May functions as the equivalent of June in gold: the primary institutional accumulation window within the summer seasonal calendar. Large buyers in the silver market begin their counter-cyclical accumulation one month earlier than gold buyers, driven by the contract cycle structure rather than any difference in fundamental conviction.
The Counter-Cyclical Discipline of Institutional Participants
The contrast between institutional and retail behaviour in precious metals markets is one of the most consistent and instructive patterns in the data. Retail investors, across virtually every asset class, demonstrate a strong tendency to buy into rising prices. This confirmation bias behaviour means retail capital typically flows into gold and silver after prices have already risen, systematically eroding the available return from any given entry point.
Large industrial and institutional market participants on the LBMA and COMEX markets demonstrate the opposite tendency. Physical delivery data consistently shows elevated accumulation during periods of price weakness, with reduced activity during price strength. This counter-cyclical discipline is not accidental. It reflects systematic frameworks for procurement cost management that are embedded in institutional buying strategies.
Delivery data from major exchanges provides a more reliable signal of institutional conviction than spot price movements alone. When physical deliveries rise during periods of price weakness, it suggests professional participants view the dip as a structural buying opportunity rather than a fundamental deterioration.
The Post-2020 Structural Shift in Physical Demand
COMEX From Speculative Venue to Physical Delivery Market
Prior to 2020, COMEX functioned predominantly as a speculative pricing venue for gold. From approximately 2006 through to 2019, a period spanning roughly 14 years, physical delivery volumes remained relatively subdued. Brief spikes occurred around the 2008-2009 global financial crisis, but the baseline plateau for delivery activity was notably lower than what has been observed in subsequent years.
Silver followed a broadly similar trajectory, though its delivery profile carried more industrial demand influence throughout that earlier period.
Why Delivery Volumes Have Remained Structurally Elevated Since 2020
The economic disruptions of 2020 triggered a sustained re-rating of both gold and silver as monetary reserve assets and crisis hedges. Crucially, physical delivery volumes have not reverted to pre-disruption norms even as some economic conditions partially normalised in subsequent years. Several structural drivers appear to be maintaining this elevated demand environment:
- Inflation has run persistently above the prior decade's average, reducing confidence in fiat currency purchasing power
- Labour force participation rates have not fully recovered from the disruptions of 2020, with real wage growth lagging behind cost-of-living increases for many households
- Central bank gold demand has remained at historically elevated rates, with multiple sovereign reserve managers increasing gold's share of national reserves
- Growing awareness of sovereign debt sustainability concerns has broadened the investor base for physical precious metals beyond traditional gold buyers
- Silver supply deficits, documented in annual industry reports including those published by the Silver Institute, point to structural imbalances beginning around the 2020-2021 period
Supply-demand balance figures for silver carry inherent uncertainty due to the complexity of above-ground stock estimates and recycling flow calculations. Annual industry reports remain the most widely referenced benchmarks, but analysts should treat deficit figures as directional indicators rather than precise measurements.
Silver's post-2020 demand elevation reflects a dual dynamic: ongoing industrial demand growth, particularly in renewable energy infrastructure and electronics manufacturing, layered on top of rising monetary demand from investors seeking purchasing power protection.
The next major ASX story will hit our subscribers first
Retail Investor Psychology and the Confirmation Bias Trap
Why Retail Investors Consistently Buy High
Confirmation bias is the single most powerful behavioural force working against retail precious metals investors. The pattern is consistent across asset classes: retail participants wait for prices to rise before committing capital, seeking social proof that others are buying before taking action. In precious metals, this manifests as accelerating retail purchasing volumes precisely when prices are approaching seasonal or cyclical peaks, and declining interest during seasonal troughs when the risk-adjusted opportunity is statistically strongest.
The investor who buys gold in September because prices have already risen significantly from June lows is paying a premium for the same metal that was available at a discount just months earlier. Over multiple cycles, this systematic timing disadvantage compounds into a meaningfully lower effective return compared to investors who accumulate during seasonal weakness.
The Alpha Seeker Framework
In market terminology, alpha refers to returns that exceed the average performance of a broader participant cohort. For precious metals investors, generating alpha does not require exotic instruments or complex strategies. It requires the discipline to act counter-cyclically: accumulating during seasonal weakness rather than chasing strength.
Investors seeking this kind of structural edge combine several analytical inputs:
- Seasonal price pattern data (the 25-year monthly win rate framework outlined above)
- COMEX delivery data to confirm whether institutional participants are increasing physical accumulation
- Macroeconomic indicators including inflation trajectory, real wage growth, and consumer credit stress
- Commitment of Traders (COT) report data to assess managed money positioning in futures markets
Dollar-Cost Averaging: Conditions for Effectiveness
Dollar-cost averaging into precious metals is a valid long-term strategy, but its effectiveness depends critically on two conditions being met simultaneously.
Dollar-cost averaging works effectively when:
- The investor maintains a separate, dedicated cash reserve for personal emergencies and is not reliant on precious metals holdings for near-term liquidity needs
- The long-term price trend of the asset being accumulated is upward, since averaging into a sustained downtrend produces ongoing losses until a trend reversal occurs
Dollar-cost averaging is structurally compromised when:
- Precious metals holdings double as an emergency fund, creating the risk of forced liquidation at seasonal price lows
- The investor has not stress-tested their financial resilience against a 6-to-12 month period of price weakness without requiring access to capital
Investors who treat precious metals as their primary liquidity reserve face a structural vulnerability. Seasonal price weakness may coincide with personal financial stress, forcing asset sales at precisely the wrong point in the cycle. Maintaining a separate cash buffer is a foundational risk management principle for precious metals investors.
Macroeconomic Factors That Could Amplify the Seasonal Recovery
Inflation Trajectory and Precious Metals Demand
Historically, sustained above-average inflation correlates with elevated gold and silver demand as purchasing power hedges. When the seasonal recovery period coincides with an inflationary macro environment, the two forces can compound each other, producing price appreciation that exceeds what seasonal patterns alone would predict.
Treasury yield dynamics add a further dimension to this relationship. Real yields (nominal yields adjusted for inflation) represent the opportunity cost of holding gold, which produces no income. When inflation keeps real yields low or negative, the relative attractiveness of gold as a safe haven increases, providing additional tailwind to seasonal price recoveries.
Geopolitical Supply Chain Disruptions
Disruptions to key trade routes and commodity-producing regions can accelerate inflationary pressures across food, energy, and industrial inputs simultaneously. When commodity inflation broadens across multiple categories rather than remaining isolated in a single sector, safe-haven flows into gold and silver tend to increase as investors seek assets that preserve purchasing power outside of the affected supply chains.
Historical precedents demonstrate that geopolitical supply shocks can amplify and extend precious metals' seasonal recovery periods, with the autumn price strengthening that typically begins in August potentially developing into a more sustained multi-month advance when macro conditions are supportive. For a more detailed examination of how these forces interact with seasonal timing, Sprott's analysis of the summer doldrums offers useful institutional-grade context.
Debt Dynamics, Consumer Stress, and the Safe-Haven Floor
Rising household debt stress, declining consumer spending capacity, and deteriorating credit quality metrics across auto loans and mortgages have historically functioned as leading indicators for precious metals demand. When consumers face increasing financial pressure, the proportion of the population seeking assets outside the traditional banking and credit system tends to grow, expanding the effective demand base for physical gold and silver.
Central bank reserve diversification provides an additional structural demand floor. With multiple sovereign reserve managers having increased gold allocations in recent years, the physical market now has a more robust institutional buyer base than was present during previous seasonal weak periods.
The COT Report as a Forward Positioning Indicator
The Commitment of Traders (COT) report, published weekly by the Commodity Futures Trading Commission (CFTC), breaks down futures market positioning by participant category. For precious metals analysis, the managed money category, which encompasses hedge funds and large institutional investment funds, is the most closely watched.
Managed money participants tend to establish net long positions ahead of anticipated price appreciation, often acting on macroeconomic and fundamental analysis that leads the price action by weeks or months. When managed money open interest in gold and silver futures begins rising during a period of spot price weakness, it is frequently a signal that large institutional participants are building positions in anticipation of a medium-term price recovery.
Bullion banks operate as structural counterparties in this dynamic. They are almost universally net short in precious metals futures markets, creating an ongoing tension between their short positioning and managed money's long positioning that drives much of the directional price action in gold and silver futures over medium-term horizons.
Seasonal Trading Calendar: Gold and Silver Month by Month
| Month | Gold Tendency | Silver Tendency | Strategic Implication |
|---|---|---|---|
| January | Variable, repositioning risk | Variable | Monitor macro shifts, avoid reactive buying |
| February | Major delivery month | Major delivery month | Institutional activity elevated |
| March | Moderate | Major delivery month | Silver accumulation window |
| April | Major delivery month | Moderate | Gold institutional activity elevated |
| May | Mixed (~55% positive) | Balanced (~50% positive) | Primary silver accumulation window |
| June | Weakest month (~40% positive) | Weakest month (~40% positive) | Primary gold accumulation window |
| July | Recovery (~60% positive) | Recovery (~60% positive) | Trend shift, early positioning |
| August | Strengthening (~65% positive) | Strengthening (~62.5% positive) | Fall setup underway for both metals |
| September | Historically strong | Historically strong | Seasonal bull phase begins |
| October | Strong | Strong | Continued seasonal strength |
| November | Strong | Strong | Jewellery and investment demand peak |
| December | Major delivery month | Major delivery month | Year-end institutional positioning |
Furthermore, analysts at ValueTrend have examined whether gold and silver are positioned for a seasonal pop in line with these historical tendencies, providing an additional layer of perspective on the late-summer recovery dynamic.
Seasonal patterns represent historical tendencies across multi-decade datasets and are not predictive guarantees for any individual year. Macroeconomic conditions, geopolitical events, and structural market changes can override seasonal norms in any given year. This calendar is intended as one input within a broader analytical framework, not as a standalone trading signal.
Frequently Asked Questions on Gold and Silver Seasonality in Summer
Is summer always a bad time to hold gold and silver?
Seasonal weakness is a statistical tendency, not a certainty. Approximately 40-55% of summer months still close positive for both metals, meaning the pattern does not hold in every individual year. Significant macro catalysts including inflation shocks, geopolitical crises, and banking system stress can override seasonal norms in any given year. For existing holders, seasonal weakness is generally not a reason to liquidate. For investors considering new capital deployment, it may represent a statistically favourable entry window.
Why is June specifically the weakest month for both gold and silver?
June sits at the intersection of several converging forces: reduced institutional trading participation, the absence of major seasonal demand catalysts, the tail end of spring portfolio repositioning, and for gold specifically, a major COMEX contract month in which large institutional participants are actively increasing physical delivery activity at lower prevailing prices. The combination of lower retail demand and disciplined institutional accumulation creates the characteristic June price dynamic that has repeated across 25 years of data.
What is the difference between COMEX futures prices and spot prices?
Spot price reflects the current market value for immediate or near-immediate delivery of physical metal. Futures prices reflect the agreed price for delivery at a specified future date. The two are closely correlated but not identical. The spread between them, known as the basis, reflects carrying costs, prevailing interest rates, and near-term supply and demand dynamics. For most retail investors, spot price is the most relevant reference point. Futures market data, including delivery volumes and COT positioning, is more useful for understanding institutional behaviour and medium-term price direction.
How do COMEX delivery months differ between gold and silver?
Gold's major active delivery months are February, April, June, August, October, and December. Silver's major active months are January, March, May, July, September, and December. The offset between the two metals reflects the contract structures established when these futures markets were originally designed, not any fundamental difference in demand dynamics. The practical implication is that the primary institutional accumulation window for silver (May) occurs one month earlier than the equivalent window for gold (June).
Key Takeaways: Navigating Gold and Silver Seasonality in Summer
- June is the statistically weakest month for both gold and silver based on 25 years of price data, with only approximately 40% of June monthly closes ending positive for either metal
- July and August mark a consistent seasonal recovery, with positive close rates rising to 60-65% for gold and 60-62.5% for silver
- The primary seasonal bull window for precious metals historically runs from approximately August through February, driven by jewellery demand cycles, festival-season buying, and year-end investment activity
- COMEX delivery data confirms institutional counter-cyclical behaviour: large participants increase physical accumulation during price weakness, with June being the peak window for gold and May for silver
- Post-2020 structural demand elevation has kept physical delivery volumes above pre-2020 norms for both metals, sustained by persistent inflation, monetary demand growth, and central bank accumulation
- Managed money COT positioning in gold and silver futures has historically led price recoveries, making rising managed money open interest during periods of spot price weakness a meaningful forward indicator
- Retail confirmation bias remains the primary behavioural obstacle preventing individual investors from capturing the statistical advantage embedded in seasonal accumulation windows
- Dollar-cost averaging effectiveness is contingent on maintaining a separate cash liquidity reserve and investing during a long-term uptrend, making financial resilience a prerequisite for the strategy to deliver its intended outcomes
This article is intended for educational and informational purposes only and does not constitute financial, investment, or trading advice. Past seasonal patterns are historical tendencies and do not guarantee future performance. Precious metals investing involves risk, including the possible loss of principal. Readers should conduct their own research and consult a qualified financial adviser before making any investment decisions.
Want to Know When the Next Major Mineral Discovery Hits the ASX?
Discovery Alert's proprietary Discovery IQ model delivers real-time alerts on significant ASX mineral discoveries, transforming complex data into actionable insights so investors can position themselves ahead of the broader market — explore historic discovery returns to see what's possible, and begin your 14-day free trial at Discovery Alert today.