July 15, 2026
The Crumbling Foundation: Why Hard Assets Are Reasserting Their Role in a Fractured World
Across centuries of monetary history, one pattern repeats with uncomfortable consistency: when sovereign debt expands beyond the capacity of productive economies to service it, the purchasing power of paper currencies erodes, and real assets reassert their role as stores of value. The Roman Empire debased its silver coinage to fund legions it could no longer afford. The British Empire expanded its money supply to finance wars on multiple continents. Today, the United States carries a debt burden that would have been unthinkable to any previous generation of policymakers, and the structural consequences are beginning to surface in asset markets worldwide.
Understanding why gold and silver amid US debt and war fears are commanding record prices in 2026 requires looking beyond headline inflation figures and into the deeper mechanics of fiscal deterioration, monetary policy constraints, and geopolitical fracture lines that are reshaping capital allocation globally.
When big ASX news breaks, our subscribers know first
The Fiscal Architecture of a Debt Spiral
U.S. Debt: A Structural Problem Disguised as a Cyclical One
The U.S. national debt has surpassed $37 trillion, growing at an annual rate of between $1.5 trillion and $2 trillion. These figures alone are striking, but the more consequential metric is the cost of servicing that debt. Annual interest payments have now reached $1 trillion per year, a figure that exceeds total U.S. military expenditure and represents a threshold that previous administrations warned would eventually arrive.
Looking forward, projections indicate that annual debt servicing costs could reach $2.5 to $2.6 trillion by 2034 to 2035, representing a near 160% increase within a single decade. That trajectory assumes relatively stable interest rates, which itself is a fragile assumption given current monetary policy pressures.
The historical arc of this deterioration is worth placing in context. In the early 1980s, economists and budget officials debated a U.S. debt-to-GDP ratio of approximately 40%, with some arguing it was already dangerously elevated. That ratio now exceeds 120%. David Stockman, who directed the Office of Management and Budget during the Reagan administration, publicly argued at the time that the U.S. needed to achieve a balanced budget immediately. His contemporaries considered the debt manageable. That moment, in retrospect, may have represented the last realistic window for a course correction that never came.
What has replaced fiscal discipline is a rolling refinancing model that functions less like sovereign debt management and more like a continuous credit rollover. New debt is issued to retire maturing obligations, with no meaningful reduction in principal. The critical distinction from private borrowing is that no external enforcement mechanism exists to impose consequences on a government that behaves this way. Credit rating agencies can issue warnings, but they cannot compel policy change. Markets can demand higher yields, but the Federal Reserve can suppress those yields through asset purchases. The feedback loops that would discipline a private borrower are structurally absent at the sovereign level.
The Dollar Index Illusion
A common misconception among retail investors is that a strong U.S. Dollar Index (DXY) signals genuine currency health. The DXY measures the dollar's value relative to a basket of other fiat currencies, many of which are themselves experiencing significant monetary debasement. Measuring the dollar against the euro, yen, and pound is, in effect, measuring one deteriorating asset against other deteriorating assets.
The more meaningful measure is real-world purchasing power — the actual quantity of goods, services, and assets that a dollar can acquire over time. By this measure, the dollar's decline is not a future risk but a present reality, experienced directly through consumer prices, housing costs, and asset inflation.
| Metric | What It Measures | What It Obscures |
|---|---|---|
| U.S. Dollar Index (DXY) | Relative strength vs. peer currencies | Absolute purchasing power decline |
| CPI Inflation Rate | Consumer price basket changes | Asset price inflation, energy, food volatility |
| Nominal Interest Rates | Federal funds rate level | Real return after inflation adjustment |
| Real Interest Rates | Nominal rate minus CPI | Understated inflation distortions |
| Gold Price (USD) | Hard asset valuation in dollar terms | Currency debasement signal |
This distinction between nominal dollar strength and real purchasing power erosion is precisely why gold and silver amid US debt and war fears can remain structurally attractive even during periods when the DXY is rising. Furthermore, the precious metals market is not trading against other currencies; it is trading against the purchasing power of money itself. Understanding strategic gold investment principles helps clarify why this dynamic persists across economic cycles.
Geopolitical Conflict and the Counterintuitive Precious Metals Trade
Why War Initially Pressures Gold Prices
Conventional wisdom suggests that military conflict drives gold prices higher through safe-haven demand. The actual market dynamic is considerably more nuanced, and understanding it helps investors avoid reactive decision-making during periods of acute geopolitical stress.
When conflict escalates, speculative capital does not flow uniformly into precious metals. Instead, energy markets absorb the initial surge of risk-repositioning capital. Oil and natural gas prices spike as traders price in supply disruption risk and rotate out of gold and silver into commodity markets with more direct conflict exposure. This creates short-term inverse pressure on precious metals, even as the long-term macro case for hard assets strengthens.
The U.S.-Iran conflict demonstrated this pattern. An initial safe-haven bid into gold was followed by a rotation into the dollar and energy commodities, producing a temporary pullback in precious metals prices. Silver retreated from the $94/oz range to approximately $82/oz during the period of peak dollar strength associated with the conflict. According to Forbes, silver's price tumbled as much as 14% while gold fell around 7% amid inflationary fears and steady interest rates, illustrating just how sharp these war-related corrections can be.
The critical insight here is that war is not bearish for gold on any meaningful investment horizon. Military conflict accelerates fiscal deterioration through precisely the mechanisms that make gold essential: dramatically higher government expenditure, reduced tax revenue as economic activity contracts, expanded borrowing requirements, and monetary expansion to finance obligations that cannot be met through normal fiscal channels.
Protectionism as Economic Warfare
Beyond kinetic conflict, the formation of competing trade blocs, the imposition of tariffs and sanctions, and the restructuring of geopolitical alliances represent a form of economic warfare with structurally similar consequences. Protectionism imposes costs on economies, disrupts supply chains, and creates inflationary pressure through reduced trade efficiency.
The parallel to pre-war historical periods is analytically significant. The formation of trade blocs and alliance structures observed in global markets today mirrors dynamics that preceded both World War I and World War II. These patterns are not predictive of specific outcomes but do signal the kind of systemic fragmentation that has historically accelerated hard asset demand.
Multi-front geopolitical tensions spanning the Middle East, Eastern Europe, and the Pacific create compounding uncertainty that systematically benefits real asset allocation over paper asset exposure. Consequently, the ongoing global monetary shift is reinforcing these dynamics as nations diversify away from dollar-denominated reserves.
Gold and Silver Price Performance: Records, Corrections, and Forward Projections
Where Prices Stand and How They Got There
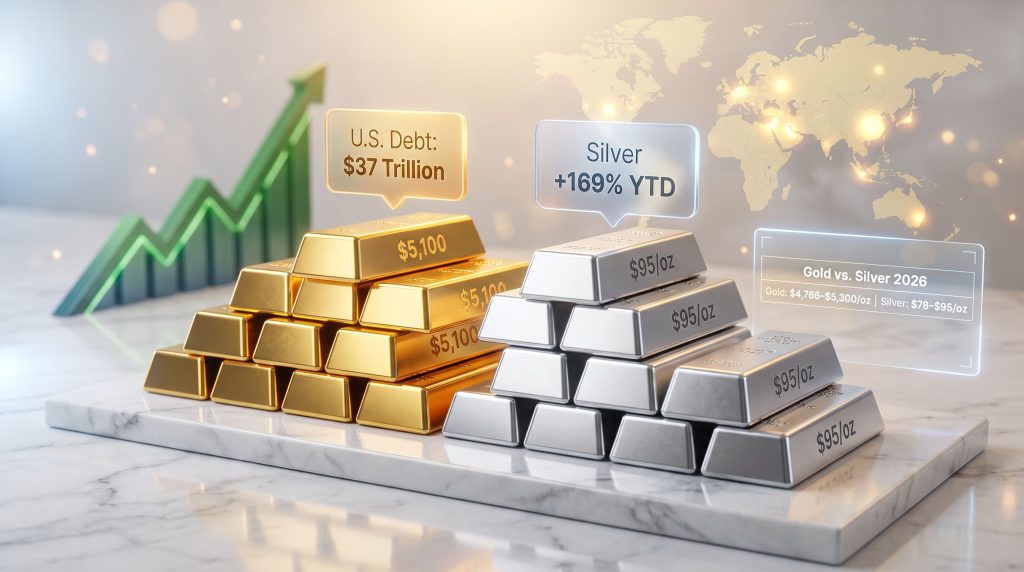
Gold surpassed $5,000/oz in 2026, briefly reaching $5,300/oz following the escalation of the U.S.-Iran conflict before stabilising in the $5,100 to $5,200/oz range. Earlier in 2026, gold established a record of $4,766/oz during the period of U.S.-EU trade tension escalation, demonstrating that both geopolitical conflict and trade fragmentation are functioning as price catalysts.
Silver's performance has been more dramatic in percentage terms. The metal has surged approximately 169% year-to-date, breaking through resistance levels at $78/oz and $95/oz, with analyst projections targeting $110/oz. The pullback from $94/oz to $82/oz reflects the war-related capital rotation described above, not a reversal of the underlying demand dynamics.
| Characteristic | Gold | Silver |
|---|---|---|
| 2026 Price Range | $4,766 to $5,300/oz | $78 to $95/oz (peak) |
| YTD Performance | Record highs | ~169% surge |
| Primary Driver | Fiscal and monetary debasement hedge | Industrial demand plus speculative flows |
| Volatility Profile | Lower, strategic hard asset | Higher, dual industrial and speculative role |
| Long-Term Function | Debt crisis hedge, reserve asset | Inflation hedge plus industrial exposure |
| Primary Downside Risk | Dollar strength, rising real rates | Dollar strength plus industrial demand slowdown |
Silver's Dual Nature: Higher Beta, Higher Volatility
Silver's 169% year-to-date surge is not simply a magnified version of gold's rally. It reflects the metal's unique position at the intersection of monetary and industrial demand. Silver's dual role as both a precious metal and an industrial commodity underpins this exceptional performance.
On the industrial side, silver is a critical input for solar panels, consumer electronics, and electric vehicles, creating a structural demand floor tied to long-term energy transition investment. On the monetary side, silver functions as an accessible inflation hedge and speculative vehicle for investors who find gold's per-ounce price prohibitive.
This dual demand structure amplifies both upside and downside price movements. Silver's total above-ground market is significantly smaller than gold's, meaning that equivalent capital flows produce proportionally larger price changes. During speculative bull phases, this dynamic generates the kind of outperformance that silver has delivered in 2026. During corrections driven by dollar strength or broad risk-off moves, the same dynamic produces sharper drawdowns.
For investors, silver represents a higher-beta precious metals position suited to those with higher risk tolerance, longer investment horizons, and the psychological capacity to hold through sharp corrections without abandoning the structural thesis.
The Federal Reserve's Policy Trap and What It Means for Hard Assets
Negative Real Rates: The Most Powerful Catalyst for Gold
Real interest rates, calculated as the nominal rate minus the actual inflation rate, are currently near zero or negative depending on which inflation measure is applied. This matters enormously for precious metals investors because negative real rates eliminate the opportunity cost of holding non-yielding assets like gold and silver.
When investors can hold a government bond and earn a real return that exceeds inflation, the case for holding gold weakens. However, when real rates are negative or near zero, bonds offer no real return advantage over gold, and gold's lack of counterparty risk becomes a decisive characteristic. The interplay of gold and bonds dynamics across economic cycles makes this relationship particularly important for portfolio construction.
The Federal Reserve's capacity to normalise real rates is severely constrained by the debt dynamics described above. Raising real rates significantly would:
- Dramatically increase the government's annual debt servicing costs, which are already at $1 trillion per year
- Destabilise the Treasury market by reducing the price of existing bonds
- Risk triggering a sovereign debt stress event by making refinancing costs unsustainable
- Suppress equity valuations by increasing the discount rate applied to future earnings
Market expectations of Fed rate cuts in August and December 2026 reflect an understanding that the central bank's room for real rate normalisation is structurally limited, not merely cyclically constrained.
The Push Comes to Shove Moment
The most significant near-term catalyst for precious metals is not a geopolitical event or an inflation print. It is the eventual simultaneous breakdown of two artificially supported markets: equities and government bonds.
Current policy is effectively holding equity markets at elevated valuations while suppressing bond yields to maintain government financing capacity. These two objectives are inherently in tension. When the equilibrium breaks, and historical precedent suggests it always does, capital will require a destination. Gold and silver amid US debt and war fears have historically been the primary beneficiaries of precisely this kind of simultaneous breakdown in paper asset confidence.
The Fed cannot simultaneously protect the bond market through low rates and defend the dollar's purchasing power through rate increases. This structural contradiction is the single most durable long-term driver of gold and silver appreciation.
Strategic Asset Allocation for a High-Debt, High-Conflict Environment
What a Macro-Aware Portfolio Prioritises
For investors navigating the current environment, the asset allocation implications of the structural dynamics described above point in a consistent direction. The following framework reflects the macro realities of elevated debt, negative real rates, and geopolitical fragmentation:
- Avoid long-duration paper assets: Long-term government bonds and insurance-linked fixed income products carry the highest exposure to inflation erosion and currency debasement over multi-year holding periods
- Prioritise real assets: Physical gold, silver, income-generating real estate, and commodity-linked equities provide inflation protection and store-of-value characteristics that paper assets cannot replicate in a debasing currency environment
- Energy sector exposure: Decades of policy-driven underinvestment in fossil fuel production, refining capacity, and petrochemical infrastructure have created structural supply deficits that are independent of short-term geopolitical events. Energy equities represent a compelling long-term inflation hedge
- Commodity equities broadly: Resource sector stocks, particularly major producers with established cash flows, offer leveraged exposure to commodity price appreciation with the additional benefit of income generation through dividends
The Underinvestment Legacy in Energy and Commodities
A less widely appreciated dynamic underpinning the commodity investment case is the multi-year supply gap created by regulatory and policy-driven restrictions on fossil fuel investment during the 2010s and early 2020s. Environmental policy headwinds reduced capital allocation to oil exploration, refining capacity expansion, lubricating oil production, and petrochemical manufacturing.
The consequence is a structural supply deficit that will take years to address through new investment, even if policy incentives improve immediately. Farmers dependent on diesel fuel and synthetic fertilisers face compounding input cost pressures. Industrial sectors relying on refined petroleum products face persistent supply constraints. These dynamics extend commodity inflation well beyond the energy market itself, creating a broad tailwind for commodity-linked assets.
The next major ASX story will hit our subscribers first
Empire Cycles, Reserve Currency Risk, and the Long View on the Dollar
Historical Monetary System Failures
Every major monetary system failure in recorded history has shared a common sequence: fiscal overextension funds military and administrative commitments, currency debasement follows as the primary mechanism for servicing obligations that cannot be met through taxation alone, and the resulting loss of monetary credibility accelerates the broader decline.
The Roman Empire progressively reduced the silver content of its denarius to fund legions it could no longer afford through taxation. The British Empire expanded its money supply through two world wars. The Ottoman Empire debased its coinage across centuries of fiscal stress. In each case, the monetary failure was not the cause of imperial decline but its most visible symptom.
The U.S. is exhibiting several of these structural indicators simultaneously:
- Record sovereign debt levels with no credible political path to reduction
- Expanding military commitments across multiple geopolitical theatres
- Currency purchasing power erosion experienced directly by consumers and businesses
- Political incapacity to address fiscal imbalances through either spending cuts or revenue increases
Managed Decline vs. Acute Crisis: The Timeline Question
A sudden hyperinflationary collapse requires a triggering event of sufficient magnitude to destroy confidence in the dollar rapidly. A protracted war, a Treasury market dislocation, or a coordinated move away from dollar-denominated reserves by major sovereign holders could serve this function.
The more probable near-term scenario is managed decline: gradual dollar depreciation, persistent above-target inflation, and slow but accelerating erosion of reserve currency dominance as central banks globally continue to diversify into gold. This process is already underway, with central bank gold reserves representing the largest institutional buying trend across multiple consecutive years. In addition, data from SD Bullion indicates that bullish central bank buying forecasts are underpinned by geopolitical motivations, further reinforcing the structural demand case.
A 100-year timeline for sustained dollar dominance appears increasingly difficult to defend on current fiscal trajectories. A 10 to 30 year window for significant structural change in the global monetary order represents a more analytically defensible range, and gold's role as a non-sovereign store of value positions it as the primary beneficiary of any reduction in dollar reserve status.
The Catalyst Sequence: What Could Drive the Next Major Rally
For investors monitoring precious metals markets, the following sequence of events represents the most likely pathway to a renewed and potentially accelerating bull phase:
- Resolution or de-escalation of the U.S.-Iran conflict removes war-related dollar strength and triggers rotation of speculative capital from energy back into precious metals
- Federal Reserve rate cut signals reduce real yields further, eliminating residual opportunity cost of holding gold and silver
- Equity market correction as overvalued stocks reprice to reflect genuine economic conditions, driving capital into non-correlated assets
- Bond market stress event where rising yields threaten debt sustainability, causing gold to emerge as the primary alternative reserve asset
- Acceleration of global de-dollarisation as sovereign holders reduce Treasury exposure, creating structural demand for gold as a neutral reserve asset
Frequently Asked Questions: Gold and Silver Amid U.S. Debt and War Fears
What is driving gold and silver prices higher in 2026?
The primary drivers are U.S. fiscal deterioration, with national debt exceeding $37 trillion and annual debt servicing costs at $1 trillion, combined with geopolitical conflict escalation and Federal Reserve monetary policy that maintains near-zero or negative real interest rates. These factors collectively erode confidence in fiat currency and government bonds, redirecting institutional and retail capital into hard assets.
Why did gold and silver prices fall when the U.S.-Iran conflict escalated?
Military conflict initially strengthened the U.S. dollar as a safe-haven currency and triggered capital rotation into energy commodities, creating short-term selling pressure on precious metals. This is a well-documented market dynamic where speculative capital moves into oil and natural gas during conflict escalation before eventually rotating back into gold and silver as the fiscal consequences of prolonged conflict become apparent.
Is silver a better investment than gold right now?
Silver offers higher return potential in bull markets due to its smaller market size and dual industrial and monetary demand structure, but it also carries significantly higher volatility. Gold provides more stable, long-term wealth preservation characteristics. A balanced approach holding both metals captures upside exposure whilst managing downside risk across different market environments.
What price levels are analysts projecting for gold and silver?
Gold has already surpassed $5,000/oz, with prices stabilising near $5,100 to $5,200/oz. Silver has broken through $95/oz, with analyst projections targeting $110/oz. These projections are contingent on continued fiscal deterioration, sustained low real interest rates, and the absence of a significant deflationary shock. All price projections involve uncertainty and should not be treated as guaranteed outcomes.
How does U.S. debt affect gold prices?
As U.S. debt grows, the government's capacity to service obligations without monetary expansion diminishes. This creates well-founded expectations of currency debasement — the erosion of dollar purchasing power through money creation — which historically drives investors toward gold and silver amid US debt and war fears as stores of value immune to government monetary policy decisions.
This article contains forward-looking analysis and macroeconomic commentary. It is intended for informational and educational purposes only and does not constitute financial advice. All price forecasts and economic projections involve inherent uncertainty. Readers should conduct independent research and consult a licensed financial adviser before making investment decisions. Past performance of any asset class is not indicative of future results.
Want to Know When the Next Major ASX Mineral Discovery Hits the Market?
While gold and silver navigate record highs driven by fiscal deterioration and geopolitical fracture, Discovery Alert's proprietary Discovery IQ model scans ASX announcements in real time, instantly identifying significant mineral discoveries and turning complex data into actionable investment insights — explore historic discovery returns to understand the magnitude of opportunity, then begin a 14-day free trial at Discovery Alert to position yourself ahead of the broader market.