July 14, 2026
The Valuation Paradox Hiding in Plain Sight Across Global Capital Markets
There is a quiet contradiction running through modern financial markets that rarely receives the analytical attention it deserves. The companies extracting the physical raw materials upon which the entire digital economy depends continue to trade at steep valuation discounts to the technology firms consuming those very materials. Nowhere is this paradox more visible than in the widening, and now narrowing, gap between Nvidia's extraordinary market capitalisation and the combined equity value of the world's fifty largest mining companies. The Nvidia slide narrows gap with world's biggest miners narrative has moved from a statistical footnote to a genuine signal worth examining through multiple investment lenses.
When big ASX news breaks, our subscribers know first
How Rapidly Nvidia's Valuation Has Compressed in 2026
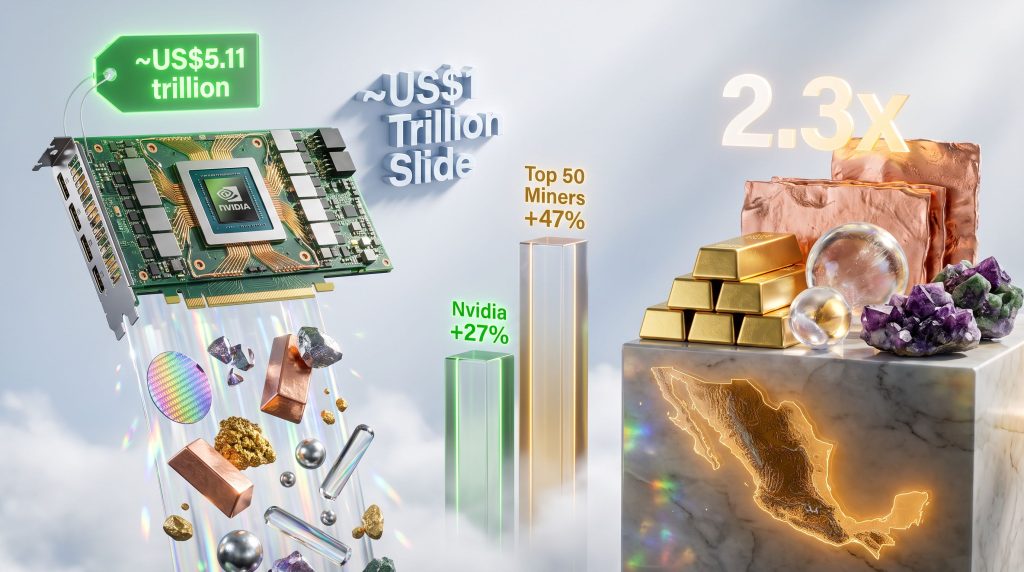
Nvidia's ascent to a peak market capitalisation of approximately US$5.5 trillion in mid-May 2026 was one of the most dramatic wealth creation events in equity market history. The company had become, in the eyes of global capital, the defining proxy for the artificial intelligence economy. Yet within roughly eight weeks of that peak, approximately US$1 trillion in market value had been erased, pulling the company's capitalisation back to around US$5.11 trillion as of mid-July 2026.
What makes this correction analytically significant is not the absolute dollar figure lost, substantial as that is, but what it reveals about how markets price technological ambition versus physical resource production. Twelve months ago, Nvidia's valuation sat at approximately 2.7 times the combined market capitalisation of the MINING.COM TOP 50 largest mining companies. That multiple has since compressed to approximately 2.3 times, with several trading sessions in July 2026 pushing the ratio closer to 2.0 — a threshold last approached when the emergence of the Chinese AI model DeepSeek briefly disrupted sentiment across the global AI trade.
Putting the Numbers in Comparative Context
| Metric | Nvidia (Mid-2026) | Top 50 Global Miners (Combined) |
|---|---|---|
| Peak Market Cap | ~US$5.5 trillion | ~US$2.4 trillion (March 2026 record) |
| Current Market Cap | ~US$5.11 trillion | ~US$2.19 trillion |
| Forward P/E Multiple | ~20x | ~13x |
| 12-Month Performance | +27% | +47% |
| Nvidia-to-Miners Ratio | 2.3x | N/A |
The forward price-to-earnings multiple is a useful lens for cross-sector comparison because it strips out one-time items and focuses markets on anticipated profitability. At Nvidia's correction low, the stock briefly traded below 18 times forward earnings, technically placing it below the S&P 500 broad market average and into what analysts characterise as value-stock territory for a company of its growth profile. The subsequent partial recovery brought that multiple back to approximately 20 times.
Mining's largest producers, by contrast, continue to trade at approximately 13 times next year's expected earnings, meaning they appeared cheaper than Nvidia even when Nvidia was at its most distressed valuation point during the correction. This persistent discount applied to resource companies is not an accident. It reflects deeply embedded assumptions about earnings predictability, capital requirements, and cyclical exposure that have structured institutional capital allocation for decades.
Why Mining Equities Trade at Structural Discounts Despite Strategic Importance
The question of why commodity-linked businesses trade at lower multiples than technology platforms has a clear technical answer, though the implications of that answer are becoming increasingly uncomfortable as critical minerals demand accelerates.
Three core structural forces suppress mining sector valuations relative to their strategic economic significance:
-
Commodity price volatility creates earnings unpredictability that equity markets penalise through lower price-to-earnings ratios. When a company's revenue is determined by a spot price it cannot control, institutional investors demand a discount as compensation for that uncertainty.
-
Capital intensity and extended development timelines depress return-on-equity metrics. The pathway from mineral discovery to commercial production typically spans 10 to 20 years, during which capital is deployed with no revenue offset. Asset-light technology businesses, which can scale software globally without proportional physical infrastructure investment, are structurally rewarded with higher multiples.
-
ESG-related capital constraints have progressively narrowed the pool of institutional capital willing to participate in certain categories of resource extraction, creating artificial supply limitations on mining equity ownership that further suppress valuations relative to fundamental value.
What is rarely discussed alongside these conventional suppression factors is a fourth dynamic: information asymmetry. The technology sector communicates future value through roadmaps, product launches, and subscription growth metrics that are intuitive to generalist investors. Mining communicates value through reserve grades, metallurgical recoveries, strip ratios, and resource classifications that require specialised knowledge to interpret. This knowledge gap systematically disadvantages mining equities in the competition for retail and institutional capital.
The fundamental tension in modern markets is that governments are treating critical mineral access as a national security priority while equity markets continue to price miners as cyclical commodities businesses. This divergence cannot persist indefinitely as supply constraints tighten against accelerating demand.
The Mineral Backbone of Every Nvidia Chip Sold
More Than 15 Commodities Inside a Single GPU
The strategic case for resource equities becomes considerably more concrete when examined through the lens of what Nvidia's hardware actually requires at a materials level. Each GPU produced by Nvidia embeds demand across a surprisingly extensive range of mineral commodities:
- Silicon serves as the foundational semiconductor substrate upon which all chip architecture is built
- Copper is indispensable for electrical interconnects, printed circuit board traces, and thermal management pathways — furthermore, copper market trends suggest supply constraints will intensify as AI infrastructure buildout accelerates
- Gold and silver appear in bonding wires, conductive coatings, and contact surfaces where reliability cannot be compromised
- Rare earth elements, particularly praseodymium, are embedded in the powerful permanent magnets used in cooling fans and power delivery systems
- Tungsten and tantalum provide precision components and capacitor dielectrics that manage heat and electrical stability at nanoscale geometries
- Cobalt and nickel feature across packaging materials, thermal interface layers, and battery systems in supporting infrastructure
- Gallium and germanium are compound semiconductor inputs critical for certain device layers, sourced from a highly geographically concentrated global supply base
- Palladium and tin are consumed in soldering processes and catalytic applications throughout chip fabrication
The resource sector's enduring observation holds with particular force here: if it cannot be grown, it must be mined. Every Nvidia GPU sold represents demand across more than fifteen distinct mineral commodities, many of which face supply concentration risks that no amount of software engineering can resolve.
The Gallium and Germanium Supply Concentration Risk
Among the mineral inputs listed above, gallium and germanium deserve particular attention from investors tracking AI infrastructure demand. Both elements are compound semiconductor precursors with no readily available substitutes in their primary applications. Gallium's critical mineral status is well established, with global production heavily concentrated geographically across a small number of producing nations. Export restrictions on these materials, implemented in various forms in recent years, represent a direct supply chain vulnerability for the semiconductor industry that equity markets have been slow to price into upstream mining valuations.
The First Annual Reversal: Mining Outperforms Nvidia Over Twelve Months
Breaking Down the 47% vs 27% Performance Gap
One of the most consequential data points embedded in the current valuation discussion is the 12-month performance comparison between global mining equities and Nvidia. The top 50 global miners collectively gained 47% over the twelve months to mid-2026, meaningfully outpacing Nvidia's 27% gain across the same period. According to data compiled by MINING.COM, this marks the first time the mining sector benchmark has outperformed Nvidia across an annual measurement period since the comparison methodology was established.
The drivers of mining's outperformance were not uniform across the sector:
- Gold price appreciation carried the most significant weight, propelling the TOP 50 aggregate to a record US$2.4 trillion in combined market capitalisation at the end of March 2026
- Critical minerals repricing, driven by intensifying geopolitical supply concerns particularly around gallium, germanium, and rare earth supply chains, contributed additional tailwinds
- Base metals, led by copper's structural demand story connected to electrification and AI data centre power infrastructure, provided further support across major diversified producers
Gold's Retreat and the Q2 2026 Pullback
The sector's record March peak did not hold through the second quarter. Gold's decline from above US$4,000 per ounce erased approximately US$228 billion in combined TOP 50 market capitalisation during Q2 2026, illustrating the degree to which gold price sensitivity continues to dominate aggregate mining sector valuations.
Gold-focused producers represent a disproportionate share of the TOP 50's total market weight, meaning that precious metals price movements create outsized swings in the sector headline figure that can obscure more stable trends in base metals and critical minerals subsectors. Investors distinguishing between gold-weighted and diversified mining exposure within the TOP 50 universe will consequently find considerably different volatility profiles beneath the aggregate number.
Mexico's Strategic Position in the North American Critical Minerals Architecture
A Geography That Matters More Than Most Investors Realise
While the Nvidia slide narrows gap with world's biggest miners debate plays out at a macro level, one of the most operationally significant developments shaping critical mineral supply chains is occurring in Mexico — a jurisdiction that occupies a unique position in the global resource landscape that its equity market profile does not yet fully reflect.
Mexico produces 12 of the 60 minerals classified as critical by the U.S. Geological Survey, a list that maps closely onto the materials required for advanced semiconductor manufacturing, electromobility, and defence-adjacent technologies. The country holds a 25% share of global silver production, making it the world's leading silver-producing nation according to CAMIMEX data. In addition, silver's dual industrial role in photovoltaics, electronics, and medical devices means Mexico's production base sits squarely within the critical materials supply chain for multiple high-growth technology end markets.
The Mexico-U.S. Bilateral Action Plan: What It Actually Covers
On February 4, 2026, Mexico and the United States formalised a bilateral Action Plan on Critical Minerals designed to integrate Mexican mineral production into North American supply chains serving electromobility and advanced manufacturing sectors. The framework reflects a recognition at the national policy level that geographic proximity, existing trade infrastructure under the USMCA, and Mexico's established mining industry combine to make the country a logical supplier to U.S. industrial demand.
Mexico's Economy Ministry has publicly identified 13 critical minerals the country currently lacks or produces in insufficient volumes to meet domestic and export demand targets, and has initiated international access negotiations to secure supply. Mexico's 2026 pro tempore presidency of the Pacific Alliance provides an additional diplomatic platform for advancing mineral trade frameworks at multilateral forums, including the World Trade Organization ministerial conference.
The Investment and Employment Case for a National Critical Minerals Strategy
CAMIMEX, the national mining industry association, has quantified the potential economic upside from a fully implemented critical minerals strategy in terms that extend well beyond the mining sector itself:
| Indicator | CAMIMEX Projection |
|---|---|
| Potential investment attracted by 2030 | ~US$43 billion |
| Estimated direct and indirect jobs created | ~500,000 positions |
| Current global silver production share | 25% (world leader) |
| Critical minerals produced (of 60 USGS-classified) | 12 minerals |
Karen Flores, Director General of CAMIMEX, has articulated this strategic reality in terms that reframe how mineral production fits within a broader conception of national economic power. According to Flores, in the contemporary global environment, the ability to access and supply raw materials has become as consequential a source of national and economic power as technological sophistication itself. This perspective aligns with the broader shift in how energy transition minerals are being reconsidered at a governmental level worldwide.
The next major ASX story will hit our subscribers first
The Asymmetric Opportunity in Resource Equity Valuations
When Policy Value and Market Value Diverge
The divergence between how governments value critical mineral access and how equity markets price mining companies creates a set of conditions that investors with a longer-term orientation have historically found attractive. Governments across North America, Europe, and the Asia-Pacific have moved to treat critical mineral supply chains as national security infrastructure, yet equity markets continue to apply the same cyclical commodity discount to mining businesses that they have used for decades.
This divergence can close through several mechanisms:
- Offtake agreements and government-backed financing provide revenue certainty that reduces the earnings volatility historically used to justify lower mining P/E multiples
- Strategic reserve programmes create a demand floor for certain commodities that partially insulates producers from pure spot market exposure
- Equity market re-rating as generalist investors absorb the strategic narrative and begin pricing miners less like cyclical businesses and more like infrastructure providers to the digital economy
Hypothetical Scenario: AI Data Centre Demand Doubles by 2030
If global AI data centre capacity were to double by 2030, as some industry projections suggest is plausible under current investment trajectories, the downstream mineral demand implications would be considerable. Copper, given its role in power transmission infrastructure, data centre cabling, and cooling systems, faces some of the tightest potential supply constraints under an accelerated AI buildout scenario. Gallium and germanium, given their supply concentration and limited substitutability, represent acute vulnerability points.
Mining companies with reserve exposure to these specific commodities, combined with near-term production catalysts and jurisdictional stability, represent the category most likely to see valuation re-rating if supply scarcity becomes acute relative to technology sector demand. However, as this analysis of Nvidia's market position relative to the entire mining sector illustrates, the valuation gap — while narrowing — remains historically wide.
Disclaimer: The scenario analysis and forward-looking projections contained in this article are illustrative and speculative in nature. They are not intended as financial advice. Past performance of mining equities or technology stocks is not indicative of future results. Readers should conduct their own due diligence and consult qualified financial advisers before making investment decisions.
Frequently Asked Questions
Why is Nvidia worth more than all the world's top mining companies combined?
Nvidia's valuation reflects equity market pricing of anticipated AI-driven earnings growth, which commands significantly higher forward P/E multiples than the commodity-linked, capital-intensive earnings profiles that characterise mining businesses. As of mid-2026, Nvidia's market capitalisation of approximately US$5.11 trillion compares to a combined US$2.19 trillion for the top 50 global miners.
What minerals are required to manufacture Nvidia's GPUs?
Nvidia's hardware requires more than 15 distinct mineral inputs across its production and packaging processes, including silicon, copper, gold, silver, cobalt, nickel, tungsten, tantalum, gallium, germanium, palladium, tin, titanium, aluminium, and rare earth elements including praseodymium.
Has the mining sector ever outperformed Nvidia on a 12-month basis?
Over the twelve months to mid-2026, the top 50 global miners collectively gained 47% versus Nvidia's 27%, marking the first such annual reversal recorded under the established MINING.COM comparison framework. Furthermore, recent market data confirms that the Nvidia slide narrows gap with world's biggest miners to its closest point in over a year.
What is Mexico's role in global critical mineral supply chains?
Mexico produces 12 of the 60 U.S. Geological Survey-designated critical minerals and leads global silver production with a 25% market share. A bilateral action plan with the United States, announced in February 2026, aims to integrate Mexican production into North American advanced manufacturing supply chains.
How much investment could Mexico's critical minerals sector realistically attract?
CAMIMEX estimates that a comprehensive national critical minerals policy could generate approximately US$43 billion in investment and create around 500,000 jobs by 2030.
Key Takeaways From the Nvidia-Mining Valuation Analysis
- Nvidia's approximately US$1 trillion market value loss since mid-May 2026 has compressed its valuation premium over the top 50 global miners from 2.7 times to 2.3 times, with intraday sessions approaching 2.0 times
- Mining's collective 12-month gain of 47% has outpaced Nvidia's 27% for the first time under established comparison methodology, driven primarily by gold price appreciation and critical minerals repricing
- Each Nvidia GPU embeds demand across more than 15 mineral commodities, creating a structural dependency that equity markets have not yet translated into upstream resource valuations
- Mining companies trade at approximately 13 times forward earnings, a persistent discount that reflects commodity volatility, capital intensity, and ESG-related constraints rather than diminishing strategic relevance
- Mexico's positioning as a top-12 critical minerals producer and global silver leader places it at a significant juncture in the reconfiguration of North American supply chains
- The divergence between governments treating mineral access as a national security priority and equity markets pricing miners as cyclical businesses creates conditions that may favour resource equity re-rating as supply constraints against AI-driven demand become more acute
The central tension animating this entire discussion is straightforward but consequential. Technology companies are valued for the futures they are promising to build, while mining companies are priced against the commodity cycles of the past, despite being the indispensable physical foundation upon which those technological futures depend. As AI infrastructure investment accelerates and critical mineral supply chains tighten, the structural conditions for a sustained reassessment of how resource businesses are valued appear to be gradually strengthening.
Want to Know When the Next Major ASX Mineral Discovery Hits the Market?
Discovery Alert's proprietary Discovery IQ model delivers real-time alerts on significant ASX mineral discoveries — instantly converting complex resource data into actionable investment insights across the very commodities powering the AI economy, from copper and gallium to rare earths. Explore historic discoveries and the returns they generated, then begin your 14-day free trial at Discovery Alert to position yourself ahead of the broader market.