July 14, 2026
Why Industrial Commodities Are Taking the Wheel in 2026
Commodity bull markets rarely run in a straight line. History shows they tend to move in phases, where a narrow group of assets leads the initial charge before broader participation gradually draws in sectors that lagged during the early stages. That pattern is playing out with unusual clarity right now. After a period defined by the dominance of precious metals, the resource landscape entering the second half of 2026 looks meaningfully different, and investors who continue to position exclusively around gold and silver may find themselves chasing yesterday's trade.
Understanding this rotation, and more importantly, knowing how to build a resource investing strategy in precious metals and industrial commodities that capitalises on it, is what separates reactive investors from those generating consistent, cycle-aware returns.
When big ASX news breaks, our subscribers know first
The Macro Architecture Supporting the Commodity Supercycle
Before evaluating individual sectors, it helps to understand the structural forces that underpin the broader commodity cycle. Several converging dynamics remain firmly in place heading into H2 2026.
Global manufacturing indices, specifically the Purchasing Managers Indexes tracked across the US, China, and most major economies, have reached their strongest collective readings since the post-pandemic recovery of 2020. Historically, when PMI data simultaneously strengthens across these geographies, industrial commodity demand accelerates with a lag of several quarters. That acceleration appears to be underway now.
Fiscal conditions in major economies continue to be expansionary. Despite political pressure to rein in deficits, the practical reality is that government spending at scale continues to inject liquidity into the financial system, underpinning hard asset valuations. China, notably, has paused its most aggressive stimulus efforts over the past three months, a development worth monitoring, though it has not derailed the broader trend.
Perhaps the most structurally significant driver is the artificial intelligence infrastructure buildout. The copper supply crunch requirements alone for data centres, EV charging networks, and grid modernisation programs are staggering relative to current global production capacity. Given that the timeline from mineral discovery to copper production typically spans ten to fifteen years, the supply response to this demand surge cannot arrive quickly. Near-term deficits are, in practical terms, already locked in.
"The combination of strong PMI readings, sustained fiscal expansion, and structurally insufficient commodity supply creates conditions that have historically preceded multi-quarter outperformance in base metals and energy sectors."
How Resource Portfolios Performed in the First Half of 2026
The Headline Numbers
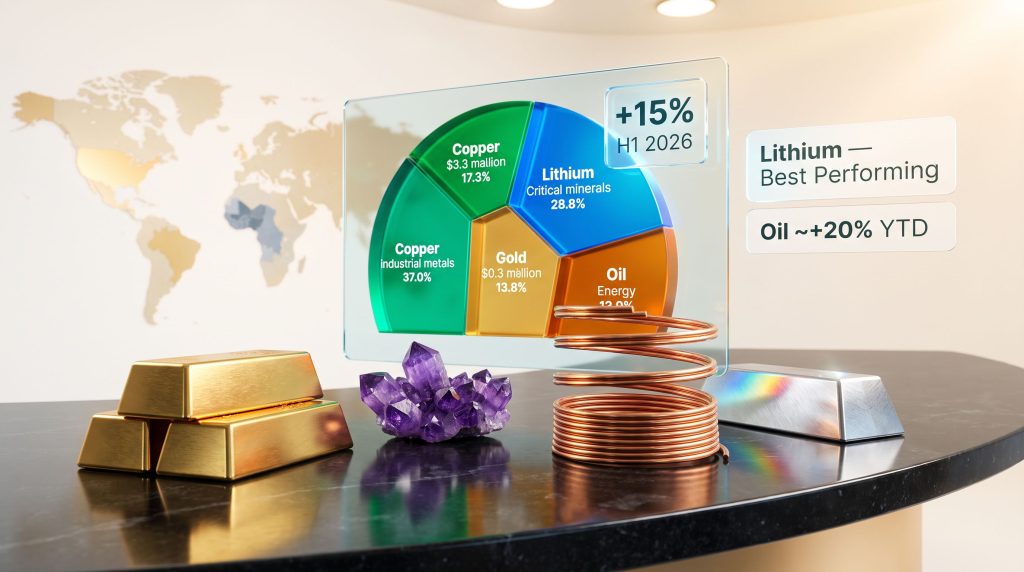
June 2026 was a negative month for broad resource markets, yet well-managed diversified resource funds still delivered approximately +15% returns for the first half of the year. When buyback activity is factored in, some strategies exceeded that threshold. It is worth noting that merger and acquisition activity, including company takeouts, contributed meaningfully to some fund performances, though this is not a repeatable or systematic source of returns that investors should build a strategy around.
Commodity Performance Breakdown: H1 2026
The divergence between commodity groups in the first half of 2026 was stark. The table below captures the key performance dynamics.
| Commodity | H1 2026 Performance | Primary Driver | Investor Takeaway |
|---|---|---|---|
| Lithium | Best-performing major commodity | Two to three years of underinvestment and supply correction | Contrarian recovery with structural tailwinds |
| Oil / Energy | ~+20% YTD despite correction from >$100 to ~$70 | Geopolitical risk premium and supply chain disruption | Second-best performer; still constructive |
| Copper | Positive performer | AI infrastructure demand; electrification buildout | Structural deficit story intact |
| Gold | Consolidation phase | Central bank selling pressure; post-2025 fatigue | Underlying momentum intact; short-term headwinds |
| Silver | Underperformer vs. 2025 | Consolidation after prior-year outperformance | Watch gold/silver ratio above 80 for relative value signal |
| PGMs | Worst-performing major group | Demand softness; mean reversion after 2024-2025 run | Monitor for contrarian entry signals |
The lithium market downturn leadership position is particularly noteworthy. After suffering through two to three years of severe underinvestment and a prolonged price correction, the supply side contracted sharply enough that any demand recovery amplified upward price movement. This is the classic commodity cycle mechanism, and lithium appears to be in its early recovery phase.
Oil's resilience is equally instructive. Despite a significant intra-period correction from above $100 per barrel to approximately $70, energy remained approximately 20% above its January 2026 starting price, making it the second-best performing commodity for the half year.
Building a Resource Investing Strategy in Precious Metals and Industrial Commodities
Allocating by Portfolio Function, Not Just Price Behaviour
A robust resource investing strategy in precious metals and industrial commodities does not treat all metals as interchangeable. Each commodity serves a distinct portfolio role, and allocations should reflect those functional differences.
- Wealth preservation layer: Physical gold and gold-backed instruments serve as a core strategic hedge against currency debasement and systemic financial stress
- Growth and inflation optionality: Silver and critical materials offer higher-beta exposure to monetary and industrial themes simultaneously
- Industrial leverage layer: Copper, lithium, aluminum, and uranium provide exposure to structural secular demand themes including electrification, AI infrastructure, and energy security
Suggested Allocation Framework
| Asset Class | Portfolio Role | Suggested Allocation | Key Risk Factors |
|---|---|---|---|
| Physical Gold / Gold ETFs | Inflation hedge; currency devaluation protection | 5-10% (up to 15% for aggressive mandates) | Interest rate sensitivity; USD strength |
| Silver | High-beta monetary and industrial hybrid | 3-5% | Industrial demand cycles; gold/silver ratio |
| Copper and Industrial Metals | Economic growth proxy | 15-20% (aggressive mandates) | China PMI trajectory; AI-driven supply deficit |
| Lithium and Critical Minerals | Green energy and electrification exposure | 3-5% in equities | Battery technology shifts; policy environment |
| Uranium | Power security; AI energy demand | Tactical allocation | Regulatory timelines; nuclear policy developments |
| Oil and Gas | Energy security; supply chain leverage | Tactical allocation | Geopolitical risk; inventory cycles |
Conservative investors may cap total commodities exposure at 5-10%. Aggressive mandates with high risk tolerance targeting industrial leverage may extend to 15-20% of the total portfolio.
Investment Vehicles: From Physical Bullion to Mining Equities
Physical Bullion: The Foundation Layer
Direct ownership of gold or silver bars and coins eliminates counterparty risk entirely and provides true insurance against systemic financial stress. Physical bullion is best suited to long-term wealth preservation mandates and typically functions as the foundation of the metals sleeve, representing roughly 10-20% of that allocation.
ETFs: Accessible Market Exposure
Exchange-traded funds backed by physical metals or mining company baskets offer the price exposure of the commodity without the storage and custody costs of physical ownership. Gold ETFs, silver ETFs, and copper miner ETFs provide liquid, low-friction access suitable for investors prioritising accessibility and portfolio rebalancing flexibility. Furthermore, for a broader view of precious metals investment strategies, diversified ETF exposure remains one of the most accessible entry points for new and experienced investors alike.
Mining Equities: Where Alpha Is Actually Generated
"The performance edge in resource investing does not come primarily from riding commodity price momentum. It comes from identifying company-specific catalysts that can rerate a stock's valuation independently of the underlying commodity price."
This is a critical and often underappreciated distinction. During the first half of 2026, some of the strongest stock-level returns in resource portfolios came from precious metals equities, even though gold and silver were among the worst-performing commodities in that period. The reason is simple: individual companies with near-term catalysts outperformed their commodity benchmarks by generating their own rerating events.
Three tiers of mining equity exposure offer different risk and return characteristics:
- Senior producers such as major gold miners: Cash flow generation, dividend capacity, lower operational risk, steady institutional ownership
- Royalty and streaming companies: Capital-light models with exposure to commodity upside without direct operational execution risk
- Junior developers and explorers: High-risk, high-reward positions that require deep due diligence, are catalyst-dependent, and should represent a smaller portion of the overall resource portfolio
Advanced Income Strategy: Options on Commodity ETFs
Experienced investors with clearly defined risk parameters can sell cash-secured put options on commodity ETFs such as GLD or SLV. This generates premium income while creating a pathway to acquire positions at a lower effective cost basis. This strategy is not appropriate for all investors and requires a solid understanding of options mechanics and position sizing.
How Professional Resource Investors Select Stocks That Outperform
The Catalyst-First Investment Framework
The most repeatable source of outperformance in resource equities is identifying companies with near-term, tangible catalysts that the broader market has not yet priced in. This approach works across market environments, including ones where commodity prices are flat or declining.
Key catalyst categories that can rerate valuations:
- Resource estimate updates: New or materially expanded resource calculations that increase a project's economic scale
- Preliminary Economic Assessments and feasibility studies: Technical milestones that de-risk projects and attract institutional capital
- Organic production growth: Volume ramp-ups the market has underestimated relative to current valuations
- Permitting milestones: Regulatory approvals in stable jurisdictions that remove a key uncertainty premium from valuations
- M&A and takeout potential: Strategic positioning in asset classes or geographies attracting consolidation activity
A producer with funded growth from 200,000 ounces toward 400,000 or more ounces of annual gold production represents a potential rerating event capable of delivering meaningful returns even if the gold price stays completely flat. The embedded growth, not the commodity price, is the value driver in this scenario.
The Uncatalyzed Value Trap
Many resource stocks trade at significant discounts to their intrinsic value. But without a catalyst to close the gap, they can remain cheap indefinitely. Before committing capital, every resource investor should answer two questions with clarity:
- Why is this asset undervalued? Is it jurisdiction risk, management credibility issues, asset quality concerns, or simply a lack of market awareness?
- What specific event or development will close the valuation gap within a defined timeframe?
Common catalysts that have historically unlocked value in resource stocks:
- Maiden resource announcements establishing previously unquantified asset scale
- Updated feasibility studies with improved economic parameters
- Permitting approvals in transparent, mining-friendly regulatory environments
- Strategic transactions, offtake agreements, or joint ventures with credible counterparties
The next major ASX story will hit our subscribers first
Jurisdiction Risk: Geography as a Core Investment Variable
The West Africa Capital Exodus
Political instability in Mali and Burkina Faso has materially elevated operational and sovereign risk across the Sahel region. More concerning is that Ghana, historically one of Africa's most reliable and transparent mining jurisdictions, has recently seen regulatory friction that is causing institutional investors to reassess their West African exposure more broadly.
When comparable assets in stable jurisdictions trade at similar valuations to West African projects, there is no rational risk-adjusted basis for accepting the additional sovereign and political risk. Capital flows reflect this logic, and it is increasingly visible in how developers and juniors with Americas-focused asset bases are being valued relative to their West African peers.
"When evaluating two comparable mining assets, the one located in a stable, mining-friendly jurisdiction with transparent regulatory frameworks should command a meaningful valuation premium, regardless of how attractive the headline economics appear in higher-risk regions."
Where Capital Is Flowing: The Americas Premium
North American mining trends are attracting disproportionate investor interest as West African risk premiums expand. The jurisdictional premium is not merely theoretical; it is observable in transaction multiples, analyst coverage depth, and institutional portfolio construction. This trend creates a practical opportunity for investors who can identify quality developers in stable Americas jurisdictions before that premium is fully reflected in valuations.
Key Macro Themes Shaping the Second Half of 2026
Energy: Structural Tailwinds Beneath the Volatility
Energy markets remain constructive despite significant intra-period price swings. Supply chains disrupted by geopolitical events will require rebuilding and inventory restocking, creating a demand tailwind that supports prices. Oil remains approximately 20% above its January 2026 level despite a correction from above $100 to approximately $70 per barrel.
Uranium: Seasonal Dynamics and Structural Power Demand
The second half of the year historically exhibits positive seasonality for uranium equities. More importantly, uranium investment strategies continue to strengthen, driven by grid-scale energy security requirements and the baseload power demands of AI data centre expansion. Nuclear is increasingly positioned as a critical, non-negotiable component of long-term electricity supply in major economies.
Copper: The AI Infrastructure Deficit
Current global copper production is structurally insufficient to meet projected AI infrastructure requirements. Data centres, EV charging networks, and grid modernisation programs are all heavily copper-intensive. With development timelines spanning a decade or more from discovery to production, meaningful new supply cannot arrive quickly enough to prevent near-term deficits from deepening.
Gold and Precious Metals: A More Sustainable Base
Central bank selling activity, including notable European sovereign gold repositioning in early 2026, created temporary headwinds for the gold price. These selling events are generally assessed as transient. Central banks that sold at elevated prices are likely to rebuild reserves at lower levels, and China's structural accumulation trend remains intact as a long-term demand driver. The froth from the 2024-2025 precious metals rally has been removed, creating a healthier and more sustainable base for the next advance.
Risk Management Principles for Resource Portfolios
Dollar-Cost Averaging and Seasonal Awareness
Accumulating positions gradually during price consolidations is more reliable than attempting to time market bottoms precisely. Seasonal patterns in resource equities are well documented: Q1, Q2, and late Q4 tend to be stronger periods for precious metals specifically. August through early September often presents tactical buying opportunities as catalysts build ahead of a more active autumn period.
Position Sizing and Profit-Taking Discipline
- Trim positions quarterly when they exceed target allocations by more than 10%
- Consider taking partial profits, approximately 25% of a position, after gains of 50-100% to protect capital and reduce concentration risk
- Maintain above-average cash reserves during periods of elevated uncertainty to preserve optionality for deployment at better entry levels
Evaluating Exploration-Stage Companies
Exploration-stage companies should represent a smaller, carefully sized portion of the overall resource portfolio. Selection criteria should emphasise:
- Management teams with articulate and credible geological models
- Clear program execution plans with defined milestones
- Demonstrated ability to process technical data and adjust targeting accordingly
- Geological models built by experienced, sophisticated technical teams
Geological risk is inherent in exploration and cannot be eliminated. Management quality, program discipline, and the rigour of the underlying geological model are the primary differentiating factors between exploration investments that generate returns and those that do not.
Frequently Asked Questions: Resource Investing in Precious Metals and Industrial Commodities
What Percentage of a Portfolio Should Go Into Precious Metals and Industrial Commodities?
Conservative investors typically allocate 5-10% to gold as a core hedge, with an additional 3-5% to silver and critical materials. Aggressive mandates may extend total resource exposure to 15-20%, with heavier weighting toward industrial metals, uranium, and energy.
Is Physical Gold or Gold Mining Stocks the Better Choice?
Physical gold provides pure price exposure with zero counterparty risk, best suited to wealth preservation. Mining stocks offer leverage to gold price movements and the potential for company-specific alpha through operational growth and catalyst events, but carry additional operational, management, and jurisdictional risks. According to Sprott's investor guide, understanding the distinction between these vehicles is foundational to constructing a well-balanced resource portfolio.
What Is the Gold/Silver Ratio and Why Does It Matter?
The gold-silver ratio analysis measures how many ounces of silver are required to purchase one ounce of gold. When this ratio exceeds 80, silver is historically cheap relative to gold. Reallocating new capital from gold to silver at these levels has historically improved risk-adjusted returns over subsequent periods.
What Makes a Junior Mining Company a Compelling Investment?
The most compelling junior mining investments combine a credible geological model with genuine resource growth potential, a management team with a track record of execution, and a near-term catalyst such as a resource update, feasibility study, or permitting milestone that the market has not yet fully priced in.
What Are the Biggest Risks in Resource Investing?
Key risks include commodity price volatility, jurisdictional and political risk particularly in emerging market mining regions, operational execution risk for producers and developers, currency exposure, and the risk of holding deeply discounted assets that lack a clear catalyst to close the valuation gap within a reasonable timeframe.
Key Takeaways for Building a Resilient Resource Portfolio
- Broaden beyond precious metals: The commodity bull market is maturing. Industrial metals, energy, and uranium are increasingly important alongside gold and silver for balanced resource exposure
- Lead with catalysts, not just commodity exposure: Superior returns in resource equities consistently come from identifying company-specific rerating events before the broader market recognises them
- Jurisdiction is as important as geology: Political and regulatory risk is a non-negotiable variable in project valuation. Stable Americas jurisdictions are commanding a growing and justified premium over higher-risk regions
- Hold strategic cash reserves: Seasonal patterns and market corrections create tactical entry opportunities. Maintaining dry powder is a genuine competitive advantage in a well-constructed resource investing strategy in precious metals and industrial commodities
- Diversify across the commodity spectrum: Gold for capital preservation, silver for growth optionality, copper and lithium for secular industrial demand themes, and uranium and energy for long-term power security exposure. For further context on how commodity markets behave across different asset classes, VanEck's natural resources research provides a useful institutional perspective.
This article is intended for informational and educational purposes only. It does not constitute financial advice or a recommendation to buy or sell any security or commodity. All investments involve risk, including the possible loss of principal. Commodity markets are subject to significant volatility, and past performance is not indicative of future results. Readers should seek independent financial advice tailored to their individual circumstances before making investment decisions.
Want to Identify the Next Major Mineral Discovery Before the Broader Market Does?
Discovery Alert's proprietary Discovery IQ model delivers real-time alerts on significant ASX mineral discoveries, instantly translating complex geological data into actionable investment insights — whether you're seeking short-term trading opportunities or long-term exposure to transformative resource finds. Explore historic discoveries and their exceptional returns, then begin your 14-day free trial to position yourself ahead of the next major market-moving announcement.