July 15, 2026
The Counterintuitive World of Precious Metals: When Inflation Hurts Gold
Most investors operate under a straightforward assumption: when inflation rises, gold rises with it. This mental model has been reinforced across decades of financial education, portfolio theory, and market commentary. Yet the reality playing out in mid-July 2026 tells a more complicated story, one where surging oil prices, geopolitical flashpoints, and shifting interest rate expectations are combining to produce an outcome that defies conventional wisdom. Understanding why gold slips as oil rally keeps inflation and rate outlook on investors' radar is not just a short-term trading exercise. It reveals fundamental truths about how monetary policy, commodity markets, and asset allocation interact in real time.
When big ASX news breaks, our subscribers know first
What the Precious Metals Market Looks Like Right Now
Spot gold climbed aggressively in the previous session, surging more than 2% to touch a high of $4,100.49 per ounce after U.S. Consumer Price Index data for June showed inflation had cooled more than markets anticipated, largely driven by a retreat in energy costs. That rally, however, proved short-lived.
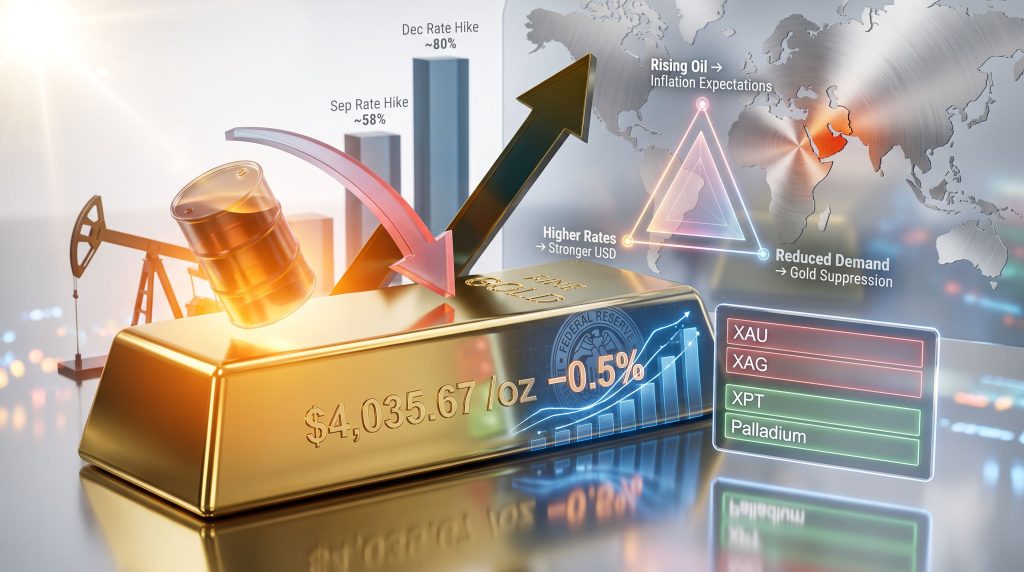
Within the next trading session, gold reversed course sharply. By early morning GMT on Wednesday, spot gold (XAU) had fallen 0.5% to approximately $4,035.67 per ounce, while U.S. gold futures for August delivery dropped 0.7% to around $4,042.20. The speed of the reversal underscored just how fragile sentiment had become across the broader precious metals complex.
The full picture across gold and silver markets as of mid-July 2026 reveals a nuanced divergence:
| Metal | Recent Price | Session Change |
|---|---|---|
| Spot Gold (XAU) | ~$4,035.67/oz | -0.5% |
| U.S. Gold Futures (Aug) | ~$4,042.20/oz | -0.7% |
| Spot Silver (XAG) | ~$58.48/oz | -0.3% |
| Platinum (XPT) | ~$1,635.56/oz | +0.2% |
| Palladium | ~$1,307.11/oz | +0.2% |
Silver tracked gold's weakness with a 0.3% decline to $58.48 per ounce, reflecting its strong correlation to gold sentiment in risk-off environments. Platinum and palladium, however, each gained 0.2%, a divergence that hints at differentiated industrial demand dynamics separating those metals from their monetary-store-of-value counterparts.
Why Oil Is the Real Story Behind Gold's Retreat
The catalyst behind gold's reversal is not found in Federal Reserve meeting minutes or economic data releases. It is found in the Strait of Hormuz.
Renewed geopolitical escalation in the Middle East saw U.S. President Donald Trump reinstate a naval blockade of Iranian ports, with additional threats directed at energy infrastructure including power plants and bridges, conditional on Tehran resuming negotiations. The result was a third consecutive session of crude oil price gains, a streak with significant downstream consequences for global financial markets. As Reuters reports, gold's slip coincided directly with dollar strength and oil market reaction to Trump's Iran ceasefire posture.
The Strait of Hormuz: A Chokepoint With Outsized Market Power
The Strait of Hormuz is one of the world's most strategically critical maritime corridors. Approximately 20% of global seaborne crude oil transits through this narrow waterway between Iran and Oman. Any credible disruption to shipping through this chokepoint creates an immediate supply premium in global energy markets.
When crude oil prices climb, the transmission mechanism through broader financial markets follows a relatively predictable sequence:
- Energy input costs rise across manufacturing, transport, and agriculture.
- Producer-level inflation pressures build, eventually flowing through to consumer prices.
- Market participants begin repricing their expectations for central bank policy.
- Fixed income yields move in anticipation of tighter monetary conditions.
- Non-yielding assets, particularly gold, face structural headwinds as yield-bearing alternatives become more attractive.
This chain reaction explains a dynamic that consistently confuses retail investors: oil-driven inflation can actually be bearish for gold in the short to medium term, precisely because it forces interest rate expectations higher.
The Gold-Rate-Dollar Triangle: A Framework Every Precious Metals Investor Should Understand
The transmission mechanism runs as follows:
Rising oil prices elevate inflation expectations, which push central banks toward higher-for-longer rate postures, which strengthen the U.S. dollar and lift Treasury yields, which reduce the relative attractiveness of non-yielding gold, ultimately suppressing its price even within an inflationary environment.
This framework helps explain why the widely held belief around gold's inflation hedge role requires significant qualification. It is not simply the presence of inflation that drives gold higher. It is the type of inflation and, critically, the policy response it triggers that determines gold's directional bias.
The CPI Report as a Lagging Indicator: What Forward-Looking Markets Are Actually Watching
June's CPI data initially gave gold bulls exactly what they wanted. Consumer inflation came in below expectations, with energy price softness playing a significant role in pulling the headline number lower. Gold's immediate 2% surge was a rational market response to data suggesting the Federal Reserve might have less justification for further tightening.
But seasoned market participants were quick to identify the flaw in that narrative. The CPI report is, by definition, backward-looking. It reflects price conditions from a prior month, not the inflationary pressures currently being seeded in commodity markets.
OANDA senior market analyst Kelvin Wong articulated this dynamic clearly, noting that markets appeared to be looking past the CPI data as a lagging indicator, with trader attention pivoting instead to the forward-looking inflationary signal embedded in sustained oil price strength driven by the ongoing Strait of Hormuz blockade situation. Furthermore, Stockhead notes that gold is falling right when it should be rallying, though the long-term case remains firmly intact.
This gap between backward-looking data and real-time commodity market signals is a critical concept for investors monitoring precious metals:
- Backward-looking: CPI, PPI, PCE data (reflects conditions from prior weeks or months)
- Real-time signals: Crude oil futures, energy spot markets, shipping insurance premiums
- Forward-looking: Fed funds futures, CME FedWatch probabilities, yield curve movements
When backward-looking data shows cooling inflation while real-time commodity signals show renewed price pressure building, markets tend to anchor to the more current signal. This is exactly the dynamic that reversed gold's CPI-driven gains almost immediately.
The Federal Reserve's Position and What Rate Markets Are Pricing
Federal Reserve officials responded to the June CPI data with cautious optimism. Senior policymakers acknowledged the welcome cooling in price pressures but emphasised that a single data point is insufficient to confirm that inflation is genuinely on a sustained downward trajectory. Additional confirmation is required before the Fed would feel confident adjusting its posture.
CME FedWatch Tool data as of mid-July 2026 shows how dramatically rate expectations shifted in the wake of the CPI release and subsequent oil price developments:
| Rate Decision Timeline | Market-Implied Probability |
|---|---|
| Rate hike at September Fed meeting | ~58% (down from ~76% pre-CPI report) |
| Rate hike priced in by December | ~80% |
The probability of a September rate hike fell meaningfully from 76% to approximately 58% following the softer CPI print. However, the December hike probability remains near 80%, reflecting the market's underlying conviction that the Fed's tightening cycle is not over, even if the pace may moderate.
This creates a challenging environment for gold. The metal benefits most when rate cut expectations are firm and the real yield environment is negative or falling. In the current scenario, rate cuts remain a distant prospect, and sustained oil prices risk reversing even the modest improvement in inflation conditions that the June CPI appeared to signal. Consequently, understanding gold and bond dynamics becomes essential for navigating this complex rate environment.
The Producer Price Index: The Next Potential Catalyst
The Producer Price Index release, scheduled for the same day as gold's reversal, carries particular significance in this environment. PPI measures inflation at the wholesale and factory gate level, providing an early warning signal for where consumer prices may move in the coming months.
Given that crude oil prices had already been climbing for three consecutive sessions at the time of the PPI release, any upside surprise in producer-level inflation data could meaningfully shift the rate hike probability calculations again, providing an additional headwind for gold.
Gold as an Inflation Hedge: The Long-Term Case Versus Short-Term Reality
The debate around gold's inflation-hedging properties is more nuanced than popular financial media typically allows. Historically, gold has demonstrated a strong capacity to preserve purchasing power over very long time horizons, measured in decades rather than quarters. Over shorter periods, however, its performance as an inflation hedge is considerably more inconsistent.
Several important distinctions matter here:
- Demand-pull inflation (where growth drives price increases) tends to be more supportive for gold, as it often coincides with currency depreciation concerns without necessarily forcing aggressive monetary tightening.
- Cost-push inflation (where supply shocks, particularly in energy, drive prices higher) is more problematic for gold, because it tends to force central banks into defensive rate hikes that directly undermine the metal's appeal.
- Stagflation scenarios can be genuinely supportive for gold, but only when rate expectations remain anchored or when central banks are perceived as falling behind the inflation curve.
The current environment leans toward cost-push dynamics, with an oil supply shock driven by geopolitical disruption rather than organic demand growth. This categorisation helps explain why the inflation signal embedded in oil prices is translating into gold weakness rather than strength. However, viewing gold as a strategic investment over a longer horizon reframes many of these short-term pressures as temporary rather than structural.
The next major ASX story will hit our subscribers first
The Bull and Bear Cases for Gold in This Environment
The Bear Case
The structural headwinds facing gold in the near term are meaningful:
- Persistent crude oil strength translates into elevated inflation expectations that keep rate cut hopes at bay.
- A resilient U.S. dollar, supported by higher Treasury yields, reduces gold's appeal for international buyers priced in other currencies.
- Forward rate markets continue to price a high probability of at least one more Fed rate hike before year-end.
- Gold's retreat from above $4,100 in a single session demonstrates how quickly technically overbought conditions can unwind.
The Bull Case
Despite near-term headwinds, the structural argument for gold remains intact across several dimensions:
- Central bank gold demand has remained a powerful price floor. Global central banks, particularly across emerging market economies, have continued accumulating gold reserves as a hedge against dollar dependency and geopolitical risk.
- Geopolitical uncertainty itself is a double-edged dynamic. The same Middle East tensions that are pushing oil higher and creating rate pressure are also sustaining a baseline level of safe-haven demand for gold.
- Record price territory: The fact that gold is trading near $4,035 to $4,100 per ounce represents historically elevated valuation, suggesting that structural demand from institutions, sovereign wealth funds, and retail investors in Asia remains robust enough to sustain prices at levels that would have seemed extraordinary just a few years ago.
- Long-term purchasing power preservation remains the primary case for gold ownership in diversified portfolios, irrespective of short-term rate volatility.
Key Catalysts Investors Are Watching Over the Next 60 Days
For investors navigating this environment, several developments will be critical in determining gold's directional bias heading into the second half of 2026:
- PPI release data: Will producer-level inflation confirm or contradict the cooling signal from June CPI?
- Federal Reserve communication: Are officials signalling concern about oil-driven inflationary re-acceleration, or maintaining patience?
- Strait of Hormuz developments: Any de-escalation in U.S.-Iran tensions would remove the primary oil supply premium and potentially reopen the door for gold's inflation hedge premium to reassert itself.
- U.S. dollar trajectory: A weakening dollar environment would provide tailwinds for gold priced internationally.
- Treasury yield movements: Real yields remain the most reliable inverse correlate for gold pricing over medium-term horizons.
FAQ: Gold, Oil, Inflation, and Interest Rates
Why does an oil price rally cause gold prices to fall?
Rising oil prices signal renewed inflationary pressure, which leads markets to anticipate that the U.S. Federal Reserve will maintain elevated rates or tighten further. Because gold produces no yield, higher interest rates make competing assets like Treasury bonds more attractive, reducing demand for gold and pushing its price lower even in an inflationary environment.
Is gold still an effective inflation hedge in 2026?
Gold's effectiveness as an inflation hedge depends heavily on the source and type of inflation. When rising prices are driven by energy supply disruptions that simultaneously push rate expectations higher, gold's hedge premium compresses in the short term. Over longer horizons, gold has historically preserved purchasing power, but cost-push inflation environments create meaningful near-term headwinds. In this respect, gold slips as oil rally keeps inflation and rate outlook on investors' radar serves as a timely reminder that context matters enormously.
What probability are markets assigning to further U.S. rate hikes?
As of mid-July 2026, CME FedWatch data indicates approximately a 58% probability of a rate hike at the September Fed meeting, down from 76% prior to the June CPI report. A December hike carries approximately an 80% market-implied probability.
What price level is gold currently trading at?
Spot gold is trading in the $4,035 to $4,042 per ounce range, having retreated from a session high above $4,100 as oil-driven inflation concerns reasserted themselves.
How are silver and platinum performing relative to gold?
Silver is experiencing mild selling pressure, declining 0.3% in broadly tracking gold's directional move. Platinum and palladium are each showing marginal gains of 0.2%, reflecting differentiated industrial demand dynamics that partially insulate them from monetary policy headwinds.
What is the Strait of Hormuz and why does it matter so significantly for global markets?
The Strait of Hormuz is a critical maritime chokepoint connecting the Persian Gulf to the Gulf of Oman, through which a substantial share of the world's seaborne crude oil transits. Disruptions to shipping through this corridor, whether from military conflict, blockades, or geopolitical confrontation, can rapidly constrain global oil supply and trigger broad inflationary pressure across commodity and financial markets worldwide.
Disclaimer: This article is intended for informational and educational purposes only and does not constitute financial advice. All market data referenced reflects conditions as of mid-July 2026. Precious metals prices are highly volatile and influenced by numerous unpredictable factors. Past performance of any asset class is not indicative of future results. Investors should consult a qualified financial adviser before making any investment decisions.
Want to Stay Ahead of the Next Major Mineral Discovery on the ASX?
While macro forces like oil prices and interest rate expectations shape the broader precious metals narrative, the real wealth-creation opportunities in resource investing often emerge at the discovery stage — and timing is everything. Discovery Alert's proprietary Discovery IQ model delivers real-time alerts the moment significant ASX mineral discoveries are announced, transforming complex geological data into actionable insights for investors of all experience levels. Explore historic discovery returns on Discovery Alert's dedicated discoveries page to understand just how transformative early positioning can be, and begin your 14-day free trial today to ensure you never miss the next major find.